Notebookcheck Logo

NVIDIA GeForce GTX 1650 (Desktop) vs NVIDIA GeForce RTX 3080 Ti vs NVIDIA GeForce GTX 1660 Ti Max-Q

NVIDIA GeForce GTX 1650 (Desktop)

► remove from comparison NVIDIA GeForce GTX 1650 (Desktop)

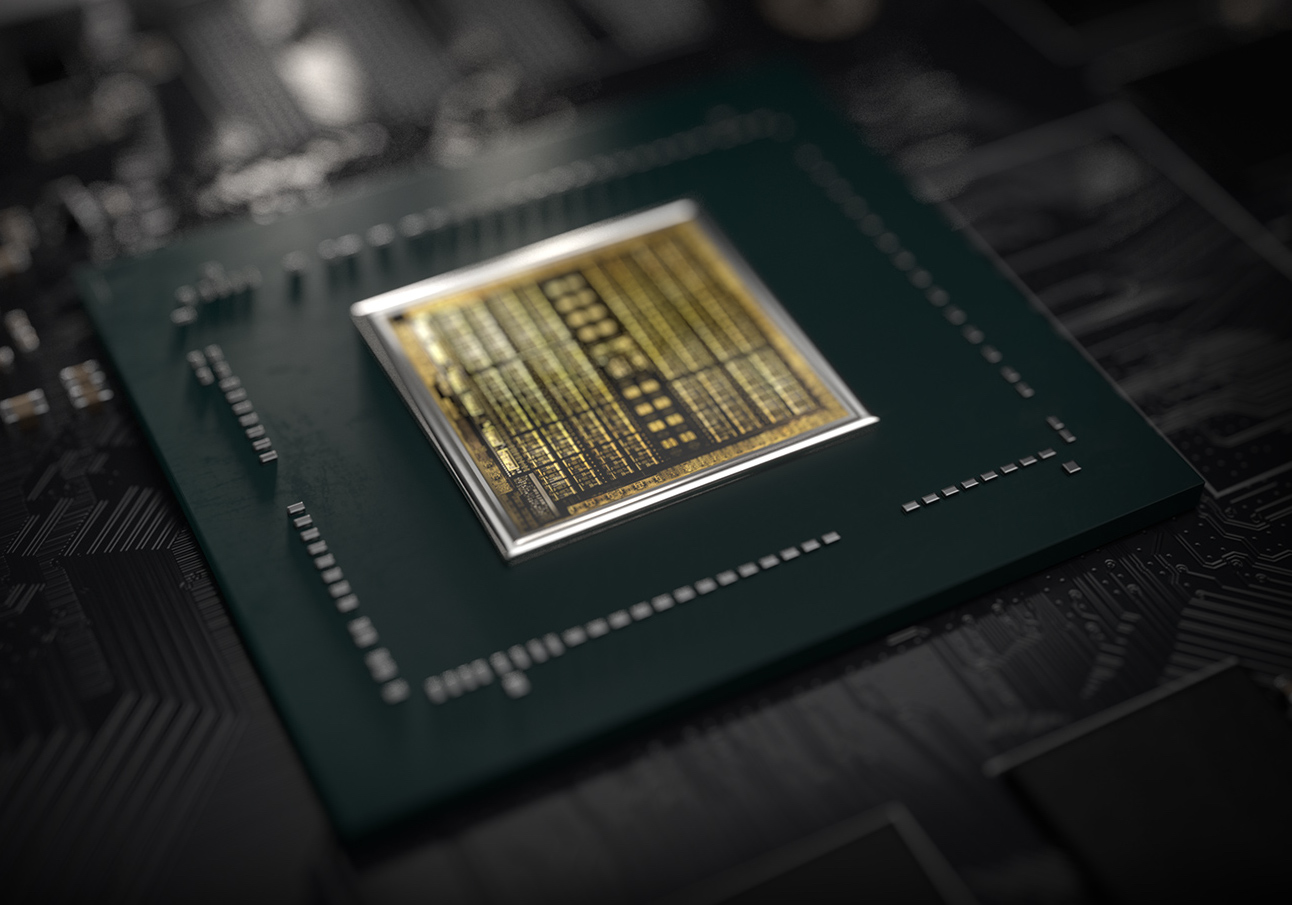
Die Nvidia GeForce GTX 1650 für Desktops ist eine Einstiegs-Gaming-Grafikkarte basierend auf der Turing Architektur. Sie basiert auf den TU117 Chip und wurde Ende April 2019 vorgestellt. Die GTX 1650 Serie bietet im Unterschied zu den stärkeren RTX 2000er Karten (z.B. RTX 2060) keine Raytracing und Tensor Kerne. Die Leistung sollte etwas oberhalb einer GTX 1050 Ti sein, jedoch bei deutlich geringerem Stromverbrauch. Obwohl die mobile Variante der GTX1650 den selben Namen trägt, ist sie etwas langsamer (durch geringere Taktung des Chips).

Bei der Turing Architektur gab es auch auf der Ebene der CUDA-Kerne deutliche Verbesserungen. Float und INT Operationen können nun gleichzeitig ausgeführt werden, der Cache wurde vereinheitlicht und verbessert und Adaptive Shading eingeführt. Nvidia spricht dadurch von einer bis zu 50% höheren Leistung pro Kern im Vergleich zu Pascal.

Im Gegensatz zu den größeren Turing Chips (wie den TU116 der GTX 1660 Ti) bietet der TU117 nur die älteren NVENC Videoenkodierung der Pascal / Volta Generation.

Nvidia spezifiziert einen Stromverbrauch von 75 Watt TGP (Total Graphics Power) für die Grafikkarte. Der TU117 Chip wird bei TSMC im 12nm FFN Verfahren gefertigt.

NVIDIA GeForce RTX 3080 Ti

► remove from comparison NVIDIA NVIDIA GeForce RTX 3080 Ti

Die Nvidia GeForce RTX 3080 Ti is zum Launch die zweit-schnellste GeForce Grafikkarte der Ampere-Generation. Sie basiert auf den selben GA102 Ampere Chip wie die teure RTX 3090, bietet aber deutlich weniger VRAM (12 vs 24 GB) und minimal weniger Shader (10.240 vs 10.496).

Im Vergleich zur RTX 3080 ist die Mehrleistung erst ab Auflösungen höher 4K spürbar, für echtes 8K-Gaming mit hohen Details reicht die Rohleistung aber nicht aus. Mit einer Leistungsaufnahme von 350 Watt braucht die GPU sehr viel Strom unter Last.

NVIDIA GeForce GTX 1660 Ti Max-Q

► remove from comparison NVIDIA GeForce GTX 1660 Ti Max-Q

Die Nvidia GeForce GTX 1660 Ti mit Max-Q Design für Laptops ist eine mobile Grafikkarte basierend auf der Turing Architektur. Sie ist gedacht für dünne und leichte Notebook und je nach Kühlungsdesign etwa 10-15% langsamer als eine normale GTX 1660 Ti für Laptops (22% geringerer Basis-Takt und 16% geringerer Boost-Takt). Sie basiert wie die Desktop-Version auf den TU116 Chip und wurde Ende April 2019 vorgestellt. Die GTX 1660 Serie bietet im Unterschied zu den stärkeren RTX 2000er Karten (z.B. RTX 2060) keine Raytracing und Tensor Kerne. Die Leistung sollte vergleichbar mit einer GTX 1070 Max-Q sein, jedoch bei deutlich geringerem Stromverbrauch von 60 Watt TGP (versus 80 Watt der Laptop 1660 Ti und 115 Watt der Desktop-Version).

Im April 2020 gab es einen Refresh der GeFroce GTX 1660 Ti Max-Q mit dem Codenamen N18E-G0-A1. Die Specs bleiben aber vergleichbar, der Chip ist im selben Package erhältlich wie die neuen RTX Chips (z.b. RTX 2070 Super).

Bei der Turing Architektur gab es auch auf der Ebene der CUDA-Kerne deutliche Verbesserungen. Float und INT Operationen können nun gleichzeitig ausgeführt werden, der Cache wurde vereinheitlicht und verbessert und Adaptive Shading eingeführt. Nvidia spricht dadurch von einer bis zu 50% höheren Leistung pro Kern im Vergleich zu Pascal.

Der Stromverbrauch ist mit 60 Watt TGP (Total Graphics Power) von Nvidia spezifiziert und damit 20 Watt unterhalb der normalen (Max-P) Version. Dadurch eignet sich die GPU auch für dünnere Gaming-Laptops. Der verbaute TU116 Chip wird bei TSMC im 12nm FFN Verfahren gefertigt.

NVIDIA GeForce GTX 1650 (Desktop)NVIDIA GeForce RTX 3080 TiNVIDIA GeForce GTX 1660 Ti Max-Q
GeForce GTX 1600 Serie
GeForce GTX 1660 Ti (Desktop) 1536 @ 1.5 - 1.77 GHz192 Bit @ 12000 MHz
GeForce GTX 1660 Super (Desktop) 1408 @ 1.53 - 1.79 GHz192 Bit @ 14000 MHz
GeForce GTX 1660 Ti Mobile 1536 @ 1.46 - 1.59 GHz192 Bit @ 12000 MHz
GeForce GTX 1660 (Desktop) 1408 @ 1.53 - 1.79 GHz192 Bit @ 8000 MHz
GeForce GTX 1650 Super (Desktop) 1280 @ 1.53 GHz192 Bit @ 14000 MHz
GeForce GTX 1660 Ti Max-Q 1536 @ 1.14 - 1.34 GHz192 Bit @ 12000 MHz
GeForce GTX 1650 Ti Mobile 1024 @ 1.35 - 1.49 GHz128 Bit @ 12000 MHz
GeForce GTX 1650 (Desktop) 896 @ 1.49 - 1.67 GHz128 Bit @ 8000 MHz
GeForce GTX 1650 Mobile 1024 @ 1.38 - 1.56 GHz128 Bit @ 12000 MHz
GeForce GTX 1650 Ti Max-Q 1024 @ 1.04 - 1.2 GHz128 Bit @ 10000 MHz
GeForce GTX 1650 Max-Q 1024 @ 1.02 - 1.25 GHz128 Bit @ 8000 MHz
NVIDIA GeForce RTX 3090 Ti 10752 @ 1.56 - 1.86 GHz384 Bit @ 21000 MHz
NVIDIA GeForce RTX 3090 10496 @ 1.4 - 1.7 GHz384 Bit @ 19500 MHz
NVIDIA GeForce RTX 3080 Ti 10240 @ 1.37 - 1.67 GHz384 Bit @ 19000 MHz
NVIDIA GeForce RTX 3080 12 GB 8960/ cores @ 1.26 - 1.71 GHz384 Bit @ 19000 MHz
NVIDIA GeForce RTX 3080 8704 @ 1.45 - 1.71 GHz320 Bit @ 19000 MHz
GeForce RTX 3070 Ti 6144 @ 1.58 - 1.77 GHz256 Bit @ 19000 MHz
GeForce RTX 3080 Ti Laptop GPU 7424 @ 0.98 - 1.59 GHz256 Bit @ 14000 MHz
NVIDIA GeForce RTX 3070 5888 @ 1.5 - 1.73 GHz256 Bit @ 14000 MHz
GeForce RTX 3080 Laptop GPU 6144 @ 0.78 - 1.25 GHz256 Bit @ 14000 MHz
NVIDIA GeForce RTX 3060 Ti 4864 @ 1.41 - 1.67 GHz256 Bit @ 14000 MHz
GeForce RTX 3070 Ti Laptop GPU 5888 @ 0.92 - 1.48 GHz256 Bit @ 14000 MHz
GeForce RTX 3070 Laptop GPU 5120 @ 0.78 - 1.29 GHz256 Bit @ 14000 MHz
NVIDIA GeForce RTX 3060 3584 @ 1.32 - 1.78 GHz192 Bit @ 15000 MHz
GeForce RTX 3080 Max-Q 6144 @ 0.78 - 1.25 GHz256 Bit @ 6000 MHz
GeForce RTX 3070 Max-Q 5120 @ 1.29 GHz256 Bit
GeForce RTX 3060 Laptop GPU 3840 @ 0.82 - 1.7 GHz192 Bit @ 14000 MHz
GeForce RTX 3060 Max-Q 3840 @ 1.28 GHz192 Bit
NVIDIA GeForce RTX 3050 2560 @ 1.55 - 1.78 GHz128 Bit Bit @ 1750 MHz
GeForce RTX 3050 Ti Laptop GPU 2560 @ 1.22 - 1.49 GHz128 Bit @ 12000 MHz
GeForce RTX 3050 6GB Laptop GPU 2560 @ 1.24 - 1.49 GHz96 Bit @ 12000 MHz
GeForce RTX 3050 A Laptop GPU 1792 64 Bit
GeForce RTX 3050 4GB Laptop GPU 2048 @ 1.24 - 1.5 GHz128 Bit @ 12000 MHz
GeForce GTX 1660 Ti (Desktop) 1536 @ 1.5 - 1.77 GHz192 Bit @ 12000 MHz
GeForce GTX 1660 Super (Desktop) 1408 @ 1.53 - 1.79 GHz192 Bit @ 14000 MHz
GeForce GTX 1660 Ti Mobile 1536 @ 1.46 - 1.59 GHz192 Bit @ 12000 MHz
GeForce GTX 1660 (Desktop) 1408 @ 1.53 - 1.79 GHz192 Bit @ 8000 MHz
GeForce GTX 1650 Super (Desktop) 1280 @ 1.53 GHz192 Bit @ 14000 MHz
GeForce GTX 1660 Ti Max-Q 1536 @ 1.14 - 1.34 GHz192 Bit @ 12000 MHz
GeForce GTX 1650 Ti Mobile 1024 @ 1.35 - 1.49 GHz128 Bit @ 12000 MHz
GeForce GTX 1650 (Desktop) 896 @ 1.49 - 1.67 GHz128 Bit @ 8000 MHz
GeForce GTX 1650 Mobile 1024 @ 1.38 - 1.56 GHz128 Bit @ 12000 MHz
GeForce GTX 1650 Ti Max-Q 1024 @ 1.04 - 1.2 GHz128 Bit @ 10000 MHz
GeForce GTX 1650 Max-Q 1024 @ 1.02 - 1.25 GHz128 Bit @ 8000 MHz
ArchitekturTuringAmpereTuring
Pipelines896 - unified10240 - unified1536 - unified
Kerntakt1485 - 1665 (Boost) MHz1370 - 1667 (Boost) MHz1140 - 1335 (Boost) MHz
Speichertakt8000 MHz19000 MHz12000 MHz
Speicherbandbreite128 Bit384 Bit192 Bit
SpeichertypGDDR5GDDR6XGDDR6
Max. Speichergröße4 GB12 GB6 GB
Shared Memoryneinneinnein
APIDirectX 12_1, Shader 6.4, OpenGL 4.6DirectX 12_2, Shader 6.7, OpenGL 4.6DirectX 12_1, OpenGL 4.6
Stromverbrauch75 Watt350 Watt60 Watt
Herstellungsprozess12 nm8 nm12 nm
Erscheinungsdatum23.04.2019 24.09.2020 23.04.2019
Herstellerseitewww.nvidia.comwww.nvidia.comwww.nvidia.com
CodenameAmpere GA102N18E-G0
Transistors28 Billion
Notebookgrößemittel (15.4" z.B.)

Benchmarks

Performance Rating - 3DMark 11 + Fire Strike + Time Spy - GeForce GTX 1650 (Desktop)
4.1 pt (12%)
Performance Rating - 3DMark 11 + Fire Strike + Time Spy - NVIDIA GeForce RTX 3080 Ti
20.8 pt (62%)
Performance Rating - 3DMark 11 + Fire Strike + Time Spy - GeForce GTX 1660 Ti Max-Q
5.9 pt (18%)
3DMark - 3DMark Time Spy Score
min: 3839     avg: 3882     median: 3879 (11%)     max: 3927 Points
min: 17433     avg: 18566     median: 18903.5 (55%)     max: 19025 Points
min: 4547     avg: 5197     median: 5072 (15%)     max: 6395 Points
3DMark - 3DMark Time Spy Graphics
min: 3492     avg: 3514     median: 3512 (9%)     max: 3538 Points
min: 19041     avg: 19237     median: 19224 (51%)     max: 19460 Points
min: 4867     avg: 5089     median: 5084.5 (13%)     max: 5440 Points
3DMark - 3DMark Ice Storm Unlimited Graphics
min: 356457     avg: 388636     median: 373333 (38%)     max: 436117 Points
min: 750291     avg: 779661     median: 785365 (79%)     max: 803326 Points
min: 220799     avg: 314100     median: 306910 (31%)     max: 414592 Points
3DMark - 3DMark Ice Storm Extreme Graphics
min: 161038     avg: 174430     median: 170403 (21%)     max: 191849 Points
min: 572351     avg: 592563     median: 593730 (74%)     max: 611608 Points
min: 76153     avg: 110626     median: 110626 (14%)     max: 145099 Points
3DMark - 3DMark Cloud Gate Score
min: 33812     avg: 36095     median: 35325 (38%)     max: 39148 Points
min: 76027     avg: 81917     median: 81921 (88%)     max: 87802 Points
min: 16807     avg: 29350     median: 33027 (35%)     max: 39942 Points
3DMark - 3DMark Cloud Gate Graphics
min: 49810     avg: 52826     median: 50549 (13%)     max: 58120 Points
min: 161798     avg: 209614     median: 218185 (57%)     max: 248858 Points
min: 38321     avg: 63736     median: 63086 (17%)     max: 89505 Points
3DMark - 3DMark Fire Strike Standard Score
min: 8362     avg: 8789     median: 8795 (16%)     max: 9209 Points
min: 32491     avg: 38344     median: 38628.5 (68%)     max: 43628 Points
min: 10103     avg: 11548     median: 11615 (20%)     max: 12739 Points
3DMark - 3DMark Fire Strike Standard Graphics
min: 9195     avg: 9372     median: 9203 (10%)     max: 9718 Points
min: 45785     avg: 47180     median: 47113 (53%)     max: 48709 Points
min: 12903     avg: 13356     median: 13355 (15%)     max: 13870 Points
3DMark - 3DMark Ice Storm Graphics
min: 200932     avg: 222320     median: 218255 (25%)     max: 247773 Points
min: 648792     avg: 672558     median: 682810 (80%)     max: 686073 Points
min: 59373     avg: 104094     median: 86295 (10%)     max: 166615 Points
3DMark - 3DMark Wild Life Unlimited
24510 Points (12%)
3DMark - 3DMark Night Raid
min: 33394     avg: 33740     median: 33740 (32%)     max: 34086 Points
min: 82972     avg: 86531     median: 86530.5 (82%)     max: 90089 Points
3DMark - 3DMark Night Raid Graphics Score
min: 43375     avg: 44052     median: 44051.5 (17%)     max: 44728 Points
min: 180232     avg: 189351     median: 189351 (73%)     max: 198470 Points
3DMark 11 - 3DM11 Performance Score
min: 13719     avg: 13894     median: 13894 (19%)     max: 14069 Points
min: 41396     avg: 46617     median: 46988 (65%)     max: 51094 Points
min: 12279     avg: 15364     median: 15913 (22%)     max: 17377 Points
3DMark 11 - 3DM11 Performance GPU
min: 13531     avg: 13645     median: 13645 (12%)     max: 13759 Points
min: 59799     avg: 60987     median: 60980 (52%)     max: 62189 Points
min: 17010     avg: 17711     median: 17439 (15%)     max: 18653 Points
3DMark Vantage
3DM Vant. Perf. total + NVIDIA GeForce GTX 1650 (Desktop)
3DMark Vantage - 3DM Vant. Perf. total
min: 42025     avg: 44694     median: 44694 (13%)     max: 47363 Points
3DM Vant. Perf. total + NVIDIA GeForce RTX 3080 Ti
min: 118753     avg: 123725     median: 120236 (35%)     max: 132187 Points
3DM Vant. Perf. total + NVIDIA GeForce GTX 1660 Ti Max-Q
31845 Points (9%)
3DM Vant. Perf. GPU no PhysX + NVIDIA GeForce GTX 1650 (Desktop)
3DMark Vantage - 3DM Vant. Perf. GPU no PhysX
min: 38335     avg: 40628     median: 40627.5 (22%)     max: 42920 Points
3DM Vant. Perf. GPU no PhysX + NVIDIA GeForce RTX 3080 Ti
min: 130100     avg: 136576     median: 135271 (74%)     max: 144357 Points
3DM Vant. Perf. GPU no PhysX + NVIDIA GeForce GTX 1660 Ti Max-Q
34951 Points (19%)
3DMark 05 - 3DMark 05 - Standard
35596 Points (39%)
min: 63621     avg: 77313     median: 82816 (91%)     max: 85501 Points
3DMark 06 3DMark 06 - Standard 1280x1024 + NVIDIA GeForce GTX 1650 (Desktop)
3DMark 06
min: 34249     avg: 39546     median: 39545.5 (52%)     max: 44842 Points
3DMark 06 - Standard 1280x1024 + NVIDIA GeForce RTX 3080 Ti
min: 66161     avg: 68191     median: 66856 (87%)     max: 71555 Points
3DMark 06 - Standard 1280x1024 + NVIDIA GeForce GTX 1660 Ti Max-Q
min: 24029     avg: 28247     median: 25211 (33%)     max: 38536 Points
Unigine Valley 1.0 - Unigine Valley 1.0 DX
min: 42.1     avg: 44.4     median: 44.4 (14%)     max: 46.6 fps
min: 206     avg: 228.3     median: 233.3 (72%)     max: 240.4 fps
Blender - Blender 3.3 Classroom CUDA *
min: 21     avg: 21.5     median: 21.5 (3%)     max: 22 Seconds
Blender - Blender 3.3 Classroom OPTIX *
min: 14     avg: 14.5     median: 14.5 (5%)     max: 15 Seconds
SPECviewperf 12
specvp12 sw-03 + NVIDIA GeForce GTX 1650 (Desktop)
SPECviewperf 12 - specvp12 sw-03
min: 43.33     avg: 45.5     median: 45.4 (11%)     max: 47.78 fps
specvp12 sw-03 + NVIDIA GeForce RTX 3080 Ti
min: 100     avg: 103.7     median: 105 (26%)     max: 106 fps
specvp12 snx-02 + NVIDIA GeForce GTX 1650 (Desktop)
SPECviewperf 12 - specvp12 snx-02
min: 6.4     avg: 6.4     median: 6.4 (1%)     max: 6.48 fps
specvp12 snx-02 + NVIDIA GeForce RTX 3080 Ti
min: 16.5     avg: 16.7     median: 16.6 (2%)     max: 17.1 fps
specvp12 showcase-01 + NVIDIA GeForce GTX 1650 (Desktop)
SPECviewperf 12 - specvp12 showcase-01
min: 50.5     avg: 51.2     median: 51.2 (11%)     max: 51.8 fps
specvp12 showcase-01 + NVIDIA GeForce RTX 3080 Ti
min: 252     avg: 256     median: 252 (55%)     max: 264 fps
specvp12 mediacal-01 + NVIDIA GeForce GTX 1650 (Desktop)
SPECviewperf 12 - specvp12 mediacal-01
min: 20.66     avg: 21.8     median: 21.4 (5%)     max: 23.29 fps
specvp12 mediacal-01 + NVIDIA GeForce RTX 3080 Ti
min: 89.4     avg: 124.8     median: 142 (36%)     max: 143 fps
specvp12 maya-04 + NVIDIA GeForce GTX 1650 (Desktop)
SPECviewperf 12 - specvp12 maya-04
min: 85.3     avg: 90.2     median: 91.4 (25%)     max: 93.9 fps
specvp12 maya-04 + NVIDIA GeForce RTX 3080 Ti
min: 283     avg: 294     median: 297 (81%)     max: 302 fps
specvp12 energy-01 + NVIDIA GeForce GTX 1650 (Desktop)
SPECviewperf 12 - specvp12 energy-01
min: 2.2     avg: 4     median: 4.7 (4%)     max: 5.03 fps
specvp12 energy-01 + NVIDIA GeForce RTX 3080 Ti
min: 24.9     avg: 26.7     median: 27.5 (25%)     max: 27.6 fps
specvp12 creo-01 + NVIDIA GeForce GTX 1650 (Desktop)
SPECviewperf 12 - specvp12 creo-01
min: 27.36     avg: 33.1     median: 34.8 (14%)     max: 37.04 fps
specvp12 creo-01 + NVIDIA GeForce RTX 3080 Ti
min: 94.3     avg: 96.3     median: 94.7 (38%)     max: 100 fps
specvp12 catia-04 + NVIDIA GeForce GTX 1650 (Desktop)
SPECviewperf 12 - specvp12 catia-04
min: 42.85     avg: 43.5     median: 43.6 (7%)     max: 43.9 fps
specvp12 catia-04 + NVIDIA GeForce RTX 3080 Ti
min: 167     avg: 172     median: 171 (28%)     max: 178 fps
specvp12 3dsmax-05 + NVIDIA GeForce GTX 1650 (Desktop)
SPECviewperf 12 - specvp12 3dsmax-05
min: 105     avg: 107.2     median: 106.4 (19%)     max: 110.1 fps
specvp12 3dsmax-05 + NVIDIA GeForce RTX 3080 Ti
min: 363     avg: 373.3     median: 372 (65%)     max: 385 fps
SPECviewperf 13 specvp13 sw-04 + NVIDIA GeForce GTX 1650 (Desktop)
SPECviewperf 13 - specvp13 sw-04
min: 60.8     avg: 64.1     median: 62.6 (17%)     max: 68.9 fps
specvp13 sw-04 + NVIDIA GeForce RTX 3080 Ti
min: 146     avg: 150.7     median: 153 (41%)     max: 153 fps
specvp13 snx-03 + NVIDIA GeForce GTX 1650 (Desktop)
SPECviewperf 13 - specvp13 snx-03
min: 11.49     avg: 11.5     median: 11.5 (1%)     max: 11.6 fps
specvp13 snx-03 + NVIDIA GeForce RTX 3080 Ti
min: 29.6     avg: 30.1     median: 29.9 (3%)     max: 30.8 fps
specvp13 showcase-02 + NVIDIA GeForce GTX 1650 (Desktop)
SPECviewperf 13 - specvp13 showcase-02
min: 49.94     avg: 50.8     median: 50.8 (11%)     max: 51.6 fps
specvp13 showcase-02 + NVIDIA GeForce RTX 3080 Ti
min: 252     avg: 256.7     median: 254 (55%)     max: 264 fps
specvp13 medical-02 + NVIDIA GeForce GTX 1650 (Desktop)
SPECviewperf 13 - specvp13 medical-02
min: 25.58     avg: 26.4     median: 26 (5%)     max: 27.66 fps
specvp13 medical-02 + NVIDIA GeForce RTX 3080 Ti
min: 106     avg: 106.3     median: 106 (22%)     max: 107 fps
specvp13 maya-05 + NVIDIA GeForce GTX 1650 (Desktop)
SPECviewperf 13 - specvp13 maya-05
min: 129.2     avg: 136.5     median: 140 (16%)     max: 140.3 fps
specvp13 maya-05 + NVIDIA GeForce RTX 3080 Ti
min: 567     avg: 574     median: 569 (65%)     max: 586 fps
specvp13 energy-02 + NVIDIA GeForce GTX 1650 (Desktop)
SPECviewperf 13 - specvp13 energy-02
min: 2.88     avg: 5.7     median: 7 (2%)     max: 7.11 fps
specvp13 energy-02 + NVIDIA GeForce RTX 3080 Ti
min: 35.8     avg: 41.4     median: 44.1 (14%)     max: 44.2 fps
specvp13 creo-02 + NVIDIA GeForce GTX 1650 (Desktop)
SPECviewperf 13 - specvp13 creo-02
min: 87.5     avg: 99.5     median: 105 (15%)     max: 106 fps
specvp13 creo-02 + NVIDIA GeForce RTX 3080 Ti
min: 389     avg: 398     median: 402 (59%)     max: 403 fps
specvp13 catia-05 + NVIDIA GeForce GTX 1650 (Desktop)
SPECviewperf 13 - specvp13 catia-05
min: 60.4     avg: 61.2     median: 61.3 (7%)     max: 61.8 fps
specvp13 catia-05 + NVIDIA GeForce RTX 3080 Ti
min: 241     avg: 251.3     median: 255 (28%)     max: 258 fps
specvp13 3dsmax-06 + NVIDIA GeForce GTX 1650 (Desktop)
SPECviewperf 13 - specvp13 3dsmax-06
min: 103     avg: 106.2     median: 105.5 (18%)     max: 110.1 fps
specvp13 3dsmax-06 + NVIDIA GeForce RTX 3080 Ti
min: 364     avg: 372.3     median: 371 (65%)     max: 382 fps
SPECviewperf 2020 specvp2020 solidworks-05 4k + NVIDIA GeForce GTX 1650 (Desktop)
SPECviewperf 2020 - specvp2020 solidworks-05 4k
21.3 fps (6%)
specvp2020 solidworks-05 4k + NVIDIA GeForce RTX 3080 Ti
184 fps (54%)
specvp2020 snx-04 4k + NVIDIA GeForce GTX 1650 (Desktop)
SPECviewperf 2020 - specvp2020 snx-04 4k
8.2 fps (1%)
specvp2020 snx-04 4k + NVIDIA GeForce RTX 3080 Ti
min: 24.7     avg: 25.2     median: 24.9 (3%)     max: 25.9 fps
specvp2020 medical-03 4k + NVIDIA GeForce GTX 1650 (Desktop)
SPECviewperf 2020 - specvp2020 medical-03 4k
3.7 fps (4%)
specvp2020 medical-03 4k + NVIDIA GeForce RTX 3080 Ti
min: 19.8     avg: 21.8     median: 22.7 (22%)     max: 22.9 fps
specvp2020 maya-06 4k + NVIDIA GeForce GTX 1650 (Desktop)
SPECviewperf 2020 - specvp2020 maya-06 4k
74 fps (12%)
specvp2020 maya-06 4k + NVIDIA GeForce RTX 3080 Ti
min: 351     avg: 356.3     median: 352 (57%)     max: 366 fps
specvp2020 energy-03 4k + NVIDIA GeForce GTX 1650 (Desktop)
SPECviewperf 2020 - specvp2020 energy-03 4k
9 fps (2%)
specvp2020 energy-03 4k + NVIDIA GeForce RTX 3080 Ti
min: 38.9     avg: 64.3     median: 57.5 (13%)     max: 96.4 fps
specvp2020 creo-03 4k + NVIDIA GeForce GTX 1650 (Desktop)
SPECviewperf 2020 - specvp2020 creo-03 4k
39.4 fps (19%)
specvp2020 creo-03 4k + NVIDIA GeForce RTX 3080 Ti
min: 108     avg: 113     median: 114 (54%)     max: 117 fps
specvp2020 catia-06 4k + NVIDIA GeForce GTX 1650 (Desktop)
SPECviewperf 2020 - specvp2020 catia-06 4k
11.5 fps (8%)
specvp2020 catia-06 4k + NVIDIA GeForce RTX 3080 Ti
min: 58.4     avg: 59.6     median: 59.9 (39%)     max: 60.4 fps
specvp2020 3dsmax-07 4k + NVIDIA GeForce GTX 1650 (Desktop)
SPECviewperf 2020 - specvp2020 3dsmax-07 4k
24.6 fps (10%)
specvp2020 3dsmax-07 4k + NVIDIA GeForce RTX 3080 Ti
min: 139     avg: 139.3     median: 139 (58%)     max: 140 fps
Cinebench R10 Cinebench R10 Shading (32bit) + NVIDIA GeForce RTX 3080 Ti
Cinebench R10 - Cinebench R10 Shading (32bit)
min: 6828     avg: 6829     median: 6829 (5%)     max: 6830 Points
Cinebench R10 Shading (32bit) + NVIDIA GeForce GTX 1660 Ti Max-Q
min: 6820     avg: 9290     median: 8562.5 (6%)     max: 13213 Points
Cinebench R11.5 Cinebench R11.5 OpenGL 64 Bit + NVIDIA GeForce RTX 3080 Ti
Cinebench R11.5 - Cinebench R11.5 OpenGL 64 Bit
min: 198.8     avg: 208.9     median: 208.9 (69%)     max: 218.92 fps
Cinebench R11.5 OpenGL 64 Bit + NVIDIA GeForce GTX 1660 Ti Max-Q
min: 49.83     avg: 59.5     median: 59.5 (20%)     max: 69.2 fps
Cinebench R15
Cinebench R15 OpenGL 64 Bit + NVIDIA GeForce GTX 1650 (Desktop)
Cinebench R15 - Cinebench R15 OpenGL 64 Bit
174.5 fps (10%)
Cinebench R15 OpenGL 64 Bit + NVIDIA GeForce RTX 3080 Ti
min: 312.84     avg: 326.4     median: 326.4 (19%)     max: 339.9 fps
Cinebench R15 OpenGL 64 Bit + NVIDIA GeForce GTX 1660 Ti Max-Q
min: 78.2     avg: 100.5     median: 96.9 (6%)     max: 130.7 fps
Cinebench R15 OpenGL Ref. Match 64 Bit + NVIDIA GeForce GTX 1650 (Desktop)
Cinebench R15 - Cinebench R15 OpenGL Ref. Match 64 Bit
99.6 % (100%)
Cinebench R15 OpenGL Ref. Match 64 Bit + NVIDIA GeForce RTX 3080 Ti
99.6 % (100%)
Cinebench R15 OpenGL Ref. Match 64 Bit + NVIDIA GeForce GTX 1660 Ti Max-Q
GFXBench - GFXBench 5.0 Aztec Ruins High Tier Offscreen
110.2 fps (20%)
GFXBench - GFXBench 5.0 Aztec Ruins Normal Tier Offscreen
253.8 fps (19%)
GFXBench - GFXBench Car Chase Offscreen
227.4 fps (26%)
GFXBench 3.1 - GFXBench Manhattan ES 3.1 Offscreen
345.8 fps (7%)
GFXBench 3.0 - GFXBench 3.0 Manhattan Offscreen
360.6 fps (21%)
GFXBench (DX / GLBenchmark) 2.7
GFXBench T-Rex HD Offscreen C24Z16 + NVIDIA GeForce GTX 1660 Ti Max-Q
GFXBench (DX / GLBenchmark) 2.7 - GFXBench T-Rex HD Offscreen C24Z16
943 fps (8%)
LuxMark v2.0 64Bit - LuxMark v2.0 Room GPU
min: 1273     avg: 1321     median: 1320.5 (6%)     max: 1368 Samples/s
min: 5772     avg: 6138     median: 6158.5 (28%)     max: 6464 Samples/s
2141 Samples/s (10%)
LuxMark v2.0 64Bit - LuxMark v2.0 Sala GPU
min: 2577     avg: 2580     median: 2579.5 (5%)     max: 2582 Samples/s
min: 14871     avg: 15612     median: 15570 (27%)     max: 16438 Samples/s
4254 Samples/s (7%)
ComputeMark v2.1 - ComputeMark v2.1 Result
min: 7011     avg: 7085     median: 7085 (8%)     max: 7159 Points
min: 47377     avg: 48266     median: 48398 (52%)     max: 48892 Points
10027 Points (11%)
Power Consumption - Furmark Stress Test Power Consumption - external Monitor *
min: 183     avg: 195.3     median: 200.4 (28%)     max: 202.5 Watt
min: 427     avg: 464.3     median: 453 (64%)     max: 513 Watt
min: 77.6     avg: 86.3     median: 86.3 (12%)     max: 95 Watt
Power Consumption - The Witcher 3 Power Consumption - external Monitor *
min: 178.9     avg: 195.2     median: 202.9 (28%)     max: 203.9 Watt
min: 490     avg: 506     median: 499 (70%)     max: 528 Watt
min: 92     avg: 96.6     median: 96.6 (13%)     max: 101.2 Watt
Power Consumption - Witcher 3 Power Consumption *
min: 94.2     avg: 104.8     median: 106.9 (24%)     max: 121 Watt
Power Consumption - Witcher 3 ultra Power Efficiency
min: 0.4388     avg: 0.5     median: 0.5 (43%)     max: 0.537 fps per Watt
Power Consumption - Witcher 3 ultra Power Efficiency - external Monitor
min: 0.1991     avg: 0.2     median: 0.2 (18%)     max: 0.2404 fps per Watt
min: 0.3496     avg: 0.4     median: 0.4 (30%)     max: 0.3735 fps per Watt
min: 0.4822     avg: 0.5     median: 0.5 (44%)     max: 0.578 fps per Watt
Emissions Witcher 3 Fan Noise + NVIDIA GeForce GTX 1660 Ti Max-Q
Emissions - Witcher 3 Fan Noise
min: 34     avg: 43.4     median: 43.7 (70%)     max: 53.8 dB(A)
Clock Speed - GPU Clock Witcher 3 ultra
1501 MHz (59%)
Clock Speed - GPU Clock Speed Furmark
1457 MHz (58%)
1062 MHz (42%)

Average Benchmarks NVIDIA GeForce GTX 1650 (Desktop) → 100% n=19

Average Benchmarks NVIDIA GeForce RTX 3080 Ti → 375% n=19

Average Benchmarks NVIDIA GeForce GTX 1660 Ti Max-Q → 108% n=19

- Bereich der Benchmarkergebnisse für diese Grafikkarte
- Durchschnittliche Benchmarkergebnisse für diese Grafikkarte
* Smaller numbers mean a higher performance
1 This benchmark is not used for the average calculation

Spiele-Benchmarks

Die folgenden Benchmarks basieren auf unseren Spieletests mit Testnotebooks. Die Performance dieser Grafikkarte bei den gelisteten Spielen ist abhängig von der verwendeten CPU, Speicherausstattung, Treiber und auch Betriebssystem. Dadurch müssen die untenstehenden Werte nicht repräsentativ sein. Detaillierte Informationen über das verwendete System sehen Sie nach einem Klick auf den fps-Wert.

low 1920x1080
NVIDIA GeForce RTX 3080 Ti:
223  fps
med. 1920x1080
NVIDIA GeForce RTX 3080 Ti:
192  fps
high 1920x1080
NVIDIA GeForce RTX 3080 Ti:
136  fps
ultra 1920x1080
NVIDIA GeForce RTX 3080 Ti:
135  fps
QHD 2560x1440
NVIDIA GeForce RTX 3080 Ti:
102  fps
4K 3840x2160
NVIDIA GeForce RTX 3080 Ti:
63  fps
low 1920x1080
NVIDIA GeForce RTX 3080 Ti:
187.7  fps
med. 1920x1080
NVIDIA GeForce RTX 3080 Ti:
175.2  fps
high 1920x1080
NVIDIA GeForce RTX 3080 Ti:
156.6  fps
ultra 1920x1080
NVIDIA GeForce RTX 3080 Ti:
139.9  fps
QHD 2560x1440
NVIDIA GeForce RTX 3080 Ti:
132.4  fps
4K 3840x2160
NVIDIA GeForce RTX 3080 Ti:
77.8  fps
low 1920x1080
NVIDIA GeForce RTX 3080 Ti:
203  fps
med. 1920x1080
NVIDIA GeForce RTX 3080 Ti:
186.1  fps
high 1920x1080
NVIDIA GeForce RTX 3080 Ti:
174.8  fps
ultra 1920x1080
NVIDIA GeForce RTX 3080 Ti:
168.9  fps
QHD 2560x1440
NVIDIA GeForce RTX 3080 Ti:
134.6  fps
4K 3840x2160
NVIDIA GeForce RTX 3080 Ti:
82.1  fps
low 1920x1080
NVIDIA GeForce RTX 3080 Ti:
180  fps
med. 1920x1080
NVIDIA GeForce RTX 3080 Ti:
170  fps
high 1920x1080
NVIDIA GeForce RTX 3080 Ti:
141  fps
ultra 1920x1080
NVIDIA GeForce RTX 3080 Ti:
140  fps
QHD 2560x1440
NVIDIA GeForce RTX 3080 Ti:
107  fps
4K 3840x2160
NVIDIA GeForce RTX 3080 Ti:
70  fps
4K DLSS 3840x2160
NVIDIA GeForce RTX 3080 Ti:
101  fps
low 1920x1080
NVIDIA GeForce RTX 3080 Ti:
121.8  fps
med. 1920x1080
NVIDIA GeForce RTX 3080 Ti:
118.4  fps
high 1920x1080
NVIDIA GeForce RTX 3080 Ti:
113.4  fps
ultra 1920x1080
NVIDIA GeForce RTX 3080 Ti:
109.7  fps
QHD 2560x1440
NVIDIA GeForce RTX 3080 Ti:
92.7  fps
4K 3840x2160
NVIDIA GeForce RTX 3080 Ti:
61.3  fps
low 1920x1080
NVIDIA GeForce RTX 3080 Ti:
180  fps
med. 1920x1080
NVIDIA GeForce RTX 3080 Ti:
158.5  fps
high 1920x1080
NVIDIA GeForce RTX 3080 Ti:
122.5  fps
ultra 1920x1080
NVIDIA GeForce RTX 3080 Ti:
93.9  fps
QHD 2560x1440
NVIDIA GeForce RTX 3080 Ti:
71.5  fps
4K 3840x2160
NVIDIA GeForce RTX 3080 Ti:
41.5  fps
FIFA 23

FIFA 23

2022
low 1920x1080
NVIDIA GeForce RTX 3080 Ti:
250  fps
med. 1920x1080
NVIDIA GeForce RTX 3080 Ti:
247  fps
high 1920x1080
NVIDIA GeForce RTX 3080 Ti:
243  fps
ultra 1920x1080
NVIDIA GeForce RTX 3080 Ti:
242  fps
QHD 2560x1440
NVIDIA GeForce RTX 3080 Ti:
234  fps
4K 3840x2160
NVIDIA GeForce RTX 3080 Ti:
165.1  fps
low 1920x1080
NVIDIA GeForce RTX 3080 Ti:
285  fps
med. 1920x1080
NVIDIA GeForce RTX 3080 Ti:
219  fps
high 1920x1080
NVIDIA GeForce RTX 3080 Ti:
181.5  fps
ultra 1920x1080
NVIDIA GeForce RTX 3080 Ti:
149.1  fps
QHD 2560x1440
NVIDIA GeForce RTX 3080 Ti:
106.9  fps
4K 3840x2160
NVIDIA GeForce RTX 3080 Ti:
60.3  fps
F1 22

F1 22

2022
low 1920x1080
NVIDIA GeForce RTX 3080 Ti:
367 433 ~ 400 fps
med. 1920x1080
NVIDIA GeForce RTX 3080 Ti:
342 430 ~ 386 fps
high 1920x1080
NVIDIA GeForce RTX 3080 Ti:
321 365 ~ 343 fps
ultra 1920x1080
NVIDIA GeForce RTX 3080 Ti:
128.8 131.6 ~ 130 fps
QHD 2560x1440
NVIDIA GeForce RTX 3080 Ti:
85.6 86.6 ~ 86 fps
4K 3840x2160
NVIDIA GeForce RTX 3080 Ti:
43 43.4 ~ 43 fps
low 1920x1080
NVIDIA GeForce RTX 3080 Ti:
496  fps
med. 1920x1080
NVIDIA GeForce RTX 3080 Ti:
384  fps
high 1920x1080
NVIDIA GeForce RTX 3080 Ti:
362  fps
ultra 1920x1080
NVIDIA GeForce RTX 3080 Ti:
349  fps
QHD 2560x1440
NVIDIA GeForce RTX 3080 Ti:
249  fps
4K 3840x2160
NVIDIA GeForce RTX 3080 Ti:
138.1  fps
low 1920x1080
NVIDIA GeForce RTX 3080 Ti:
290  fps
med. 1920x1080
NVIDIA GeForce RTX 3080 Ti:
288  fps
high 1920x1080
NVIDIA GeForce RTX 3080 Ti:
279  fps
ultra 1920x1080
NVIDIA GeForce RTX 3080 Ti:
278  fps
QHD 2560x1440
NVIDIA GeForce RTX 3080 Ti:
211  fps
4K 3840x2160
NVIDIA GeForce RTX 3080 Ti:
108.4  fps
low 1920x1080
NVIDIA GeForce RTX 3080 Ti:
355 370 ~ 363 fps
med. 1920x1080
NVIDIA GeForce RTX 3080 Ti:
291 299 ~ 295 fps
high 1920x1080
NVIDIA GeForce RTX 3080 Ti:
211 215 ~ 213 fps
ultra 1920x1080
NVIDIA GeForce RTX 3080 Ti:
168.5 171.3 ~ 170 fps
QHD 2560x1440
NVIDIA GeForce RTX 3080 Ti:
123.1 124.7 ~ 124 fps
4K 3840x2160
NVIDIA GeForce RTX 3080 Ti:
70 70.6 ~ 70 fps
low 1920x1080
NVIDIA GeForce RTX 3080 Ti:
219  fps
med. 1920x1080
NVIDIA GeForce RTX 3080 Ti:
184.4  fps
high 1920x1080
NVIDIA GeForce RTX 3080 Ti:
160.4  fps
ultra 1920x1080
NVIDIA GeForce RTX 3080 Ti:
146.4  fps
QHD 2560x1440
NVIDIA GeForce RTX 3080 Ti:
99.1  fps
4K 3840x2160
NVIDIA GeForce RTX 3080 Ti:
49.7  fps
low 1920x1080
NVIDIA GeForce RTX 3080 Ti:
317  fps
med. 1920x1080
NVIDIA GeForce RTX 3080 Ti:
289  fps
high 1920x1080
NVIDIA GeForce RTX 3080 Ti:
254  fps
ultra 1920x1080
NVIDIA GeForce RTX 3080 Ti:
223  fps
QHD 2560x1440
NVIDIA GeForce RTX 3080 Ti:
185.1  fps
4K 3840x2160
NVIDIA GeForce RTX 3080 Ti:
130.3  fps
low 1920x1080
NVIDIA GeForce RTX 3080 Ti:
189  fps
med. 1920x1080
NVIDIA GeForce RTX 3080 Ti:
164  fps
high 1920x1080
NVIDIA GeForce RTX 3080 Ti:
149  fps
QHD 2560x1440
NVIDIA GeForce RTX 3080 Ti:
109  fps
4K 3840x2160
NVIDIA GeForce RTX 3080 Ti:
61.5  fps
low 1920x1080
NVIDIA GeForce RTX 3080 Ti:
365  fps
med. 1920x1080
NVIDIA GeForce RTX 3080 Ti:
353  fps
high 1920x1080
NVIDIA GeForce RTX 3080 Ti:
348  fps
ultra 1920x1080
NVIDIA GeForce RTX 3080 Ti:
282  fps
QHD 2560x1440
NVIDIA GeForce RTX 3080 Ti:
194  fps
4K 3840x2160
NVIDIA GeForce RTX 3080 Ti:
104  fps
low 1920x1080
NVIDIA GeForce RTX 3080 Ti:
209 212 229 ~ 217 fps
med. 1920x1080
NVIDIA GeForce RTX 3080 Ti:
181 184 200 ~ 188 fps
high 1920x1080
NVIDIA GeForce RTX 3080 Ti:
163 166.6 173.6 ~ 168 fps
ultra 1920x1080
NVIDIA GeForce RTX 3080 Ti:
117 119.6 124.4 ~ 120 fps
QHD 2560x1440
NVIDIA GeForce RTX 3080 Ti:
98.7 105.8 108.1 ~ 104 fps
4K 3840x2160
NVIDIA GeForce RTX 3080 Ti:
64.7 77.5 77.8 ~ 73 fps
med. 1920x1080
NVIDIA GeForce RTX 3080 Ti:
229  fps
high 1920x1080
NVIDIA GeForce RTX 3080 Ti:
198  fps
ultra 1920x1080
NVIDIA GeForce RTX 3080 Ti:
188  fps
QHD 2560x1440
NVIDIA GeForce RTX 3080 Ti:
142  fps
4K 3840x2160
NVIDIA GeForce RTX 3080 Ti:
83.1  fps
low 1280x720
NVIDIA GeForce RTX 3080 Ti:
349  fps
med. 1920x1080
NVIDIA GeForce RTX 3080 Ti:
270  fps
high 1920x1080
NVIDIA GeForce RTX 3080 Ti:
226  fps
ultra 1920x1080
NVIDIA GeForce RTX 3080 Ti:
203  fps
QHD 2560x1440
NVIDIA GeForce RTX 3080 Ti:
201  fps
4K 3840x2160
NVIDIA GeForce RTX 3080 Ti:
157  fps
low 1280x720
NVIDIA GeForce RTX 3080 Ti:
216  fps
med. 1920x1080
NVIDIA GeForce RTX 3080 Ti:
194  fps
high 1920x1080
NVIDIA GeForce RTX 3080 Ti:
169  fps
ultra 1920x1080
NVIDIA GeForce RTX 3080 Ti:
150  fps
QHD 2560x1440
NVIDIA GeForce RTX 3080 Ti:
123  fps
4K 3840x2160
NVIDIA GeForce RTX 3080 Ti:
83  fps
low 1280x720
100%
GeForce GTX 1650 (Desktop):
143  fps
196%
NVIDIA GeForce RTX 3080 Ti:
256 291 292 ~ 280 fps
med. 1920x1080
100%
GeForce GTX 1650 (Desktop):
73  fps
277%
NVIDIA GeForce RTX 3080 Ti:
191 200 215 ~ 202 fps
high 1920x1080
100%
GeForce GTX 1650 (Desktop):
62  fps
308%
NVIDIA GeForce RTX 3080 Ti:
182 188 204 ~ 191 fps
ultra 1920x1080
100%
GeForce GTX 1650 (Desktop):
26  fps
508%
NVIDIA GeForce RTX 3080 Ti:
126 129 141 ~ 132 fps
QHD 2560x1440
100%
GeForce GTX 1650 (Desktop):
22  fps
532%
NVIDIA GeForce RTX 3080 Ti:
111 117 124 ~ 117 fps
4K 3840x2160
100%
GeForce GTX 1650 (Desktop):
15  fps
580%
NVIDIA GeForce RTX 3080 Ti:
84 87 90 ~ 87 fps
low 1280x720
100%
GeForce GTX 1650 (Desktop):
120  fps
237%
NVIDIA GeForce RTX 3080 Ti:
284  fps
med. 1920x1080
100%
GeForce GTX 1650 (Desktop):
60  fps
367%
NVIDIA GeForce RTX 3080 Ti:
220  fps
high 1920x1080
100%
GeForce GTX 1650 (Desktop):
46  fps
409%
NVIDIA GeForce RTX 3080 Ti:
188  fps
ultra 1920x1080
100%
GeForce GTX 1650 (Desktop):
41  fps
429%
NVIDIA GeForce RTX 3080 Ti:
176  fps
QHD 2560x1440
100%
GeForce GTX 1650 (Desktop):
27  fps
504%
NVIDIA GeForce RTX 3080 Ti:
136  fps
4K 3840x2160
NVIDIA GeForce RTX 3080 Ti:
80  fps
low 1280x720
100%
GeForce GTX 1650 (Desktop):
80  fps
243%
NVIDIA GeForce RTX 3080 Ti:
194  fps
med. 1920x1080
100%
GeForce GTX 1650 (Desktop):
53  fps
370%
NVIDIA GeForce RTX 3080 Ti:
196  fps
high 1920x1080
100%
GeForce GTX 1650 (Desktop):
51  fps
375%
NVIDIA GeForce RTX 3080 Ti:
191  fps
ultra 1920x1080
100%
GeForce GTX 1650 (Desktop):
50  fps
382%
NVIDIA GeForce RTX 3080 Ti:
191  fps
QHD 2560x1440
100%
GeForce GTX 1650 (Desktop):
32  fps
581%
NVIDIA GeForce RTX 3080 Ti:
186  fps
4K 3840x2160
100%
GeForce GTX 1650 (Desktop):
13  fps
846%
NVIDIA GeForce RTX 3080 Ti:
110  fps
med. 1920x1080
100%
GeForce GTX 1650 (Desktop):
96.5  fps
high 1920x1080
100%
GeForce GTX 1650 (Desktop):
84.9  fps
ultra 1920x1080
100%
GeForce GTX 1650 (Desktop):
77.8  fps
QHD 2560x1440
100%
GeForce GTX 1650 (Desktop):
48.4  fps
4K 3840x2160
100%
GeForce GTX 1650 (Desktop):
23.2  fps
Far Cry 6

Far Cry 6

2021
low 1280x720
100%
GeForce GTX 1650 (Desktop):
104  fps
201%
NVIDIA GeForce RTX 3080 Ti:
200 211 216 ~ 209 fps
med. 1920x1080
100%
GeForce GTX 1650 (Desktop):
40  fps
453%
NVIDIA GeForce RTX 3080 Ti:
176 180.4 188 ~ 181 fps
high 1920x1080
100%
GeForce GTX 1650 (Desktop):
54  fps
298%
NVIDIA GeForce RTX 3080 Ti:
155 160.6 167.6 ~ 161 fps
ultra 1920x1080
100%
GeForce GTX 1650 (Desktop):
45  fps
318%
NVIDIA GeForce RTX 3080 Ti:
120.7 149 159.6 ~ 143 fps
QHD 2560x1440
100%
GeForce GTX 1650 (Desktop):
6  fps
2233%
NVIDIA GeForce RTX 3080 Ti:
129 136 136.9 ~ 134 fps
4K 3840x2160
NVIDIA GeForce RTX 3080 Ti:
81.6 86 86.2 ~ 85 fps
med. 1920x1080
100%
GeForce GTX 1650 (Desktop):
90.1  fps
high 1920x1080
100%
GeForce GTX 1650 (Desktop):
84.4  fps
QHD 2560x1440
100%
GeForce GTX 1650 (Desktop):
74.6  fps
4K 3840x2160
100%
GeForce GTX 1650 (Desktop):
42.6  fps
New World

New World

2021
low 1280x720
100%
GeForce GTX 1650 (Desktop):
106  fps
183%
NVIDIA GeForce RTX 3080 Ti:
194  fps
med. 1920x1080
100%
GeForce GTX 1650 (Desktop):
50.7  fps
325%
NVIDIA GeForce RTX 3080 Ti:
165  fps
high 1920x1080
100%
GeForce GTX 1650 (Desktop):
45.9  fps
333%
NVIDIA GeForce RTX 3080 Ti:
153  fps
ultra 1920x1080
100%
GeForce GTX 1650 (Desktop):
35.7  fps
398%
NVIDIA GeForce RTX 3080 Ti:
142  fps
QHD 2560x1440
100%
GeForce GTX 1650 (Desktop):
28.8  fps
462%
NVIDIA GeForce RTX 3080 Ti:
133  fps
4K 3840x2160
100%
GeForce GTX 1650 (Desktop):
16.1  fps
492%
NVIDIA GeForce RTX 3080 Ti:
79.2  fps
Deathloop

Deathloop

2021
low 1280x720
100%
GeForce GTX 1650 (Desktop):
98.4  fps
med. 1920x1080
100%
GeForce GTX 1650 (Desktop):
51.4  fps
high 1920x1080
100%
GeForce GTX 1650 (Desktop):
40  fps
ultra 1920x1080
100%
GeForce GTX 1650 (Desktop):
31.4  fps
QHD 2560x1440
100%
GeForce GTX 1650 (Desktop):
20  fps
4K 3840x2160
100%
GeForce GTX 1650 (Desktop):
3.1  fps
F1 2021

F1 2021

2021
low 1280x720
100%
GeForce GTX 1650 (Desktop):
248  fps
241%
NVIDIA GeForce RTX 3080 Ti:
534 615 643 ~ 597 fps
med. 1920x1080
100%
GeForce GTX 1650 (Desktop):
118  fps
450%
NVIDIA GeForce RTX 3080 Ti:
498 525 569 ~ 531 fps
high 1920x1080
100%
GeForce GTX 1650 (Desktop):
96.8  fps
447%
NVIDIA GeForce RTX 3080 Ti:
410 428 460 ~ 433 fps
ultra 1920x1080
100%
GeForce GTX 1650 (Desktop):
61  fps
370%
NVIDIA GeForce RTX 3080 Ti:
219 225 234 ~ 226 fps
QHD 2560x1440
100%
GeForce GTX 1650 (Desktop):
44.3  fps
395%
NVIDIA GeForce RTX 3080 Ti:
170 174.3 180.2 ~ 175 fps
4K 3840x2160
100%
GeForce GTX 1650 (Desktop):
25.1  fps
410%
NVIDIA GeForce RTX 3080 Ti:
101 103.2 105.6 ~ 103 fps
low 1280x720
100%
GeForce GTX 1650 (Desktop):
144  fps
med. 1920x1080
100%
GeForce GTX 1650 (Desktop):
128  fps
high 1920x1080
100%
GeForce GTX 1650 (Desktop):
94.3  fps
QHD 2560x1440
100%
GeForce GTX 1650 (Desktop):
54.4  fps
Days Gone

Days Gone

2021
low 1280x720
100%
GeForce GTX 1650 (Desktop):
111  fps
med. 1920x1080
100%
GeForce GTX 1650 (Desktop):
63.1  fps
high 1920x1080
100%
GeForce GTX 1650 (Desktop):
55.2  fps
ultra 1920x1080
100%
GeForce GTX 1650 (Desktop):
39.7  fps
448%
NVIDIA GeForce RTX 3080 Ti:
178  fps
QHD 2560x1440
100%
GeForce GTX 1650 (Desktop):
28.2  fps
486%
NVIDIA GeForce RTX 3080 Ti:
137  fps
4K 3840x2160
100%
GeForce GTX 1650 (Desktop):
15.5  fps
537%
NVIDIA GeForce RTX 3080 Ti:
83.3  fps
low 1280x720
100%
GeForce GTX 1650 (Desktop):
116  fps
ultra 1920x1080
100%
GeForce GTX 1650 (Desktop):
101  fps
QHD 2560x1440
100%
GeForce GTX 1650 (Desktop):
69  fps
4K 3840x2160
100%
GeForce GTX 1650 (Desktop):
33.9  fps
low 1280x720
100%
GeForce GTX 1650 (Desktop):
177  fps
med. 1920x1080
100%
GeForce GTX 1650 (Desktop):
71.8  fps
high 1920x1080
100%
GeForce GTX 1650 (Desktop):
63.4  fps
ultra 1920x1080
100%
GeForce GTX 1650 (Desktop):
50.6  fps
462%
NVIDIA GeForce RTX 3080 Ti:
234  fps
QHD 2560x1440
100%
GeForce GTX 1650 (Desktop):
34.2  fps
582%
NVIDIA GeForce RTX 3080 Ti:
199  fps
4K 3840x2160
100%
GeForce GTX 1650 (Desktop):
15.5  fps
735%
NVIDIA GeForce RTX 3080 Ti:
114  fps
Outriders

Outriders

2021
low 1280x720
100%
GeForce GTX 1650 (Desktop):
142  fps
med. 1920x1080
100%
GeForce GTX 1650 (Desktop):
69.5  fps
high 1920x1080
100%
GeForce GTX 1650 (Desktop):
54.6  fps
ultra 1920x1080
100%
GeForce GTX 1650 (Desktop):
42.2  fps
351%
NVIDIA GeForce RTX 3080 Ti:
148  fps
QHD 2560x1440
100%
GeForce GTX 1650 (Desktop):
32.4  fps
466%
NVIDIA GeForce RTX 3080 Ti:
151  fps
4K 3840x2160
100%
GeForce GTX 1650 (Desktop):
27.7  fps
302%
NVIDIA GeForce RTX 3080 Ti:
83.7  fps
Hitman 3

Hitman 3

2021
low 1280x720
100%
GeForce GTX 1650 (Desktop):
173  fps
med. 1920x1080
100%
GeForce GTX 1650 (Desktop):
76  fps
high 1920x1080
100%
GeForce GTX 1650 (Desktop):
65  fps
ultra 1920x1080
100%
GeForce GTX 1650 (Desktop):
59  fps
453%
NVIDIA GeForce RTX 3080 Ti:
267  fps
QHD 2560x1440
100%
GeForce GTX 1650 (Desktop):
37  fps
569%
NVIDIA GeForce RTX 3080 Ti:
210.4  fps
4K 3840x2160
100%
GeForce GTX 1650 (Desktop):
19  fps
629%
NVIDIA GeForce RTX 3080 Ti:
119.6  fps
low 1280x720
100%
GeForce GTX 1650 (Desktop):
66  fps
med. 1920x1080
100%
GeForce GTX 1650 (Desktop):
34.4  fps
high 1920x1080
100%
GeForce GTX 1650 (Desktop):
28.3  fps
ultra 1920x1080
100%
GeForce GTX 1650 (Desktop):
23.7  fps
527%
NVIDIA GeForce RTX 3080 Ti:
125  fps
QHD 2560x1440
100%
GeForce GTX 1650 (Desktop):
14.5  fps
581%
NVIDIA GeForce RTX 3080 Ti:
84.3  fps
4K 3840x2160
100%
GeForce GTX 1650 (Desktop):
6  fps
707%
NVIDIA GeForce RTX 3080 Ti:
42.3  fps
low 1280x720
100%
GeForce GTX 1650 (Desktop):
80  fps
med. 1920x1080
100%
GeForce GTX 1650 (Desktop):
46  fps
high 1920x1080
100%
GeForce GTX 1650 (Desktop):
37  fps
ultra 1920x1080
100%
GeForce GTX 1650 (Desktop):
30  fps
QHD 2560x1440
100%
GeForce GTX 1650 (Desktop):
24  fps
4K 3840x2160
100%
GeForce GTX 1650 (Desktop):
13  fps
low 1280x720
100%
GeForce GTX 1650 (Desktop):
109  fps
med. 1920x1080
100%
GeForce GTX 1650 (Desktop):
48.6  fps
high 1920x1080
100%
GeForce GTX 1650 (Desktop):
46.8  fps
ultra 1920x1080
100%
GeForce GTX 1650 (Desktop):
40.6  fps
QHD 2560x1440
100%
GeForce GTX 1650 (Desktop):
26.7  fps
4K 3840x2160
100%
GeForce GTX 1650 (Desktop):
13.1  fps
low 1280x720
100%
GeForce GTX 1650 (Desktop):
114  fps
med. 1920x1080
100%
GeForce GTX 1650 (Desktop):
63.2  fps
high 1920x1080
100%
GeForce GTX 1650 (Desktop):
47  fps
ultra 1920x1080
100%
GeForce GTX 1650 (Desktop):
35.6  fps
455%
NVIDIA GeForce RTX 3080 Ti:
162  fps
QHD 2560x1440
100%
GeForce GTX 1650 (Desktop):
23.2  fps
565%
NVIDIA GeForce RTX 3080 Ti:
131  fps
4K 3840x2160
100%
GeForce GTX 1650 (Desktop):
10.6  fps
722%
NVIDIA GeForce RTX 3080 Ti:
76.5  fps
low 1280x720
100%
GeForce GTX 1650 (Desktop):
76  fps
med. 1920x1080
100%
GeForce GTX 1650 (Desktop):
47  fps
high 1920x1080
100%
GeForce GTX 1650 (Desktop):
35  fps
ultra 1920x1080
100%
GeForce GTX 1650 (Desktop):
13  fps
769%
NVIDIA GeForce RTX 3080 Ti:
100  fps
QHD 2560x1440
100%
GeForce GTX 1650 (Desktop):
13  fps
662%
NVIDIA GeForce RTX 3080 Ti:
86  fps
4K 3840x2160
100%
GeForce GTX 1650 (Desktop):
5  fps
1220%
NVIDIA GeForce RTX 3080 Ti:
61  fps
Dirt 5

Dirt 5

2020
low 1280x720
100%
GeForce GTX 1650 (Desktop):
114  fps
med. 1920x1080
100%
GeForce GTX 1650 (Desktop):
51.4  fps
high 1920x1080
100%
GeForce GTX 1650 (Desktop):
41.7  fps
ultra 1920x1080
100%
GeForce GTX 1650 (Desktop):
34.2  fps
477%
NVIDIA GeForce RTX 3080 Ti:
163  fps
QHD 2560x1440
100%
GeForce GTX 1650 (Desktop):
26.8  fps
507%
NVIDIA GeForce RTX 3080 Ti:
136  fps
4K 3840x2160
100%
GeForce GTX 1650 (Desktop):
15.5  fps
596%
NVIDIA GeForce RTX 3080 Ti:
92.4  fps
low 1280x720
100%
GeForce GTX 1650 (Desktop):
92.9  fps
med. 1920x1080
100%
GeForce GTX 1650 (Desktop):
56  fps
high 1920x1080
100%
GeForce GTX 1650 (Desktop):
47.6  fps
ultra 1920x1080
100%
GeForce GTX 1650 (Desktop):
21.2  fps
458%
NVIDIA GeForce RTX 3080 Ti:
97  fps
QHD 2560x1440
100%
GeForce GTX 1650 (Desktop):
14.3  fps
619%
NVIDIA GeForce RTX 3080 Ti:
88.5  fps
4K 3840x2160
100%
GeForce GTX 1650 (Desktop):
8  fps
732%
NVIDIA GeForce RTX 3080 Ti:
58.7  fps
FIFA 21

FIFA 21

2020
low 1280x720
100%
GeForce GTX 1650 (Desktop):
231  fps
med. 1920x1080
100%
GeForce GTX 1650 (Desktop):
224  fps
high 1920x1080
100%
GeForce GTX 1650 (Desktop):
206  fps
ultra 1920x1080
100%
GeForce GTX 1650 (Desktop):
184  fps
QHD 2560x1440
100%
GeForce GTX 1650 (Desktop):
145  fps
4K 3840x2160
100%
GeForce GTX 1650 (Desktop):
86.3  fps
low 1280x720
100%
GeForce GTX 1650 (Desktop):
312  fps
med. 1920x1080
100%
GeForce GTX 1650 (Desktop):
146  fps
high 1920x1080
100%
GeForce GTX 1650 (Desktop):
123  fps
ultra 1920x1080
100%
GeForce GTX 1650 (Desktop):
114  fps
QHD 2560x1440
100%
GeForce GTX 1650 (Desktop):
72.9  fps
4K 3840x2160
100%
GeForce GTX 1650 (Desktop):
39.6  fps
low 1280x720
100%
GeForce GTX 1650 (Desktop):
103.8  fps
med. 1920x1080
100%
GeForce GTX 1650 (Desktop):
49.7  fps
high 1920x1080
100%
GeForce GTX 1650 (Desktop):
45.2  fps
361%
NVIDIA GeForce RTX 3080 Ti:
163  fps
QHD 2560x1440
100%
GeForce GTX 1650 (Desktop):
29  fps
490%
NVIDIA GeForce RTX 3080 Ti:
142  fps
4K 3840x2160
100%
GeForce GTX 1650 (Desktop):
14.5  fps
597%
NVIDIA GeForce RTX 3080 Ti:
86.6  fps
low 1280x720
100%
GeForce GTX 1650 (Desktop):
138.7  fps
med. 1920x1080
100%
GeForce GTX 1650 (Desktop):
57.5  fps
high 1920x1080
100%
GeForce GTX 1650 (Desktop):
43.3  fps
ultra 1920x1080
100%
GeForce GTX 1650 (Desktop):
17.8  fps
QHD 2560x1440
100%
GeForce GTX 1650 (Desktop):
13.7  fps
4K 3840x2160
100%
GeForce GTX 1650 (Desktop):
9.9  fps
low 1280x720
100%
GeForce GTX 1650 (Desktop):
170  fps
med. 1920x1080
100%
GeForce GTX 1650 (Desktop):
65.2  fps
high 1920x1080
100%
GeForce GTX 1650 (Desktop):
35.5  fps
ultra 1920x1080
100%
GeForce GTX 1650 (Desktop):
27.6  fps
QHD 2560x1440
100%
GeForce GTX 1650 (Desktop):
19.6  fps
4K 3840x2160
100%
GeForce GTX 1650 (Desktop):
10.8  fps
low 1280x720
100%
GeForce GTX 1650 (Desktop):
76.7  fps
72%
GeForce GTX 1660 Ti Max-Q:
55.1  fps
med. 1920x1080
100%
GeForce GTX 1650 (Desktop):
35.6  fps
139%
GeForce GTX 1660 Ti Max-Q:
49.4  fps
high 1920x1080
100%
GeForce GTX 1650 (Desktop):
25.3  fps
147%
GeForce GTX 1660 Ti Max-Q:
37.1  fps
ultra 1920x1080
100%
GeForce GTX 1650 (Desktop):
17  fps
149%
GeForce GTX 1660 Ti Max-Q:
25.3  fps
QHD 2560x1440
100%
GeForce GTX 1650 (Desktop):
12.3  fps
4K 3840x2160
100%
GeForce GTX 1650 (Desktop):
5  fps
low 1280x720
100%
GeForce GTX 1650 (Desktop):
99  fps
120%
GeForce GTX 1660 Ti Max-Q:
119  fps
med. 1920x1080
100%
GeForce GTX 1650 (Desktop):
55  fps
142%
GeForce GTX 1660 Ti Max-Q:
78  fps
high 1920x1080
100%
GeForce GTX 1650 (Desktop):
46  fps
141%
GeForce GTX 1660 Ti Max-Q:
65  fps
ultra 1920x1080
100%
GeForce GTX 1650 (Desktop):
36  fps
142%
GeForce GTX 1660 Ti Max-Q:
51  fps
QHD 2560x1440
100%
GeForce GTX 1650 (Desktop):
26  fps
4K 3840x2160
100%
GeForce GTX 1650 (Desktop):
15  fps
low 1280x720
100%
GeForce GTX 1650 (Desktop):
98.2  fps
139%
GeForce GTX 1660 Ti Max-Q:
136.1  fps
med. 1920x1080
100%
GeForce GTX 1650 (Desktop):
58.7  fps
149%
GeForce GTX 1660 Ti Max-Q:
87.7  fps
high 1920x1080
100%
GeForce GTX 1650 (Desktop):
54.4  fps
149%
GeForce GTX 1660 Ti Max-Q:
81.3  fps
ultra 1920x1080
100%
GeForce GTX 1650 (Desktop):
52.7  fps
149%
GeForce GTX 1660 Ti Max-Q:
78.4  fps
QHD 2560x1440
100%
GeForce GTX 1650 (Desktop):
35.6  fps
4K 3840x2160
100%
GeForce GTX 1650 (Desktop):
17.3  fps
F1 2020

F1 2020

2020
low 1280x720
100%
GeForce GTX 1650 (Desktop):
219  fps
236%
NVIDIA GeForce RTX 3080 Ti:
478 520 553 ~ 517 fps
100%
GeForce GTX 1660 Ti Max-Q:
219  fps
med. 1920x1080
100%
GeForce GTX 1650 (Desktop):
115  fps
374%
NVIDIA GeForce RTX 3080 Ti:
379 448 463 ~ 430 fps
113%
GeForce GTX 1660 Ti Max-Q:
130  fps
high 1920x1080
100%
GeForce GTX 1650 (Desktop):
88.1  fps
472%
NVIDIA GeForce RTX 3080 Ti:
397 419 432 ~ 416 fps
127%
GeForce GTX 1660 Ti Max-Q:
112  fps
ultra 1920x1080
100%
GeForce GTX 1650 (Desktop):
60.3  fps
509%
NVIDIA GeForce RTX 3080 Ti:
298 310 313 ~ 307 fps
131%
GeForce GTX 1660 Ti Max-Q:
79  fps
QHD 2560x1440
100%
GeForce GTX 1650 (Desktop):
42.9  fps
555%
NVIDIA GeForce RTX 3080 Ti:
233 240 242 ~ 238 fps
4K 3840x2160
100%
GeForce GTX 1650 (Desktop):
23.4  fps
620%
NVIDIA GeForce RTX 3080 Ti:
143 145.2 145.9 ~ 145 fps
Valorant

Valorant

2020
low 1280x720
100%
GeForce GTX 1650 (Desktop):
341.7  fps
med. 1920x1080
100%
GeForce GTX 1650 (Desktop):
291.8  fps
high 1920x1080
100%
GeForce GTX 1650 (Desktop):
260.1  fps
QHD 2560x1440
100%
GeForce GTX 1650 (Desktop):
176.6  fps
4K 3840x2160
100%
GeForce GTX 1650 (Desktop):
82.8  fps
low 1280x720
100%
GeForce GTX 1650 (Desktop):
252.9 259.1 ~ 256 fps
84%
GeForce GTX 1660 Ti Max-Q:
214.7  fps
med. 1920x1080
100%
GeForce GTX 1650 (Desktop):
86.7 95.8 ~ 91 fps
143%
GeForce GTX 1660 Ti Max-Q:
130.2  fps
high 1920x1080
100%
GeForce GTX 1650 (Desktop):
56 62.2 ~ 59 fps
135%
GeForce GTX 1660 Ti Max-Q:
79.9  fps
ultra 1920x1080
100%
GeForce GTX 1650 (Desktop):
39.4 40.1 ~ 40 fps
353%
NVIDIA GeForce RTX 3080 Ti:
141.1  fps
140%
GeForce GTX 1660 Ti Max-Q:
56.1  fps
QHD 2560x1440
100%
GeForce GTX 1650 (Desktop):
26 27.8 ~ 27 fps
546%
NVIDIA GeForce RTX 3080 Ti:
147.5  fps
4K 3840x2160
100%
GeForce GTX 1650 (Desktop):
14.4 15 ~ 15 fps
589%
NVIDIA GeForce RTX 3080 Ti:
88.3  fps
low 1280x720
100%
GeForce GTX 1650 (Desktop):
116 163 ~ 140 fps
121%
GeForce GTX 1660 Ti Max-Q:
168.9  fps
med. 1920x1080
100%
GeForce GTX 1650 (Desktop):
80.4 90.2 ~ 85 fps
120%
GeForce GTX 1660 Ti Max-Q:
101.7  fps
high 1920x1080
100%
GeForce GTX 1650 (Desktop):
61.4 77.2 ~ 69 fps
138%
GeForce GTX 1660 Ti Max-Q:
95.4  fps
ultra 1920x1080
100%
GeForce GTX 1650 (Desktop):
69.5  fps
558%
NVIDIA GeForce RTX 3080 Ti:
388  fps
134%
GeForce GTX 1660 Ti Max-Q:
93.4  fps
QHD 2560x1440
100%
GeForce GTX 1650 (Desktop):
40.3  fps
784%
NVIDIA GeForce RTX 3080 Ti:
316  fps
4K 3840x2160
100%
GeForce GTX 1650 (Desktop):
20.8  fps
918%
NVIDIA GeForce RTX 3080 Ti:
191  fps
low 1280x720
100%
GeForce GTX 1650 (Desktop):
138 153 ~ 146 fps
121%
GeForce GTX 1660 Ti Max-Q:
176.8  fps
med. 1920x1080
100%
GeForce GTX 1650 (Desktop):
50.2 60.8 ~ 56 fps
145%
GeForce GTX 1660 Ti Max-Q:
81.2  fps
high 1920x1080
100%
GeForce GTX 1650 (Desktop):
44.9 46.7 ~ 46 fps
138%
GeForce GTX 1660 Ti Max-Q:
63.3  fps
QHD 2560x1440
100%
GeForce GTX 1650 (Desktop):
27.1 29.3 ~ 28 fps
4K 3840x2160
100%
GeForce GTX 1650 (Desktop):
12.5 25.7 ~ 19 fps
low 1280x720
100%
GeForce GTX 1650 (Desktop):
119  fps
102%
GeForce GTX 1660 Ti Max-Q:
121.2  fps
med. 1920x1080
100%
GeForce GTX 1650 (Desktop):
81.1  fps
121%
GeForce GTX 1660 Ti Max-Q:
98.3  fps
high 1920x1080
100%
GeForce GTX 1650 (Desktop):
74.2  fps
122%
GeForce GTX 1660 Ti Max-Q:
90.5  fps
ultra 1920x1080
100%
GeForce GTX 1650 (Desktop):
59.6  fps
147%
GeForce GTX 1660 Ti Max-Q:
87.7  fps
QHD 2560x1440
100%
GeForce GTX 1650 (Desktop):
38.4  fps
4K 3840x2160
100%
GeForce GTX 1650 (Desktop):
18.7  fps
low 1280x720
100%
GeForce GTX 1650 (Desktop):
99 111 ~ 105 fps
110%
GeForce GTX 1660 Ti Max-Q:
115.1  fps
med. 1920x1080
100%
GeForce GTX 1650 (Desktop):
50.4 54 ~ 52 fps
138%
GeForce GTX 1660 Ti Max-Q:
71.7  fps
high 1920x1080
100%
GeForce GTX 1650 (Desktop):
33.4 34 ~ 34 fps
139%
GeForce GTX 1660 Ti Max-Q:
47.2  fps
ultra 1920x1080
100%
GeForce GTX 1650 (Desktop):
21.5 22 ~ 22 fps
509%
NVIDIA GeForce RTX 3080 Ti:
112  fps
134%
GeForce GTX 1660 Ti Max-Q:
29.4  fps
QHD 2560x1440
100%
GeForce GTX 1650 (Desktop):
17.1  fps
541%
NVIDIA GeForce RTX 3080 Ti:
92.5  fps
4K 3840x2160
NVIDIA GeForce RTX 3080 Ti:
62.7  fps
med. 1920x1080
100%
GeForce GTX 1650 (Desktop):
77 77.7 ~ 77 fps
119%
GeForce GTX 1660 Ti Max-Q:
91.5  fps
high 1920x1080
100%
GeForce GTX 1650 (Desktop):
61 65.5 ~ 63 fps
124%
GeForce GTX 1660 Ti Max-Q:
78.1  fps
ultra 1920x1080
100%
GeForce GTX 1650 (Desktop):
52.8 54.9 ~ 54 fps
134%
GeForce GTX 1660 Ti Max-Q:
72.4  fps
QHD 2560x1440
100%
GeForce GTX 1650 (Desktop):
33.1 36.3 ~ 35 fps
4K 3840x2160
100%
GeForce GTX 1650 (Desktop):
16.2 17 ~ 17 fps
low 1280x720
100%
GeForce GTX 1650 (Desktop):
113 114 ~ 114 fps
84%
GeForce GTX 1660 Ti Max-Q:
95.8  fps
med. 1920x1080
100%
GeForce GTX 1650 (Desktop):
64.4 65 ~ 65 fps
128%
GeForce GTX 1660 Ti Max-Q:
83  fps
high 1920x1080
100%
GeForce GTX 1650 (Desktop):
53.6 56.7 ~ 55 fps
134%
GeForce GTX 1660 Ti Max-Q:
73.9  fps
ultra 1920x1080
100%
GeForce GTX 1650 (Desktop):
39 48.4 ~ 44 fps
152%
GeForce GTX 1660 Ti Max-Q:
66.9  fps
QHD 2560x1440
100%
GeForce GTX 1650 (Desktop):
17.7 20.6 ~ 19 fps
4K 3840x2160
100%
GeForce GTX 1650 (Desktop):
17.1 17.3 ~ 17 fps
low 1280x720
100%
GeForce GTX 1650 (Desktop):
110 118 ~ 114 fps
119%
GeForce GTX 1660 Ti Max-Q:
135.2  fps
med. 1920x1080
100%
GeForce GTX 1650 (Desktop):
74 78 ~ 76 fps
116%
GeForce GTX 1660 Ti Max-Q:
88  fps
high 1920x1080
100%
GeForce GTX 1650 (Desktop):
61 65 ~ 63 fps
115%
GeForce GTX 1660 Ti Max-Q:
72.6  fps
ultra 1920x1080
100%
GeForce GTX 1650 (Desktop):
51.7 54 ~ 53 fps
118%
GeForce GTX 1660 Ti Max-Q:
62.6  fps
QHD 2560x1440
100%
GeForce GTX 1650 (Desktop):
35.7 37 ~ 36 fps
4K 3840x2160
100%
GeForce GTX 1650 (Desktop):
19.1 21 ~ 20 fps
GRID 2019

GRID 2019

2019
low 1280x720
100%
GeForce GTX 1650 (Desktop):
148 155 ~ 152 fps
74%
GeForce GTX 1660 Ti Max-Q:
112.9  fps
med. 1920x1080
100%
GeForce GTX 1650 (Desktop):
82 86 ~ 84 fps
103%
GeForce GTX 1660 Ti Max-Q:
86.5  fps
high 1920x1080
100%
GeForce GTX 1650 (Desktop):
68 70 ~ 69 fps
104%
GeForce GTX 1660 Ti Max-Q:
72  fps
ultra 1920x1080
100%
GeForce GTX 1650 (Desktop):
43.1 45 ~ 44 fps
133%
GeForce GTX 1660 Ti Max-Q:
58.7  fps
QHD 2560x1440
100%
GeForce GTX 1650 (Desktop):
31.1 32 ~ 32 fps
4K 3840x2160
100%
GeForce GTX 1650 (Desktop):
17.4 18 ~ 18 fps
low 1280x720
100%
GeForce GTX 1650 (Desktop):
92  fps
108%
GeForce GTX 1660 Ti Max-Q:
83 114 ~ 99 fps
med. 1920x1080
100%
GeForce GTX 1650 (Desktop):
52  fps
135%
GeForce GTX 1660 Ti Max-Q:
68 72 ~ 70 fps
high 1920x1080
100%
GeForce GTX 1650 (Desktop):
46  fps
143%
GeForce GTX 1660 Ti Max-Q:
65 66 ~ 66 fps
ultra 1920x1080
100%
GeForce GTX 1650 (Desktop):
8  fps
625%
GeForce GTX 1660 Ti Max-Q:
48 51 ~ 50 fps
FIFA 20

FIFA 20

2019
low 1280x720
100%
GeForce GTX 1650 (Desktop):
237 263 ~ 250 fps
59%
GeForce GTX 1660 Ti Max-Q:
147.9  fps
med. 1920x1080
100%
GeForce GTX 1650 (Desktop):
215 236 ~ 226 fps
64%
GeForce GTX 1660 Ti Max-Q:
145.4  fps
high 1920x1080
100%
GeForce GTX 1650 (Desktop):
192 219 ~ 206 fps
68%
GeForce GTX 1660 Ti Max-Q:
141  fps
ultra 1920x1080
100%
GeForce GTX 1650 (Desktop):
137 184 ~ 161 fps
87%
GeForce GTX 1660 Ti Max-Q:
139.3  fps
QHD 2560x1440
100%
GeForce GTX 1650 (Desktop):
107 141 ~ 124 fps
4K 3840x2160
100%
GeForce GTX 1650 (Desktop):
69.9 86 ~ 78 fps
low 1280x720
100%
GeForce GTX 1650 (Desktop):
138.2  fps
164%
NVIDIA GeForce RTX 3080 Ti:
208 229 241 ~ 226 fps
74%
GeForce GTX 1660 Ti Max-Q:
87 116.5 ~ 102 fps
med. 1920x1080
100%
GeForce GTX 1650 (Desktop):
62.5  fps
314%
NVIDIA GeForce RTX 3080 Ti:
181 195.3 213 ~ 196 fps
123%
GeForce GTX 1660 Ti Max-Q:
72.1 81.5 ~ 77 fps
high 1920x1080
100%
GeForce GTX 1650 (Desktop):
40.2  fps
445%
NVIDIA GeForce RTX 3080 Ti:
167 179.7 189.7 ~ 179 fps
134%
GeForce GTX 1660 Ti Max-Q:
52.9 54.9 ~ 54 fps
ultra 1920x1080
100%
GeForce GTX 1650 (Desktop):
30.1  fps
502%
NVIDIA GeForce RTX 3080 Ti:
129 152 160 164.9 ~ 151 fps
140%
GeForce GTX 1660 Ti Max-Q:
41.5 42.3 ~ 42 fps
QHD 2560x1440
100%
GeForce GTX 1650 (Desktop):
17.1  fps
725%
NVIDIA GeForce RTX 3080 Ti:
114 125 128.7 130.2 ~ 124 fps
4K 3840x2160
100%
GeForce GTX 1650 (Desktop):
6  fps
1217%
NVIDIA GeForce RTX 3080 Ti:
71.2 72 73.8 74 ~ 73 fps
Control

Control

2019
low 1280x720
100%
GeForce GTX 1650 (Desktop):
137  fps
175%
NVIDIA GeForce RTX 3080 Ti:
240 240 ~ 240 fps
116%
GeForce GTX 1660 Ti Max-Q:
158.3  fps
med. 1920x1080
100%
GeForce GTX 1650 (Desktop):
45.4  fps
520%
NVIDIA GeForce RTX 3080 Ti:
233 238 ~ 236 fps
140%
GeForce GTX 1660 Ti Max-Q:
63.7  fps
high 1920x1080
100%
GeForce GTX 1650 (Desktop):
33.3  fps
559%
NVIDIA GeForce RTX 3080 Ti:
181 187 190.7 ~ 186 fps
141%
GeForce GTX 1660 Ti Max-Q:
47.1  fps
QHD 2560x1440
100%
GeForce GTX 1650 (Desktop):
20.7  fps
599%
NVIDIA GeForce RTX 3080 Ti:
122 124 125.5 ~ 124 fps
4K 3840x2160
100%
GeForce GTX 1650 (Desktop):
8.1  fps
790%
NVIDIA GeForce RTX 3080 Ti:
63.9 64 64.9 ~ 64 fps
F1 2019

F1 2019

2019
low 1280x720
100%
GeForce GTX 1650 (Desktop):
203  fps
83%
GeForce GTX 1660 Ti Max-Q:
155 183 ~ 169 fps
med. 1920x1080
100%
GeForce GTX 1650 (Desktop):
104  fps
125%
GeForce GTX 1660 Ti Max-Q:
119 140 ~ 130 fps
high 1920x1080
100%
GeForce GTX 1650 (Desktop):
89  fps
126%
GeForce GTX 1660 Ti Max-Q:
106 117 ~ 112 fps
ultra 1920x1080
100%
GeForce GTX 1650 (Desktop):
52  fps
142%
GeForce GTX 1660 Ti Max-Q:
71 77 ~ 74 fps
QHD 2560x1440
100%
GeForce GTX 1650 (Desktop):
39  fps
4K 3840x2160
100%
GeForce GTX 1650 (Desktop):
20  fps
low 1280x720
100%
GeForce GTX 1650 (Desktop):
197.2 202.1 ~ 200 fps
89%
GeForce GTX 1660 Ti Max-Q:
144.1 209.4 ~ 177 fps
med. 1920x1080
100%
GeForce GTX 1650 (Desktop):
64.9 68.5 ~ 67 fps
127%
GeForce GTX 1660 Ti Max-Q:
76.5 93.1 ~ 85 fps
high 1920x1080
100%
GeForce GTX 1650 (Desktop):
39.1 41.5 ~ 40 fps
140%
GeForce GTX 1660 Ti Max-Q:
54.7 57.1 ~ 56 fps
ultra 1920x1080
100%
GeForce GTX 1650 (Desktop):
26.4 27 ~ 27 fps
560%
NVIDIA GeForce RTX 3080 Ti:
151.2  fps
152%
GeForce GTX 1660 Ti Max-Q:
41.1 41.6 ~ 41 fps
QHD 2560x1440
100%
GeForce GTX 1650 (Desktop):
15.2 15.7 ~ 15 fps
689%
NVIDIA GeForce RTX 3080 Ti:
103.4  fps
4K 3840x2160
100%
GeForce GTX 1650 (Desktop):
15 15.2 ~ 15 fps
343%
NVIDIA GeForce RTX 3080 Ti:
51.4  fps
Rage 2

Rage 2

2019
low 1280x720
100%
GeForce GTX 1650 (Desktop):
128  fps
118%
GeForce GTX 1660 Ti Max-Q:
146.4 154.7 ~ 151 fps
med. 1920x1080
100%
GeForce GTX 1650 (Desktop):
57.6  fps
128%
GeForce GTX 1660 Ti Max-Q:
70.9 76.2 ~ 74 fps
high 1920x1080
100%
GeForce GTX 1650 (Desktop):
44.4  fps
140%
GeForce GTX 1660 Ti Max-Q:
58.7 65.8 ~ 62 fps
ultra 1920x1080
100%
GeForce GTX 1650 (Desktop):
43.7  fps
142%
GeForce GTX 1660 Ti Max-Q:
58.2 64.8 ~ 62 fps
QHD 2560x1440
100%
GeForce GTX 1650 (Desktop):
27.9  fps
4K 3840x2160
100%
GeForce GTX 1650 (Desktop):
12.7  fps
Anno 1800

Anno 1800

2019
low 1280x720
100%
GeForce GTX 1650 (Desktop):
94  fps
169%
NVIDIA GeForce RTX 3080 Ti:
159  fps
79%
GeForce GTX 1660 Ti Max-Q:
59.6 87.9 ~ 74 fps
med. 1920x1080
100%
GeForce GTX 1650 (Desktop):
79  fps
206%
NVIDIA GeForce RTX 3080 Ti:
163  fps
90%
GeForce GTX 1660 Ti Max-Q:
58.7 83.2 ~ 71 fps
high 1920x1080
100%
GeForce GTX 1650 (Desktop):
48.7  fps
255%
NVIDIA GeForce RTX 3080 Ti:
124  fps
113%
GeForce GTX 1660 Ti Max-Q:
45.3 64.1 ~ 55 fps
ultra 1920x1080
100%
GeForce GTX 1650 (Desktop):
26.3  fps
264%
NVIDIA GeForce RTX 3080 Ti:
69.4  fps
114%
GeForce GTX 1660 Ti Max-Q:
26 33.2 ~ 30 fps
QHD 2560x1440
100%
GeForce GTX 1650 (Desktop):
18.5  fps
357%
NVIDIA GeForce RTX 3080 Ti:
66.1  fps
4K 3840x2160
100%
GeForce GTX 1650 (Desktop):
10.7  fps
522%
NVIDIA GeForce RTX 3080 Ti:
55.9  fps
low 1280x720
100%
GeForce GTX 1650 (Desktop):
155  fps
81%
GeForce GTX 1660 Ti Max-Q:
110 142 ~ 126 fps
med. 1920x1080
100%
GeForce GTX 1650 (Desktop):
71  fps
118%
GeForce GTX 1660 Ti Max-Q:
80 87 ~ 84 fps
high 1920x1080
100%
GeForce GTX 1650 (Desktop):
55  fps
124%
GeForce GTX 1660 Ti Max-Q:
66 69 ~ 68 fps
ultra 1920x1080
100%
GeForce GTX 1650 (Desktop):
39  fps
367%
NVIDIA GeForce RTX 3080 Ti:
143  fps
128%
GeForce GTX 1660 Ti Max-Q:
49 50 ~ 50 fps
QHD 2560x1440
100%
GeForce GTX 1650 (Desktop):
26  fps
465%
NVIDIA GeForce RTX 3080 Ti:
121  fps
4K 3840x2160
100%
GeForce GTX 1650 (Desktop):
12  fps
638%
NVIDIA GeForce RTX 3080 Ti:
76.6  fps
low 1280x720
100%
GeForce GTX 1650 (Desktop):
255  fps
74%
GeForce GTX 1660 Ti Max-Q:
181.2 194.2 ~ 188 fps
med. 1920x1080
100%
GeForce GTX 1650 (Desktop):
105  fps
115%
GeForce GTX 1660 Ti Max-Q:
102.6 139.9 ~ 121 fps
high 1920x1080
100%
GeForce GTX 1650 (Desktop):
87  fps
110%
GeForce GTX 1660 Ti Max-Q:
88.7 103.2 ~ 96 fps
ultra 1920x1080
100%
GeForce GTX 1650 (Desktop):
47.9  fps
121%
GeForce GTX 1660 Ti Max-Q:
57.3 59.2 ~ 58 fps
Anthem

Anthem

2019
low 1280x720
100%
GeForce GTX 1650 (Desktop):
93  fps
58%
GeForce GTX 1660 Ti Max-Q:
53.6  fps
med. 1920x1080
100%
GeForce GTX 1650 (Desktop):
55.5  fps
88%
GeForce GTX 1660 Ti Max-Q:
48.9  fps
high 1920x1080
100%
GeForce GTX 1650 (Desktop):
48.3  fps
101%
GeForce GTX 1660 Ti Max-Q:
48.8  fps
ultra 1920x1080
100%
GeForce GTX 1650 (Desktop):
46.9  fps
99%
GeForce GTX 1660 Ti Max-Q:
46.4  fps
QHD 2560x1440
100%
GeForce GTX 1650 (Desktop):
32.3  fps
4K 3840x2160
100%
GeForce GTX 1650 (Desktop):
16.6  fps
low 1280x720
100%
GeForce GTX 1650 (Desktop):
109 120 ~ 115 fps
170%
NVIDIA GeForce RTX 3080 Ti:
190 199 200 ~ 196 fps
84%
GeForce GTX 1660 Ti Max-Q:
97  fps
med. 1920x1080
100%
GeForce GTX 1650 (Desktop):
64 68 ~ 66 fps
259%
NVIDIA GeForce RTX 3080 Ti:
165 174 175 ~ 171 fps
123%
GeForce GTX 1660 Ti Max-Q:
81  fps
high 1920x1080
100%
GeForce GTX 1650 (Desktop):
60 63 ~ 62 fps
265%
NVIDIA GeForce RTX 3080 Ti:
157 167 169 ~ 164 fps
126%
GeForce GTX 1660 Ti Max-Q:
78  fps
ultra 1920x1080
100%
GeForce GTX 1650 (Desktop):
55 58 ~ 57 fps
249%
NVIDIA GeForce RTX 3080 Ti:
122 141 150 153 ~ 142 fps
125%
GeForce GTX 1660 Ti Max-Q:
71  fps
QHD 2560x1440
100%
GeForce GTX 1650 (Desktop):
39 42 ~ 41 fps
332%
NVIDIA GeForce RTX 3080 Ti:
118 137 144 146 ~ 136 fps
4K 3840x2160
100%
GeForce GTX 1650 (Desktop):
20 21 ~ 21 fps
510%
NVIDIA GeForce RTX 3080 Ti:
100 107 109 110 ~ 107 fps
low 1280x720
100%
GeForce GTX 1650 (Desktop):
84.5 107 ~ 96 fps
278%
NVIDIA GeForce RTX 3080 Ti:
241 258 303 ~ 267 fps
107%
GeForce GTX 1660 Ti Max-Q:
83.5 96.6 129.5 ~ 103 fps
med. 1920x1080
100%
GeForce GTX 1650 (Desktop):
42 48 ~ 45 fps
473%
NVIDIA GeForce RTX 3080 Ti:
200 212 227 ~ 213 fps
133%
GeForce GTX 1660 Ti Max-Q:
53.9 60 66.5 ~ 60 fps
high 1920x1080
100%
GeForce GTX 1650 (Desktop):
31 35.2 ~ 33 fps
521%
NVIDIA GeForce RTX 3080 Ti:
165.8 169 179.8 ~ 172 fps
142%
GeForce GTX 1660 Ti Max-Q:
45.1 46.6 49.1 ~ 47 fps
ultra 1920x1080
100%
GeForce GTX 1650 (Desktop):
25.4 27.7 ~ 27 fps
500%
NVIDIA GeForce RTX 3080 Ti:
131 131 134 137 144.2 ~ 135 fps
137%
GeForce GTX 1660 Ti Max-Q:
35.1 36.8 38.3 ~ 37 fps
QHD 2560x1440
100%
GeForce GTX 1650 (Desktop):
19.3 21.3 ~ 20 fps
570%
NVIDIA GeForce RTX 3080 Ti:
110 113 115 118 ~ 114 fps
4K 3840x2160
100%
GeForce GTX 1650 (Desktop):
11.6 12.1 ~ 12 fps
633%
NVIDIA GeForce RTX 3080 Ti:
74.2 75 76.5 77.1 ~ 76 fps
low 1280x720
100%
GeForce GTX 1650 (Desktop):
144 144 ~ 144 fps
100%
GeForce GTX 1660 Ti Max-Q:
144 144 ~ 144 fps
med. 1920x1080
100%
GeForce GTX 1650 (Desktop):
90 111 ~ 101 fps
119%
GeForce GTX 1660 Ti Max-Q:
105.3 133.9 ~ 120 fps
high 1920x1080
100%
GeForce GTX 1650 (Desktop):
70 76 ~ 73 fps
130%
GeForce GTX 1660 Ti Max-Q:
90.1 99.6 ~ 95 fps
ultra 1920x1080
100%
GeForce GTX 1650 (Desktop):
67 71.3 ~ 69 fps
136%
GeForce GTX 1660 Ti Max-Q:
89 99.6 ~ 94 fps
QHD 2560x1440
100%
GeForce GTX 1650 (Desktop):
48.6 50.4 ~ 50 fps
4K 3840x2160
100%
GeForce GTX 1650 (Desktop):
27 27.1 ~ 27 fps
low 1280x720
100%
GeForce GTX 1650 (Desktop):
118  fps
med. 1920x1080
100%
GeForce GTX 1650 (Desktop):
80  fps
high 1920x1080
100%
GeForce GTX 1650 (Desktop):
58.2  fps
ultra 1920x1080
100%
GeForce GTX 1650 (Desktop):
54.1  fps
QHD 2560x1440
100%
GeForce GTX 1650 (Desktop):
36.3  fps
4K 3840x2160
100%
GeForce GTX 1650 (Desktop):
17.4  fps
low 1280x720
100%
GeForce GTX 1650 (Desktop):
208  fps
65%
GeForce GTX 1660 Ti Max-Q:
135.6  fps
med. 1920x1080
100%
GeForce GTX 1650 (Desktop):
82  fps
105%
GeForce GTX 1660 Ti Max-Q:
85.8  fps
high 1920x1080
100%
GeForce GTX 1650 (Desktop):
63  fps
123%
GeForce GTX 1660 Ti Max-Q:
77.4  fps
ultra 1920x1080
100%
GeForce GTX 1650 (Desktop):
55.8  fps
130%
GeForce GTX 1660 Ti Max-Q:
72.8  fps
QHD 2560x1440
100%
GeForce GTX 1650 (Desktop):
33.1  fps
4K 3840x2160
100%
GeForce GTX 1650 (Desktop):
10.6  fps
low 1280x720
100%
GeForce GTX 1650 (Desktop):
109  fps
111%
GeForce GTX 1660 Ti Max-Q:
94.3 117.4 152 ~ 121 fps
med. 1920x1080
100%
GeForce GTX 1650 (Desktop):
61  fps
143%
GeForce GTX 1660 Ti Max-Q:
74.6 82.9 102.6 ~ 87 fps
high 1920x1080
100%
GeForce GTX 1650 (Desktop):
52.6  fps
150%
GeForce GTX 1660 Ti Max-Q:
65.9 77.5 92.2 ~ 79 fps
ultra 1920x1080
100%
GeForce GTX 1650 (Desktop):
50.6  fps
387%
NVIDIA GeForce RTX 3080 Ti:
196  fps
144%
GeForce GTX 1660 Ti Max-Q:
61 73 85 ~ 73 fps
QHD 2560x1440
100%
GeForce GTX 1650 (Desktop):
39.4  fps
487%
NVIDIA GeForce RTX 3080 Ti:
192  fps
4K 3840x2160
100%
GeForce GTX 1650 (Desktop):
21.4  fps
636%
NVIDIA GeForce RTX 3080 Ti:
136  fps
177%
GeForce GTX 1660 Ti Max-Q:
37.9  fps
low 1280x720
100%
GeForce GTX 1650 (Desktop):
186  fps
med. 1920x1080
100%
GeForce GTX 1650 (Desktop):
150  fps
high 1920x1080
100%
GeForce GTX 1650 (Desktop):
103  fps
ultra 1920x1080
100%
GeForce GTX 1650 (Desktop):
76  fps
QHD 2560x1440
100%
GeForce GTX 1650 (Desktop):
51.9  fps
4K 3840x2160
100%
GeForce GTX 1650 (Desktop):
26.8  fps
Hitman 2

Hitman 2

2018
low 1280x720
100%
GeForce GTX 1650 (Desktop):
85  fps
med. 1920x1080
100%
GeForce GTX 1650 (Desktop):
66  fps
high 1920x1080
100%
GeForce GTX 1650 (Desktop):
60  fps
ultra 1920x1080
100%
GeForce GTX 1650 (Desktop):
55.1  fps
QHD 2560x1440
100%
GeForce GTX 1650 (Desktop):
38  fps
4K 3840x2160
100%
GeForce GTX 1650 (Desktop):
17.5  fps
low 1280x720
100%
GeForce GTX 1650 (Desktop):
196  fps
59%
GeForce GTX 1660 Ti Max-Q:
115.2  fps
med. 1920x1080
100%
GeForce GTX 1650 (Desktop):
79  fps
111%
GeForce GTX 1660 Ti Max-Q:
87.9  fps
high 1920x1080
100%
GeForce GTX 1650 (Desktop):
75  fps
113%
GeForce GTX 1660 Ti Max-Q:
84.6  fps
ultra 1920x1080
100%
GeForce GTX 1650 (Desktop):
68  fps
122%
GeForce GTX 1660 Ti Max-Q:
83.1  fps
QHD 2560x1440
100%
GeForce GTX 1650 (Desktop):
42.2  fps
4K 3840x2160
100%
GeForce GTX 1650 (Desktop):
20.1  fps
low 1280x720
100%
GeForce GTX 1650 (Desktop):
84  fps
80%
GeForce GTX 1660 Ti Max-Q:
48 64 90 ~ 67 fps
med. 1920x1080
100%
GeForce GTX 1650 (Desktop):
53  fps
108%
GeForce GTX 1660 Ti Max-Q:
43 56 71 ~ 57 fps
high 1920x1080
100%
GeForce GTX 1650 (Desktop):
47  fps
106%
GeForce GTX 1660 Ti Max-Q:
39 51 60 ~ 50 fps
ultra 1920x1080
100%
GeForce GTX 1650 (Desktop):
25  fps
160%
GeForce GTX 1660 Ti Max-Q:
33 42 44 ~ 40 fps
QHD 2560x1440
100%
GeForce GTX 1650 (Desktop):
18  fps
4K 3840x2160
100%
GeForce GTX 1650 (Desktop):
13  fps
low 1280x720
100%
GeForce GTX 1650 (Desktop):
139  fps
med. 1920x1080
100%
GeForce GTX 1650 (Desktop):
90  fps
high 1920x1080
100%
GeForce GTX 1650 (Desktop):
83  fps
ultra 1920x1080
100%
GeForce GTX 1650 (Desktop):
65  fps
QHD 2560x1440
100%
GeForce GTX 1650 (Desktop):
46  fps
4K 3840x2160
100%
GeForce GTX 1650 (Desktop):
30  fps
FIFA 19

FIFA 19

2018
low 1280x720
100%
GeForce GTX 1650 (Desktop):
294  fps
med. 1920x1080
100%
GeForce GTX 1650 (Desktop):
229  fps
high 1920x1080
100%
GeForce GTX 1650 (Desktop):
201  fps
ultra 1920x1080
100%
GeForce GTX 1650 (Desktop):
172  fps
QHD 2560x1440
100%
GeForce GTX 1650 (Desktop):
122  fps
4K 3840x2160
100%
GeForce GTX 1650 (Desktop):
69  fps
low 1280x720
100%
GeForce GTX 1650 (Desktop):
132  fps
220%
NVIDIA GeForce RTX 3080 Ti:
245 336 ~ 291 fps
73%
GeForce GTX 1660 Ti Max-Q:
62 82 113 126 ~ 96 fps
med. 1920x1080
100%
GeForce GTX 1650 (Desktop):
58  fps
426%
NVIDIA GeForce RTX 3080 Ti:
226 267 ~ 247 fps
121%
GeForce GTX 1660 Ti Max-Q:
53 57 83 85 ~ 70 fps
high 1920x1080
100%
GeForce GTX 1650 (Desktop):
50  fps
480%
NVIDIA GeForce RTX 3080 Ti:
226 254 ~ 240 fps
128%
GeForce GTX 1660 Ti Max-Q:
52 53 74 75 ~ 64 fps
ultra 1920x1080
100%
GeForce GTX 1650 (Desktop):
44  fps
475%
NVIDIA GeForce RTX 3080 Ti:
178 212 238 ~ 209 fps
130%
GeForce GTX 1660 Ti Max-Q:
49 49 64 67 ~ 57 fps
QHD 2560x1440
100%
GeForce GTX 1650 (Desktop):
29  fps
569%
NVIDIA GeForce RTX 3080 Ti:
157 164 173.3 ~ 165 fps
4K 3840x2160
100%
GeForce GTX 1650 (Desktop):
13  fps
731%
NVIDIA GeForce RTX 3080 Ti:
93 93.7 98.6 ~ 95 fps
Strange Brigade

Strange Brigade

2018
low 1280x720
100%
GeForce GTX 1650 (Desktop):
245  fps
268%
NVIDIA GeForce RTX 3080 Ti:
613 667 692 ~ 657 fps
med. 1920x1080
100%
GeForce GTX 1650 (Desktop):
94.4  fps
529%
NVIDIA GeForce RTX 3080 Ti:
484 489 523 ~ 499 fps
high 1920x1080
100%
GeForce GTX 1650 (Desktop):
74  fps
547%
NVIDIA GeForce RTX 3080 Ti:
392 407 415 ~ 405 fps
ultra 1920x1080
100%
GeForce GTX 1650 (Desktop):
62.2  fps
571%
NVIDIA GeForce RTX 3080 Ti:
345 359 360 ~ 355 fps
QHD 2560x1440
100%
GeForce GTX 1650 (Desktop):
44.7  fps
595%
NVIDIA GeForce RTX 3080 Ti:
260 269 270 ~ 266 fps
4K 3840x2160
100%
GeForce GTX 1650 (Desktop):
25.7  fps
623%
NVIDIA GeForce RTX 3080 Ti:
156 161 161.8 ~ 160 fps
F1 2018

F1 2018

2018
low 1280x720
100%
GeForce GTX 1650 (Desktop):
195  fps
med. 1920x1080
100%
GeForce GTX 1650 (Desktop):
115  fps
high 1920x1080
100%
GeForce GTX 1650 (Desktop):
89  fps
ultra 1920x1080
100%
GeForce GTX 1650 (Desktop):
58  fps
QHD 2560x1440
100%
GeForce GTX 1650 (Desktop):
46  fps
4K 3840x2160
100%
GeForce GTX 1650 (Desktop):
25  fps
low 1280x720
100%
GeForce GTX 1650 (Desktop):
135  fps
50%
GeForce GTX 1660 Ti Max-Q:
66.9  fps
med. 1920x1080
100%
GeForce GTX 1650 (Desktop):
58.4  fps
102%
GeForce GTX 1660 Ti Max-Q:
59.3  fps
high 1920x1080
100%
GeForce GTX 1650 (Desktop):
54.2  fps
110%
GeForce GTX 1660 Ti Max-Q:
59.5  fps
ultra 1920x1080
100%
GeForce GTX 1650 (Desktop):
40.8  fps
125%
GeForce GTX 1660 Ti Max-Q:
50.8  fps
QHD 2560x1440
100%
GeForce GTX 1650 (Desktop):
34.8  fps
4K 3840x2160
100%
GeForce GTX 1650 (Desktop):
12  fps
low 1280x720
100%
GeForce GTX 1650 (Desktop):
60  fps
med. 1920x1080
100%
GeForce GTX 1650 (Desktop):
59.9  fps
high 1920x1080
100%
GeForce GTX 1650 (Desktop):
59.8  fps
ultra 1920x1080
100%
GeForce GTX 1650 (Desktop):
53.2  fps
QHD 2560x1440
100%
GeForce GTX 1650 (Desktop):
35.1  fps
4K 3840x2160
100%
GeForce GTX 1650 (Desktop):
17  fps
Far Cry 5

Far Cry 5

2018
low 1280x720
100%
GeForce GTX 1650 (Desktop):
123 135 ~ 129 fps
184%
NVIDIA GeForce RTX 3080 Ti:
230 239 242 ~ 237 fps
67%
GeForce GTX 1660 Ti Max-Q:
68 103 ~ 86 fps
med. 1920x1080
100%
GeForce GTX 1650 (Desktop):
66 69 ~ 68 fps
304%
NVIDIA GeForce RTX 3080 Ti:
200 208 212 ~ 207 fps
101%
GeForce GTX 1660 Ti Max-Q:
54 84 ~ 69 fps
high 1920x1080
100%
GeForce GTX 1650 (Desktop):
60 63 ~ 62 fps
318%
NVIDIA GeForce RTX 3080 Ti:
190 198 204 ~ 197 fps
106%
GeForce GTX 1660 Ti Max-Q:
53 79 ~ 66 fps
ultra 1920x1080
100%
GeForce GTX 1650 (Desktop):
56 59 ~ 58 fps
316%
NVIDIA GeForce RTX 3080 Ti:
175 186 188 ~ 183 fps
107%
GeForce GTX 1660 Ti Max-Q:
50 74 ~ 62 fps
QHD 2560x1440
100%
GeForce GTX 1650 (Desktop):
38 40 ~ 39 fps
446%
NVIDIA GeForce RTX 3080 Ti:
168 176 177 ~ 174 fps
4K 3840x2160
100%
GeForce GTX 1650 (Desktop):
19 19 ~ 19 fps
574%
NVIDIA GeForce RTX 3080 Ti:
108 109 109 ~ 109 fps
158%
GeForce GTX 1660 Ti Max-Q:
30  fps
World of Tanks enCore

World of Tanks enCore

2018
low 1366x768
GeForce GTX 1660 Ti Max-Q:
376.8  fps
med. 1920x1080
GeForce GTX 1660 Ti Max-Q:
215.9  fps
ultra 1920x1080
GeForce GTX 1660 Ti Max-Q:
117.3  fps
low 1280x720
100%
GeForce GTX 1650 (Desktop):
123  fps
177%
NVIDIA GeForce RTX 3080 Ti:
205 216 232 ~ 218 fps
66%
GeForce GTX 1660 Ti Max-Q:
60.6 68.8 93.7 102.3 ~ 81 fps
med. 1920x1080
100%
GeForce GTX 1650 (Desktop):
110  fps
171%
NVIDIA GeForce RTX 3080 Ti:
178 182.8 202 ~ 188 fps
65%
GeForce GTX 1660 Ti Max-Q:
54.5 62.9 80.4 88.1 ~ 71 fps
high 1920x1080
100%
GeForce GTX 1650 (Desktop):
89.6  fps
157%
NVIDIA GeForce RTX 3080 Ti:
135 140.1 148.8 ~ 141 fps
69%
GeForce GTX 1660 Ti Max-Q:
47.8 55.4 67.8 75.4 ~ 62 fps
4K 3840x2160
100%
GeForce GTX 1650 (Desktop):
66.9  fps
181%
NVIDIA GeForce RTX 3080 Ti:
118 118 127.3 ~ 121 fps
low 1280x720
100%
GeForce GTX 1650 (Desktop):
139  fps
90%
GeForce GTX 1660 Ti Max-Q:
125.6  fps
med. 1920x1080
100%
GeForce GTX 1650 (Desktop):
64  fps
143%
GeForce GTX 1660 Ti Max-Q:
91.7  fps
high 1920x1080
100%
GeForce GTX 1650 (Desktop):
52  fps
149%
GeForce GTX 1660 Ti Max-Q:
77.3  fps
ultra 1920x1080
100%
GeForce GTX 1650 (Desktop):
38.6  fps
139%
GeForce GTX 1660 Ti Max-Q:
53.7  fps
QHD 2560x1440
100%
GeForce GTX 1650 (Desktop):
24.2  fps
4K 3840x2160
100%
GeForce GTX 1650 (Desktop):
11.5  fps
low 1280x720
100%
GeForce GTX 1650 (Desktop):
57.2 108 ~ 83 fps
282%
NVIDIA GeForce RTX 3080 Ti:
232 234 235 ~ 234 fps
127%
GeForce GTX 1660 Ti Max-Q:
78.4 106.4 131 ~ 105 fps
med. 1920x1080
100%
GeForce GTX 1650 (Desktop):
50.1 55.3 ~ 53 fps
432%
NVIDIA GeForce RTX 3080 Ti:
227 229 232 ~ 229 fps
128%
GeForce GTX 1660 Ti Max-Q:
60.3 70.3 74.1 ~ 68 fps
high 1920x1080
100%
GeForce GTX 1650 (Desktop):
35.7 41.2 ~ 38 fps
476%
NVIDIA GeForce RTX 3080 Ti:
175 180.6 186.4 ~ 181 fps
132%
GeForce GTX 1660 Ti Max-Q:
44.9 50 54.6 ~ 50 fps
QHD 2560x1440
100%
GeForce GTX 1650 (Desktop):
28.9  fps
484%
NVIDIA GeForce RTX 3080 Ti:
136 141 142 ~ 140 fps
4K 3840x2160
100%
GeForce GTX 1650 (Desktop):
12.5 15.8 ~ 14 fps
607%
NVIDIA GeForce RTX 3080 Ti:
84 84.2 86.4 ~ 85 fps
Fortnite

Fortnite

2018
low 1280x720
100%
GeForce GTX 1650 (Desktop):
250  fps
55%
GeForce GTX 1660 Ti Max-Q:
138  fps
med. 1920x1080
100%
GeForce GTX 1650 (Desktop):
211  fps
44%
GeForce GTX 1660 Ti Max-Q:
92.2  fps
high 1920x1080
100%
GeForce GTX 1650 (Desktop):
85  fps
105%
GeForce GTX 1660 Ti Max-Q:
89.5  fps
ultra 1920x1080
100%
GeForce GTX 1650 (Desktop):
61  fps
129%
GeForce GTX 1660 Ti Max-Q:
78.6  fps
QHD 2560x1440
100%
GeForce GTX 1650 (Desktop):
41.7  fps
4K 3840x2160
100%
GeForce GTX 1650 (Desktop):
11.3  fps
low 1280x720
100%
GeForce GTX 1650 (Desktop):
227  fps
med. 1920x1080
100%
GeForce GTX 1650 (Desktop):
181  fps
high 1920x1080
100%
GeForce GTX 1650 (Desktop):
82  fps
ultra 1920x1080
100%
GeForce GTX 1650 (Desktop):
54.4  fps
QHD 2560x1440
100%
GeForce GTX 1650 (Desktop):
44.7  fps
4K 3840x2160
100%
GeForce GTX 1650 (Desktop):
27.5  fps
low 1280x720
100%
GeForce GTX 1650 (Desktop):
102  fps
med. 1920x1080
100%
GeForce GTX 1650 (Desktop):
63  fps
high 1920x1080
100%
GeForce GTX 1650 (Desktop):
57  fps
ultra 1920x1080
100%
GeForce GTX 1650 (Desktop):
47  fps
QHD 2560x1440
100%
GeForce GTX 1650 (Desktop):
33  fps
4K 3840x2160
100%
GeForce GTX 1650 (Desktop):
17  fps
Destiny 2

Destiny 2

2017
low 1280x720
100%
GeForce GTX 1650 (Desktop):
140  fps
med. 1920x1080
100%
GeForce GTX 1650 (Desktop):
87  fps
high 1920x1080
100%
GeForce GTX 1650 (Desktop):
80  fps
ultra 1920x1080
100%
GeForce GTX 1650 (Desktop):
66  fps
QHD 2560x1440
100%
GeForce GTX 1650 (Desktop):
43.7  fps
4K 3840x2160
100%
GeForce GTX 1650 (Desktop):
22.5  fps
low 1280x720
GeForce GTX 1660 Ti Max-Q:
91  fps
med. 1920x1080
GeForce GTX 1660 Ti Max-Q:
82  fps
high 1920x1080
GeForce GTX 1660 Ti Max-Q:
72  fps
ultra 1920x1080
GeForce GTX 1660 Ti Max-Q:
61  fps
low 1280x720
100%
GeForce GTX 1650 (Desktop):
190  fps
med. 1920x1080
100%
GeForce GTX 1650 (Desktop):
90  fps
high 1920x1080
100%
GeForce GTX 1650 (Desktop):
86  fps
ultra 1920x1080
100%
GeForce GTX 1650 (Desktop):
66  fps
4K 3840x2160
100%
GeForce GTX 1650 (Desktop):
26.3  fps
Dirt 4

Dirt 4

2017
low 1280x720
100%
GeForce GTX 1650 (Desktop):
316  fps
med. 1920x1080
100%
GeForce GTX 1650 (Desktop):
165  fps
high 1920x1080
100%
GeForce GTX 1650 (Desktop):
112  fps
ultra 1920x1080
100%
GeForce GTX 1650 (Desktop):
61  fps
low 1280x720
GeForce GTX 1660 Ti Max-Q:
206.7 247.4 ~ 227 fps
med. 1920x1080
GeForce GTX 1660 Ti Max-Q:
160.8 212.1 ~ 186 fps
high 1920x1080
GeForce GTX 1660 Ti Max-Q:
141.7 173.7 ~ 158 fps
low 1280x720
100%
GeForce GTX 1650 (Desktop):
125.9  fps
104%
GeForce GTX 1660 Ti Max-Q:
130.4  fps
med. 1920x1080
100%
GeForce GTX 1650 (Desktop):
60.6  fps
129%
GeForce GTX 1660 Ti Max-Q:
78.1  fps
high 1920x1080
100%
GeForce GTX 1650 (Desktop):
55.8  fps
130%
GeForce GTX 1660 Ti Max-Q:
72.4  fps
ultra 1920x1080
100%
GeForce GTX 1650 (Desktop):
20.1  fps
206%
GeForce GTX 1660 Ti Max-Q:
41.5  fps
4K 3840x2160
100%
GeForce GTX 1650 (Desktop):
17.8  fps
For Honor

For Honor

2017
low 1280x720
100%
GeForce GTX 1650 (Desktop):
216  fps
med. 1920x1080
100%
GeForce GTX 1650 (Desktop):
81.1  fps
high 1920x1080
100%
GeForce GTX 1650 (Desktop):
77.6  fps
ultra 1920x1080
100%
GeForce GTX 1650 (Desktop):
59.3  fps
4K 3840x2160
100%
GeForce GTX 1650 (Desktop):
23.4  fps
low 1280x720
100%
GeForce GTX 1650 (Desktop):
121  fps
med. 1366x768
100%
GeForce GTX 1650 (Desktop):
102  fps
high 1920x1080
100%
GeForce GTX 1650 (Desktop):
51.7  fps
ultra 1920x1080
100%
GeForce GTX 1650 (Desktop):
32.4  fps
4K 3840x2160
100%
GeForce GTX 1650 (Desktop):
18  fps
low 1280x720
100%
GeForce GTX 1650 (Desktop):
118.3  fps
med. 1366x768
100%
GeForce GTX 1650 (Desktop):
112  fps
high 1920x1080
100%
GeForce GTX 1650 (Desktop):
71  fps
ultra 1920x1080
100%
GeForce GTX 1650 (Desktop):
58.9  fps
4K 3840x2160
100%
GeForce GTX 1650 (Desktop):
26  fps
low 1280x720
100%
GeForce GTX 1650 (Desktop):
193  fps
med. 1366x768
100%
GeForce GTX 1650 (Desktop):
158  fps
high 1920x1080
100%
GeForce GTX 1650 (Desktop):
78  fps
ultra 1920x1080
100%
GeForce GTX 1650 (Desktop):
71  fps
4K 3840x2160
100%
GeForce GTX 1650 (Desktop):
28.8  fps
low 1280x720
100%
GeForce GTX 1650 (Desktop):
130.4  fps
med. 1366x768
100%
GeForce GTX 1650 (Desktop):
97  fps
high 1920x1080
100%
GeForce GTX 1650 (Desktop):
52.5  fps
ultra 1920x1080
100%
GeForce GTX 1650 (Desktop):
27.6  fps
4K 3840x2160
100%
GeForce GTX 1650 (Desktop):
16.8  fps
Overwatch

Overwatch

2016
low 1280x720
100%
GeForce GTX 1650 (Desktop):
291  fps
67%
GeForce GTX 1660 Ti Max-Q:
193.7  fps
med. 1366x768
100%
GeForce GTX 1650 (Desktop):
300  fps
high 1920x1080
100%
GeForce GTX 1650 (Desktop):
149  fps
94%
GeForce GTX 1660 Ti Max-Q:
140.7  fps
ultra 1920x1080
100%
GeForce GTX 1650 (Desktop):
87  fps
133%
GeForce GTX 1660 Ti Max-Q:
116  fps
4K 3840x2160
100%
GeForce GTX 1650 (Desktop):
46.9  fps
Doom

Doom

2016
low 1280x720
100%
GeForce GTX 1650 (Desktop):
166  fps
med. 1366x768
100%
GeForce GTX 1650 (Desktop):
141  fps
high 1920x1080
100%
GeForce GTX 1650 (Desktop):
111  fps
ultra 1920x1080
100%
GeForce GTX 1650 (Desktop):
91  fps
4K 3840x2160
100%
GeForce GTX 1650 (Desktop):
37.2  fps
med. 1920x1080
GeForce GTX 1660 Ti Max-Q:
42.4  fps
high 1920x1080
GeForce GTX 1660 Ti Max-Q:
40.7  fps
low 1280x720
100%
GeForce GTX 1650 (Desktop):
173.4  fps
med. 1366x768
100%
GeForce GTX 1650 (Desktop):
114.7  fps
high 1920x1080
100%
GeForce GTX 1650 (Desktop):
56.1  fps
ultra 1920x1080
100%
GeForce GTX 1650 (Desktop):
40.4  fps
4K 3840x2160
100%
GeForce GTX 1650 (Desktop):
1.4  fps
low 1280x720
100%
GeForce GTX 1650 (Desktop):
120  fps
med. 1920x1080
100%
GeForce GTX 1650 (Desktop):
80  fps
high 1920x1080
100%
GeForce GTX 1650 (Desktop):
70  fps
ultra 1920x1080
100%
GeForce GTX 1650 (Desktop):
51  fps
4K 3840x2160
100%
GeForce GTX 1650 (Desktop):
22  fps
low 1024x768
100%
GeForce GTX 1650 (Desktop):
207  fps
236%
NVIDIA GeForce RTX 3080 Ti:
487 488 ~ 488 fps
45%
GeForce GTX 1660 Ti Max-Q:
93.7  fps
med. 1366x768
100%
GeForce GTX 1650 (Desktop):
122  fps
298%
NVIDIA GeForce RTX 3080 Ti:
340 388 ~ 364 fps
high 1920x1080
100%
GeForce GTX 1650 (Desktop):
66  fps
409%
NVIDIA GeForce RTX 3080 Ti:
257 282 ~ 270 fps
110%
GeForce GTX 1660 Ti Max-Q:
72.7  fps
ultra 1920x1080
100%
GeForce GTX 1650 (Desktop):
53.4  fps
434%
NVIDIA GeForce RTX 3080 Ti:
221 243 ~ 232 fps
121%
GeForce GTX 1660 Ti Max-Q:
64.5  fps
4K 3840x2160
100%
GeForce GTX 1650 (Desktop):
22  fps
527%
NVIDIA GeForce RTX 3080 Ti:
114 118.8 ~ 116 fps
low 1024x768
100%
GeForce GTX 1650 (Desktop):
264.1  fps
88%
GeForce GTX 1660 Ti Max-Q:
232.8  fps
med. 1366x768
100%
GeForce GTX 1650 (Desktop):
209.9  fps
95%
GeForce GTX 1660 Ti Max-Q:
200.1  fps
high 1920x1080
100%
GeForce GTX 1650 (Desktop):
146.2  fps
112%
GeForce GTX 1660 Ti Max-Q:
163.6  fps
ultra 1920x1080
100%
GeForce GTX 1650 (Desktop):
124  fps
120%
GeForce GTX 1660 Ti Max-Q:
148.8  fps
4K 3840x2160
100%
GeForce GTX 1650 (Desktop):
49.6  fps
low 1024x768
GeForce GTX 1660 Ti Max-Q:
60  fps
high 1920x1080
GeForce GTX 1660 Ti Max-Q:
60  fps
ultra 1920x1080
GeForce GTX 1660 Ti Max-Q:
60  fps
low 1280x720
100%
GeForce GTX 1650 (Desktop):
92 156.7 ~ 124 fps
222%
NVIDIA GeForce RTX 3080 Ti:
240.3 278.9 305 ~ 275 fps
87%
GeForce GTX 1660 Ti Max-Q:
93.3 113 119 ~ 108 fps
med. 1366x768
100%
GeForce GTX 1650 (Desktop):
85 114.3 ~ 100 fps
241%
NVIDIA GeForce RTX 3080 Ti:
214.8 242.4 266 ~ 241 fps
101%
GeForce GTX 1660 Ti Max-Q:
88.7 102.1 112 ~ 101 fps
high 1920x1080
100%
GeForce GTX 1650 (Desktop):
82 112.6 ~ 97 fps
241%
NVIDIA GeForce RTX 3080 Ti:
207.6 234.1 259 ~ 234 fps
97%
GeForce GTX 1660 Ti Max-Q:
81.4 93.8 106 ~ 94 fps
ultra 1920x1080
100%
GeForce GTX 1650 (Desktop):
77 106.9 ~ 92 fps
235%
NVIDIA GeForce RTX 3080 Ti:
196.1 216.6 235 ~ 216 fps
96%
GeForce GTX 1660 Ti Max-Q:
75.7 86.3 103 ~ 88 fps
4K 3840x2160
100%
GeForce GTX 1650 (Desktop):
59.1  fps
352%
NVIDIA GeForce RTX 3080 Ti:
191.5 211.1 220 ~ 208 fps
low 1280x720
GeForce GTX 1660 Ti Max-Q:
89  fps
high 1920x1080
GeForce GTX 1660 Ti Max-Q:
69  fps
ultra 1920x1080
GeForce GTX 1660 Ti Max-Q:
51  fps
low 1024x768
100%
GeForce GTX 1650 (Desktop):
208 216 ~ 212 fps
341%
NVIDIA GeForce RTX 3080 Ti:
681 702 783 ~ 722 fps
100%
GeForce GTX 1660 Ti Max-Q:
138.4 144.5 186.8 243 256.8 257.5 258.3 ~ 212 fps
med. 1366x768
100%
GeForce GTX 1650 (Desktop):
128 136 ~ 132 fps
430%
NVIDIA GeForce RTX 3080 Ti:
554 564 586 ~ 568 fps
117%
GeForce GTX 1660 Ti Max-Q:
111.4 142.6 162.6 166.4 166.5 173.3 ~ 154 fps
high 1920x1080
100%
GeForce GTX 1650 (Desktop):
70.1 77 ~ 74 fps
500%
NVIDIA GeForce RTX 3080 Ti:
365 372 374 ~ 370 fps
119%
GeForce GTX 1660 Ti Max-Q:
64.4 83.9 89.9 92.1 94.5 95.2 95.3 ~ 88 fps
ultra 1920x1080
100%
GeForce GTX 1650 (Desktop):
40.4 43 ~ 42 fps
429%
NVIDIA GeForce RTX 3080 Ti:
174 179.1 183 184.6 ~ 180 fps
119%
GeForce GTX 1660 Ti Max-Q:
44.8 48.5 48.8 51.3 52.2 53.1 53.2 ~ 50 fps
4K 3840x2160
100%
GeForce GTX 1650 (Desktop):
23.6 27.7 ~ 26 fps
585%
NVIDIA GeForce RTX 3080 Ti:
149 149 154.9 156.8 ~ 152 fps
119%
GeForce GTX 1660 Ti Max-Q:
30.9  fps
GTA V

GTA V

2015
low 1024x768
100%
GeForce GTX 1650 (Desktop):
171  fps
110%
NVIDIA GeForce RTX 3080 Ti:
187 187.6 188 ~ 188 fps
94%
GeForce GTX 1660 Ti Max-Q:
161.3  fps
med. 1366x768
100%
GeForce GTX 1650 (Desktop):
165  fps
113%
NVIDIA GeForce RTX 3080 Ti:
187 187.4 187.9 ~ 187 fps
92%
GeForce GTX 1660 Ti Max-Q:
151.5  fps
high 1920x1080
100%
GeForce GTX 1650 (Desktop):
101  fps
185%
NVIDIA GeForce RTX 3080 Ti:
187 187 187.1 ~ 187 fps
113%
GeForce GTX 1660 Ti Max-Q:
114.6  fps
ultra 1920x1080
100%
GeForce GTX 1650 (Desktop):
48.5  fps
326%
NVIDIA GeForce RTX 3080 Ti:
149 161.5 163.6 ~ 158 fps
123%
GeForce GTX 1660 Ti Max-Q:
59.6  fps
QHD 2560x1440
NVIDIA GeForce RTX 3080 Ti:
147 152.8 157 ~ 152 fps
4K 3840x2160
100%
GeForce GTX 1650 (Desktop):
29.1  fps
625%
NVIDIA GeForce RTX 3080 Ti:
180 182 182.6 ~ 182 fps
low 1024x768
100%
GeForce GTX 1650 (Desktop):
200  fps
med. 1366x768
100%
GeForce GTX 1650 (Desktop):
200  fps
high 1366x768
100%
GeForce GTX 1650 (Desktop):
193  fps
ultra 1920x1080
100%
GeForce GTX 1650 (Desktop):
84  fps
4K 3840x2160
100%
GeForce GTX 1650 (Desktop):
41.3  fps
low 1280x720
GeForce GTX 1660 Ti Max-Q:
183.4 224.2 263.2 294 331.3 ~ 259 fps
med. 1366x768
GeForce GTX 1660 Ti Max-Q:
195.6 249.5 271.9 282 ~ 250 fps
high 1366x768
GeForce GTX 1660 Ti Max-Q:
180.9 226.9 246.8 259.9 ~ 229 fps
ultra 1920x1080
GeForce GTX 1660 Ti Max-Q:
102.3 107.4 119.2 126.3 130 ~ 117 fps
low 1024x768
GeForce GTX 1660 Ti Max-Q:
343.8  fps
med. 1366x768
GeForce GTX 1660 Ti Max-Q:
322.9  fps
high 1366x768
GeForce GTX 1660 Ti Max-Q:
296.9  fps
ultra 1920x1080
GeForce GTX 1660 Ti Max-Q:
166.1  fps

Average Gaming NVIDIA GeForce GTX 1650 (Desktop) → 100%

Average Gaming 30-70 fps → 100%

Average Gaming NVIDIA GeForce RTX 3080 Ti → 459%

Average Gaming 30-70 fps → 617%

Average Gaming NVIDIA GeForce GTX 1660 Ti Max-Q → 118%

Average Gaming 30-70 fps → 134%

NVIDIA GeForce RTX 3080 Tilowmed.highultraQHD4K
The Callisto Protocol22319213613510263
Need for Speed Unbound187.7175.2156.6139.9132.477.8
Spider-Man Miles Morales203186.1174.8168.9134.682.1
Call of Duty Modern Warfare 2 202218017014114010770
Uncharted Legacy of Thieves Collection121.8118.4113.4109.792.761.3
A Plague Tale Requiem180158.5122.593.971.541.5
FIFA 23250247243242234165.1
The Quarry285219181.5149.1106.960.3
F1 224003863431308643
Vampire Bloodhunt496384362349249138.1
Ghostwire Tokyo290288279278211108.4
Tiny Tina's Wonderlands36329521317012470
Cyberpunk 2077 1.6219184.4160.4146.499.149.7
GRID Legends317289254223185.1130.3
Dying Light 218916414910961.5
Rainbow Six Extraction365353348282194104
God of War21718816812010473
Halo Infinite22919818814283.1
Farming Simulator 22349270226203201157
Battlefield 204221619416915012383
Forza Horizon 528020219113211787
Riders Republic28422018817613680
Guardians of the Galaxy194196191191186110
Far Cry 620918116114313485
New World19416515314213379.2
F1 2021597531433226175103
Days Gone17813783.3
Resident Evil Village234199114
Outriders14815183.7
Hitman 3267210.4119.6
Cyberpunk 2077 1.012584.342.3
Call of Duty Black Ops Cold War16213176.5
Assassin´s Creed Valhalla1008661
Dirt 516313692.4
Watch Dogs Legion9788.558.7
Mafia Definitive Edition16314286.6
F1 2020517430416307238145
Gears Tactics141.1147.588.3
Doom Eternal388316191
Red Dead Redemption 211292.562.7
Borderlands 322619617915112473
Control24023618612464
Total War: Three Kingdoms151.2103.451.4
Anno 180015916312469.466.155.9
The Division 214312176.6
Far Cry New Dawn196171164142136107
Metro Exodus26721317213511476
Battlefield V196192136
Shadow of the Tomb Raider29124724020916595
Strange Brigade657499405355266160
Far Cry 5237207197183174109
X-Plane 11.11218188141121
Final Fantasy XV Benchmark23422918114085
Rise of the Tomb Raider488364270232116
Dota 2 Reborn275241234216208
The Witcher 3722568370180152
GTA V188187187158152182
< 30 fps
< 60 fps
< 120 fps
≥ 120 fps


40


1
40


1
41


6
46


17
36

7
38
12
NVIDIA GeForce GTX 1650 (Desktop)lowmed.highultraQHD4K
Forza Horizon 51437362262215
Riders Republic12060464127
Guardians of the Galaxy805351503213
Back 4 Blood96.584.977.848.423.2
Far Cry 61044054456
Alan Wake Remastered90.184.474.642.6
New World10650.745.935.728.816.1
Deathloop98.451.44031.4203.13
F1 202124811896.86144.325.1
Monster Hunter Stories 214412894.354.4
Days Gone11163.155.239.728.215.5
Mass Effect Legendary Edition1161016933.9
Resident Evil Village17771.863.450.634.215.5
Outriders14269.554.642.232.427.7
Hitman 31737665593719
Cyberpunk 2077 1.06634.428.323.714.55.98
Immortals Fenyx Rising804637302413
Yakuza Like a Dragon10948.646.840.626.713.1
Call of Duty Black Ops Cold War11463.24735.623.210.6
Assassin´s Creed Valhalla76473513135
Dirt 511451.441.734.226.815.5
Watch Dogs Legion92.95647.621.214.38.02
FIFA 2123122420618414586.3
Star Wars Squadrons31214612311472.939.6
Mafia Definitive Edition103.849.745.22914.5
Serious Sam 4138.757.543.317.813.79.9
Crysis Remastered17065.235.527.619.610.8
Flight Simulator 202076.735.625.31712.35
Horizon Zero Dawn995546362615
Death Stranding98.258.754.452.735.617.3
F1 202021911588.160.342.923.4
Valorant341.7291.8260.1176.682.8
Gears Tactics2569159402715
Doom Eternal140856969.540.320.8
Hunt Showdown14656462819
Escape from Tarkov11981.174.259.638.418.7
Red Dead Redemption 210552342217.1
Star Wars Jedi Fallen Order7763543517
Need for Speed Heat1146555441917
Call of Duty Modern Warfare 20191147663533620
GRID 20191528469443218
Ghost Recon Breakpoint9252468
FIFA 2025022620616112478
Borderlands 3138.262.540.230.117.16
Control13745.433.320.78.1
F1 201920310489523920
Total War: Three Kingdoms2006740271515
Rage 212857.644.443.727.912.7
Anno 1800947948.726.318.510.7
The Division 21557155392612
Dirt Rally 2.02551058747.9
Anthem9355.548.346.932.316.6
Far Cry New Dawn1156662574121
Metro Exodus964533272012
Apex Legends14410173695027
Just Cause 41188058.254.136.317.4
Darksiders III208826355.833.110.6
Battlefield V1096152.650.639.421.4
Farming Simulator 191861501037651.926.8
Hitman 285666055.13817.5
Call of Duty Black Ops 419679756842.220.1
Assassin´s Creed Odyssey845347251813
Forza Horizon 41399083654630
FIFA 1929422920117212269
Shadow of the Tomb Raider1325850442913
Strange Brigade24594.47462.244.725.7
F1 201819511589584625
Monster Hunter World13558.454.240.834.812
The Crew 26059.959.853.235.117
Far Cry 51296862583919
X-Plane 11.1112311089.666.9
Kingdom Come: Deliverance139645238.624.211.5
Final Fantasy XV Benchmark83533828.914
Fortnite250211856141.711.3
Call of Duty WWII2271818254.444.727.5
Assassin´s Creed Origins1026357473317
Destiny 214087806643.722.5
Playerunknown's Battlegrounds (PUBG)19090866626.3
Dirt 431616511261
Ghost Recon Wildlands125.960.655.820.117.8
For Honor21681.177.659.323.4
Watch Dogs 212110251.732.418
Dishonored 2118.31127158.926
Battlefield 1193158787128.8
Deus Ex Mankind Divided130.49752.527.616.8
Overwatch2913001498746.9
Doom1661411119137.2
The Division173.4114.756.140.41.4
Far Cry Primal12080705122
Rise of the Tomb Raider2071226653.422
Rainbow Six Siege264.1209.9146.212449.6
Dota 2 Reborn124100979259.1
The Witcher 3212132744226
GTA V17116510148.529.1
Battlefield 42002001938441.3
< 30 fps
< 60 fps
< 120 fps
≥ 120 fps


34
58

27
49
18
2
44
40
8
15
48
20
4
33
34
3
4
74
9
5
NVIDIA GeForce GTX 1660 Ti Max-Qlowmed.highultraQHD4K
Flight Simulator 202055.149.437.125.3
Horizon Zero Dawn119786551
Death Stranding136.187.781.378.4
F1 202021913011279
Gears Tactics214.7130.279.956.1
Doom Eternal168.9101.795.493.4
Hunt Showdown176.881.263.3
Escape from Tarkov121.298.390.587.7
Red Dead Redemption 2115.171.747.229.4
Star Wars Jedi Fallen Order91.578.172.4
Need for Speed Heat95.88373.966.9
Call of Duty Modern Warfare 2019135.28872.662.6
GRID 2019112.986.57258.7
Ghost Recon Breakpoint99706650
FIFA 20147.9145.4141139.3
Borderlands 3102775442
Control158.363.747.1
F1 201916913011274
Total War: Three Kingdoms177855641
Rage 2151746262
Anno 180074715530
The Division 2126846850
Dirt Rally 2.01881219658
Anthem53.648.948.846.4
Far Cry New Dawn97817871
Metro Exodus103604737
Apex Legends1441209594
Darksiders III135.685.877.472.8
Battlefield V12187797337.9
Call of Duty Black Ops 4115.287.984.683.1
Assassin´s Creed Odyssey67575040
Shadow of the Tomb Raider96706457
Monster Hunter World66.959.359.550.8
Far Cry 58669666230
World of Tanks enCore376.8215.9117.3
X-Plane 11.11817162
Kingdom Come: Deliverance125.691.777.353.7
Final Fantasy XV Benchmark1056850
Fortnite13892.289.578.6
Middle-earth: Shadow of War91827261
Rocket League227186158
Ghost Recon Wildlands130.478.172.441.5
Overwatch193.7140.7116
Ashes of the Singularity42.440.7
Rise of the Tomb Raider93.772.764.5
Rainbow Six Siege232.8200.1163.6148.8
Metal Gear Solid V606060
Dota 2 Reborn1081019488
Batman: Arkham Knight896951
The Witcher 3212154885030.9
GTA V161.3151.5114.659.6
BioShock Infinite259250229117
Tomb Raider343.8322.9296.9166.1
< 30 fps
< 60 fps
< 120 fps
≥ 120 fps

2
21
28

5
31
13

12
34
6
2
19
23
3


3

Eine Liste mit weiteren Spielen und allen Grafikkarten finden Sie auf unserer Seite: Welches Spiel ist mit welcher Grafikkarte spielbar?

v1.28
log 19. 23:32:06

#0 ran 0s before starting gpusingle class +0s ... 0s

#1 checking url part for id 9850 +0s ... 0s

#2 checking url part for id 10702 +0s ... 0s

#3 checking url part for id 9832 +0s ... 0s

#4 redirected to Ajax server, took 1726781526s time from redirect:0 +0s ... 0s

#5 did not recreate cache, as it is less than 5 days old! Created at Thu, 19 Sep 2024 05:16:33 +0200 +0s ... 0s

#6 composed specs +0.029s ... 0.029s

#7 did output specs +0s ... 0.029s

#8 start showIntegratedCPUs +0s ... 0.029s

#9 getting avg benchmarks for device 9850 +0.037s ... 0.066s

#10 got single benchmarks 9850 +0.007s ... 0.074s

#11 getting avg benchmarks for device 10702 +0.004s ... 0.078s

#12 got single benchmarks 10702 +0.009s ... 0.087s

#13 getting avg benchmarks for device 9832 +0.004s ... 0.091s

#14 got single benchmarks 9832 +0.013s ... 0.103s

#15 got avg benchmarks for devices +0s ... 0.103s

#16 min, max, avg, median took s +0.083s ... 0.187s

#17 before gaming benchmark output +0s ... 0.187s

#18 Got 1462 rows for game benchmarks. +0.065s ... 0.252s

#19 composed SQL query for gamebenchmarks +0s ... 0.252s

#20 got data and put it in $dataArray +0.009s ... 0.261s

#21 benchmarks composed for output. +0.044s ... 0.304s

#22 calculated avg scores. +0s ... 0.304s

#23 return log +0.003s ... 0.307s

Teilen Sie diesen Artikel, um uns zu unterstützen. Jeder Link hilft!
> Notebook Test, Laptop Test und News > Benchmarks / Technik > Benchmarks / Technik > Grafikkarten Vergleich - Head 2 Head
Autor: Klaus Hinum,  8.09.2017 (Update:  1.07.2023)