Notebookcheck Logo

NVIDIA GeForce GTX 1070 Ti (Desktop) vs NVIDIA Quadro FX 3800M vs NVIDIA GeForce GTX 1050 Max-Q

NVIDIA GeForce GTX 1070 Ti (Desktop)

► remove from comparison NVIDIA GeForce GTX 1070 Ti (Desktop)

Die Nvidia GeForce GTX 1070 Ti ist eine schnelle Desktop Grafikkarte der Pascal Generation. Sie positioniert sich zwischen GTX 1070 und GTX 1080 und wurde als Konter zur Radeon Vega 56 positioniert. Die Vorstellung war im November 2017. Im Vergleich zur GTX 1070 bietet die GTX 1070 Ti mehr Shader (2.432 versus 1.920) bei gleichem Boost Takt. Der 8 GB große Grafikspeicher ist wie bei der GTX 1070 vom Typ GDDR5 und nicht GDDR5X wie bei der GTX 1080. 

Features

Der GP104-Chip wird in einem 16nm-FinFET-Prozess bei TSMC gefertigt und bietet eine Reihe neuer Features, unter anderem Support für DisplayPort 1.4 (ready), HDMI 2.0b, HDR, Simultaneous Multi-Projection (SMP) sowie verbessertes H.265 Video De- und Encoding (PlayReady 3.0). Eine genaue Auflistung der Verbesserungen und Features der neuen Pascal Desktop-GPUs finden Sie in unserem Pascal-Architektur-Artikel.

Performance

Die GeForce GTX 1070 Ti positioniert sich wenig überraschend zwischen GTX 1070 und GTX 1080. Damit eignet sich die Grafikkarte am besten für 2560x1440 mit maximalen Details für aktuelle Spiele. Anspruchslosere Spiele können auch in 4K flüssig gespielt werden.

Leistungsaufnahme

Die Leistungsaufnahme der GeForce GTX 1070 Ti wird vom Hersteller mit 180 Watt beziffert und liegt damit in einer ähnlichen Größenordnung wie die GTX 1080. In unseren Tests positioniert sich die Karte leicht darunter aber auch deutlich über der GTX 1070 (150 Watt TDP).

NVIDIA Quadro FX 3800M

► remove from comparison NVIDIA Quadro FX 3800M

Die Nvidia Quadro FX 3800M ist eine mobile Grafikkarte für Workstation-Laptops. Sie basiert auf die selbe Architektur wie die GeForce GTX 280M und bietet die vollen 128 Shaderprozessoren des G92 Chips. Im Vergleich zum FX 3700M ist die FX 3800M höher getaktet und wird bereits in 55nm gefertigt.

Im Vergleich zu einer GTX 280M, sind die Taktraten nochmals deutlich höher. Daher weist die FX3800M auch einen höheren Stromverbrauch auf und eine bessere Performance. Die Spieleperformance ist jedoch, durch die auf professionelle 3D Anwendung spezialisierten Treiber, etwas geringer.

Die zertifizierten Treiber der Quadro FX Serie sorgen für eine optimierten Stabilität, Kompatibilität und Performance bei Professionellen Anwendungen (CAD-, DCC-, Medizin- und Prospektionsanwendungen). Besonders die OpenGL Performance soll bei den Quadro FX Karten im Vergleich zu GeForce Modellen deutlich besser sein.

Im Viewperf 10.0 Test kann sich die FX 3800M deutlich von der alten FX 3700M abheben (wahrscheinlich auch durch die schnelleren Prozessoren in den neuen Notebooks). 

Zur Zeitpunkt der Veröffentlichung ist sie die schnellste professionelle Grafikkarte für Notebooks und eignet sich daher auch für die Bearbeitung von komplexen 3D Modellen.

NVIDIA GeForce GTX 1050 Max-Q

► remove from comparison NVIDIA GeForce GTX 1050 Max-Q

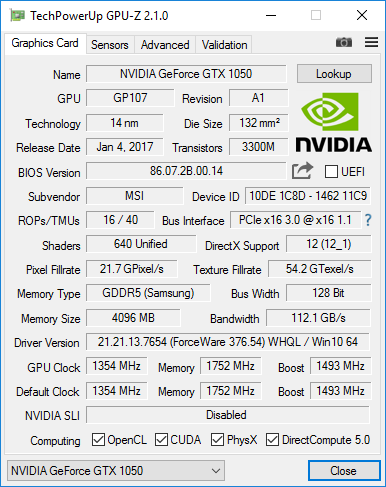
Die Nvidia GeForce GTX 1050 mit Max-Q Design ist eine Mittelklasse-GPU basierend auf der Pascal-Architektur und wurde im Januar 2018 vorgestellt. Je nach Kühlungsdesign ist sie 10-15% langsamer als eine GTX 1050. Wie die GTX 1050, basiert die Max-Q Variante auf den GP107 Chp, der in 14 nm bei Samsung produziert wird.

Im Vergleich zur normalen GTX 1050 gibt es noch weitere Unterschiede als den Takt. Der Treiber wurde auf Effizienz (und nicht Leistung) optimiert (nur für die Max-Q Modelle), optimierte Spannungswandler für 1V Betreib, high-end Kühlungsmethoden und eine 40 dB Grenze für die Lüfterlautstärke (mit Taktanpasssungen um dies jederzeit zu gewährleisten) zeichnen die Max-Q Variante aus.

Features

Der GP107-Chip wird in einem 14-nm-FinFET-Prozess bei Samsung gefertigt und bietet eine Reihe neuer Features, unter anderem Support für DisplayPort 1.4 (ready), HDMI 2.0b, HDR, Simultaneous Multi-Projection (SMP) sowie verbessertes H.265 Video De- und Encoding (PlayReady 3.0). Eine genaue Auflistung der Verbesserungen und Features der neuen Pascal Desktop-GPUs finden Sie in unserem Pascal-Architektur-Artikel.

Performance

Die exakte Performance der GeForce GTX 1050 Max-Q kann sich in Abhängigkeit von der Kühlung des jeweiligen Notebooks stark unterscheiden. Nvidia gibt an das die durchschnittliche GTX 1050 mit Max-Q Design etwa 10 bis 15 Prozent langsamer ist als eine GTX 1050. Dadurch eignet sich die Grafikkarte am besten für Full HD und hoher (aber nicht maximaler) Detailstufe.

Leistungsaufnahme

Die Leistungsaufnahme der GeForce GTX 1050 Max-Q ist von Nvidia mit 34 bis 40 Watt angegeben (je nach Taktung) und damit deutlich geringer als die 53 Watt der normalen GeForce GTX 1050. Dadurch eignet sich die Grafikkarte auch für dünne und leichte Notebooks.

NVIDIA GeForce GTX 1070 Ti (Desktop)NVIDIA Quadro FX 3800MNVIDIA GeForce GTX 1050 Max-Q
GeForce GTX 1000 Serie
GeForce GTX 1080 Ti 3584 @ 1.48 - 1.6 GHz352 Bit @ 11000 MHz
GeForce GTX 1080 SLI (Laptop) 5120 @ 1.56 - 1.73 GHz256 Bit @ 10000 MHz
GeForce GTX 1070 SLI (Desktop) 3840 @ 1.51 - 1.68 GHz256 Bit @ 8000 MHz
GeForce GTX 1070 SLI (Laptop) 4096 @ 1.44 - 1.65 GHz256 Bit @ 8000 MHz
GeForce GTX 1080 (Desktop) 2560 @ 1.61 - 1.73 GHz256 Bit @ 10000 MHz
GeForce GTX 1080 Mobile 2560 @ 1.57 - 1.73 GHz256 Bit @ 10000 MHz
GeForce GTX 1070 Ti (Desktop) 2432 @ 1.61 - 1.68 GHz256 Bit @ 8000 MHz
GeForce GTX 1070 (Desktop) 1920 @ 1.51 - 1.68 GHz256 Bit @ 8000 MHz
GeForce GTX 1080 Max-Q 2560 @ 1.1 - 1.28 GHz256 Bit @ 10000 MHz
GeForce GTX 1070 Mobile 2048 @ 1.44 - 1.65 GHz256 Bit @ 8000 MHz
GeForce GTX 1070 Max-Q 2048 @ 1.1 - 1.27 GHz256 Bit @ 8000 MHz
GeForce GTX 1060 (Desktop) 1280 @ 1.51 - 1.71 GHz192 Bit @ 8000 MHz
GeForce GTX 1060 Mobile 1280 @ 1.4 - 1.67 GHz192 Bit @ 8000 MHz
GeForce GTX 1060 Max-Q 1280 @ 1.06 - 1.34 GHz192 Bit @ 8000 MHz
GeForce GTX 1050 Ti Mobile 768 @ 1.49 - 1.62 GHz128 Bit @ 7000 MHz
GeForce GTX 1050 Ti (Desktop) 768 @ 1.29 - 1.39 GHz128 Bit @ 7008 MHz
GeForce GTX 1050 Ti Max-Q 768 @ 1.15 - 1.29 GHz128 Bit @ 7000 MHz
GeForce GTX 1050 (Desktop) 640 @ 1.35 - 1.46 GHz128 Bit @ 7008 MHz
GeForce GTX 1050 Mobile 640 @ 1.35 - 1.49 GHz128 Bit @ 7000 MHz
GeForce GTX 1050 Max-Q 640 @ 1 - 1.14 GHz128 Bit @ 7000 MHz
GeForce GT 1030 (Desktop) 384 @ 1.23 - 1.67 GHz64 Bit @ 6000 MHz
Quadro FX 3800M 128 @ 0.68 GHz256 Bit @ 1000 MHz
Quadro FX 3700M 128 @ 0.55 GHz256 Bit @ 800 MHz
Quadro FX 2800M 96 @ 0.6 GHz256 Bit @ 1000 MHz
Quadro FX 3600M 96 @ 0.5 GHz256 Bit @ 800 MHz
Quadro FX 1800M 72 @ 0.56 GHz128 Bit @ 1100 MHz
Quadro FX 2700M 48 @ 0.53 GHz256 Bit @ 800 MHz
Quadro FX 880M 48 @ 0.55 GHz128 Bit @ 790 MHz
Quadro FX 3500M 24/8 cores @ 0.58 GHz256 Bit @ 700 MHz
Quadro FX 2500M 24/8 cores @ 0.5 GHz256 Bit @ 600 MHz
Quadro FX 1700M 32 @ 0.63 GHz128 Bit @ 800 MHz
Quadro FX 1600M 32 @ 0.63 GHz128 Bit @ 800 MHz
Quadro FX 1500M 20/7 cores @ 0.38 GHz256 Bit @ 500 MHz
Quadro FX 770M 32 @ 0.5 GHz128 Bit @ 800 MHz
Quadro FX 570M 32 @ 0.48 GHz128 Bit @ 700 MHz
Quadro FX 380M 16 @ 0.63 GHz64 Bit @ 800 MHz
Quadro FX 370M 8 @ 0.58 GHz64 Bit @ 700 MHz
Quadro FX 360M 16 @ 0.4 GHz64 Bit @ 600 MHz
Quadro FX 350M 4/3 cores @ 0.45 GHz64 Bit @ 350 MHz
GeForce GTX 1080 Ti 3584 @ 1.48 - 1.6 GHz352 Bit @ 11000 MHz
GeForce GTX 1080 SLI (Laptop) 5120 @ 1.56 - 1.73 GHz256 Bit @ 10000 MHz
GeForce GTX 1070 SLI (Desktop) 3840 @ 1.51 - 1.68 GHz256 Bit @ 8000 MHz
GeForce GTX 1070 SLI (Laptop) 4096 @ 1.44 - 1.65 GHz256 Bit @ 8000 MHz
GeForce GTX 1080 (Desktop) 2560 @ 1.61 - 1.73 GHz256 Bit @ 10000 MHz
GeForce GTX 1080 Mobile 2560 @ 1.57 - 1.73 GHz256 Bit @ 10000 MHz
GeForce GTX 1070 Ti (Desktop) 2432 @ 1.61 - 1.68 GHz256 Bit @ 8000 MHz
GeForce GTX 1070 (Desktop) 1920 @ 1.51 - 1.68 GHz256 Bit @ 8000 MHz
GeForce GTX 1080 Max-Q 2560 @ 1.1 - 1.28 GHz256 Bit @ 10000 MHz
GeForce GTX 1070 Mobile 2048 @ 1.44 - 1.65 GHz256 Bit @ 8000 MHz
GeForce GTX 1070 Max-Q 2048 @ 1.1 - 1.27 GHz256 Bit @ 8000 MHz
GeForce GTX 1060 (Desktop) 1280 @ 1.51 - 1.71 GHz192 Bit @ 8000 MHz
GeForce GTX 1060 Mobile 1280 @ 1.4 - 1.67 GHz192 Bit @ 8000 MHz
GeForce GTX 1060 Max-Q 1280 @ 1.06 - 1.34 GHz192 Bit @ 8000 MHz
GeForce GTX 1050 Ti Mobile 768 @ 1.49 - 1.62 GHz128 Bit @ 7000 MHz
GeForce GTX 1050 Ti (Desktop) 768 @ 1.29 - 1.39 GHz128 Bit @ 7008 MHz
GeForce GTX 1050 Ti Max-Q 768 @ 1.15 - 1.29 GHz128 Bit @ 7000 MHz
GeForce GTX 1050 (Desktop) 640 @ 1.35 - 1.46 GHz128 Bit @ 7008 MHz
GeForce GTX 1050 Mobile 640 @ 1.35 - 1.49 GHz128 Bit @ 7000 MHz
GeForce GTX 1050 Max-Q 640 @ 1 - 1.14 GHz128 Bit @ 7000 MHz
GeForce GT 1030 (Desktop) 384 @ 1.23 - 1.67 GHz64 Bit @ 6000 MHz
CodenamePascal GP104N10E-GLM4N17P-G0 Max-Q
ArchitekturPascalG9xPascal
Pipelines2432 - unified128 - unified640 - unified
Kerntakt1607 - 1683 (Boost) MHz675 MHz999 - 1189 - 1139 - 1328 (Boost) MHz
Speichertakt8000 MHz1000 MHz7000 MHz
Speicherbandbreite256 Bit256 Bit128 Bit
SpeichertypGDDR5GDDR3GDDR5
Max. Speichergröße8 GB1024 MB4 GB
Shared Memoryneinneinnein
APIDirectX 12_1, OpenGL 4.5DirectX 10, Shader 4.0DirectX 12_1, OpenGL 4.5
Stromverbrauch180 Watt100 Watt34 - 40 Watt
Transistors7.2 Billion754 Million
Herstellungsprozess16 nm55 nm14 nm
FeaturesMulti-Projection, VR Ready, G-SYNC, Vulkan, Multi MonitorOpenGL 2.1, CUDA, PowerMizer 8.0
Erscheinungsdatum02.11.2017 20.12.2009 03.01.2018
Herstellerseitewww.nvidia.atwww.nvidia.comwww.nvidia.com
Shadertakt1688 MHz
Notebookgrößegroß (17" z.B.)groß (17" z.B.)

Benchmarks

Performance Rating - 3DMark 11 + Fire Strike + Time Spy - GeForce GTX 1050 Max-Q
2.5 pt (8%)
3DMark - 3DMark Time Spy Score
6177 Points (18%)
min: 1709     avg: 1754     median: 1753.5 (5%)     max: 1798 Points
3DMark - 3DMark Time Spy Graphics
6531 Points (17%)
min: 1596     avg: 1615     median: 1615 (4%)     max: 1634 Points
3DMark - 3DMark Ice Storm Unlimited Graphics
442105 Points (45%)
318811 Points (32%)
3DMark - 3DMark Ice Storm Extreme Graphics
22530 Points (3%)
3DMark - 3DMark Cloud Gate Score
29364 Points (31%)
min: 14739     avg: 17501     median: 18259.5 (20%)     max: 18746 Points
3DMark - 3DMark Cloud Gate Graphics
88161 Points (23%)
min: 27059     avg: 33618     median: 35392 (9%)     max: 36630 Points
3DMark - 3DMark Fire Strike Standard Score
15061 Points (27%)
min: 5114     avg: 5213     median: 5223 (9%)     max: 5292 Points
3DMark - 3DMark Fire Strike Standard Graphics
18405 Points (21%)
min: 5616     avg: 5677     median: 5649.5 (6%)     max: 5792 Points
3DMark - 3DMark Ice Storm Graphics
min: 36552     avg: 43792     median: 43792 (5%)     max: 51032 Points
3DMark 11 - 3DM11 Performance Score
20106 Points (28%)
min: 7116     avg: 7354     median: 7347.5 (10%)     max: 7603 Points
3DMark 11 - 3DM11 Performance GPU
27503 Points (24%)
min: 6874     avg: 7142     median: 7153.5 (6%)     max: 7385 Points
3DMark Vantage
3DM Vant. Perf. total + NVIDIA Quadro FX 3800M
3DMark Vantage - 3DM Vant. Perf. total
min: 6584     avg: 6951     median: 6779 (2%)     max: 7491 Points
3DM Vant. Perf. total + NVIDIA GeForce GTX 1050 Max-Q
min: 26044     avg: 26081     median: 26080.5 (8%)     max: 26117 Points
3DM Vant. Perf. GPU no PhysX + NVIDIA Quadro FX 3800M
3DMark Vantage - 3DM Vant. Perf. GPU no PhysX
min: 5758     avg: 5926     median: 6002 (3%)     max: 6019 Points
3DM Vant. Perf. GPU no PhysX + NVIDIA GeForce GTX 1050 Max-Q
min: 25008     avg: 25293     median: 25292.5 (14%)     max: 25577 Points
3DMark 2001SE - 3DMark 2001 - Standard
min: 32886     avg: 34790     median: 34790 (36%)     max: 36694 Points
3DMark 03 - 3DMark 03 - Standard
min: 33146     avg: 37082     median: 38191 (20%)     max: 39909 Points
3DMark 05 - 3DMark 05 - Standard
min: 16593     avg: 18199     median: 18043 (20%)     max: 19960 Points
3DMark 06 3DMark 06 - Standard 1280x1024 + NVIDIA GeForce GTX 1070 Ti (Desktop)
3DMark 06
36475 Points (48%)
3DMark 06 - Standard 1280x1024 + NVIDIA Quadro FX 3800M
min: 12050     avg: 12765     median: 12923 (17%)     max: 13323 Points
3DMark 06 - Standard 1280x1024 + NVIDIA GeForce GTX 1050 Max-Q
min: 9694     avg: 19691     median: 19690.5 (26%)     max: 29687 Points
3DMark 06 - Score Unknown Settings + NVIDIA Quadro FX 3800M
3DMark 06
13232 Points (17%)
Unigine Valley 1.0 - Unigine Valley 1.0 DX
30.8 fps (10%)
Unigine Heaven 3.0 - Unigine Heaven 3.0 DX 11
70.2 fps (23%)
Unigine Heaven 3.0 - Unigine Heaven 3.0 OpenGL
65 fps (29%)
Unigine Heaven 2.1 - Heaven 2.1 high
min: 100.9     avg: 101.2     median: 101.2 (19%)     max: 101.4 fps
SPEC Viewperf 10.0 - SPEC Viewperf 10.0 - 3dsmax
32.8 Points (68%)
SPEC Viewperf 10.0 - SPEC Viewperf 10.0 - Catia
45.8 Points (96%)
SPEC Viewperf 10.0 - SPEC Viewperf 10.0 - EnSight
47.4 Points (100%)
SPEC Viewperf 10.0 - SPEC Viewperf 10.0 - Maya
59.7 Points (32%)
SPEC Viewperf 10.0 - SPEC Viewperf 10.0 - Pro/Engeneer
51.1 Points (100%)
SPEC Viewperf 10.0 - SPEC Viewperf 10.0 - SolidWorks
59.7 Points (88%)
SPEC Viewperf 10.0 - SPEC Viewperf 10.0 - UGS Teamcenter
38.5 Points (100%)
SPEC Viewperf 10.0 - SPEC Viewperf 10.0 - UGS NX
35.3 Points (72%)
SPECviewperf 11
specvp11 snx-01 + NVIDIA Quadro FX 3800M
SPECviewperf 11 - specvp11 snx-01
18.8 fps (11%)
specvp11 tcvis-02 + NVIDIA Quadro FX 3800M
SPECviewperf 11 - specvp11 tcvis-02
18.7 fps (11%)
specvp11 sw-02 + NVIDIA Quadro FX 3800M
SPECviewperf 11 - specvp11 sw-02
30.6 fps (23%)
specvp11 proe-05 + NVIDIA Quadro FX 3800M
SPECviewperf 11 - specvp11 proe-05
6.9 fps (8%)
specvp11 maya-03 + NVIDIA Quadro FX 3800M
SPECviewperf 11 - specvp11 maya-03
16.6 fps (12%)
specvp11 lightwave-01 + NVIDIA Quadro FX 3800M
SPECviewperf 11 - specvp11 lightwave-01
38.4 fps (41%)
specvp11 ensight-04 + NVIDIA Quadro FX 3800M
SPECviewperf 11 - specvp11 ensight-04
16.2 fps (8%)
specvp11 catia-03 + NVIDIA Quadro FX 3800M
SPECviewperf 11 - specvp11 catia-03
23.4 fps (12%)
Windows 7 Experience Index - Win7 Gaming graphics
6.9 Points (87%)
Windows 7 Experience Index - Win7 Graphics
6.9 Points (87%)
Cinebench R10 Cinebench R10 Shading (32bit) + NVIDIA Quadro FX 3800M
Cinebench R10 - Cinebench R10 Shading (32bit)
min: 4429     avg: 4928     median: 4928 (4%)     max: 5427 Points
Cinebench R10 Shading (32bit) + NVIDIA GeForce GTX 1050 Max-Q
min: 1803     avg: 5147     median: 6811 (5%)     max: 6828 Points
Cinebench R11.5 Cinebench R11.5 OpenGL 64 Bit + NVIDIA Quadro FX 3800M
Cinebench R11.5 - Cinebench R11.5 OpenGL 64 Bit
min: 32.07     avg: 32.7     median: 32.7 (11%)     max: 33.29 fps
Cinebench R11.5 OpenGL 64 Bit + NVIDIA GeForce GTX 1050 Max-Q
min: 20.54     avg: 47.4     median: 47.4 (16%)     max: 74.3 fps
Cinebench R15
Cinebench R15 OpenGL 64 Bit + NVIDIA GeForce GTX 1050 Max-Q
Cinebench R15 - Cinebench R15 OpenGL 64 Bit
min: 64.5     avg: 100.9     median: 109.5 (6%)     max: 119.9 fps
Cinebench R15 OpenGL Ref. Match 64 Bit + NVIDIA GeForce GTX 1050 Max-Q
Cinebench R15 - Cinebench R15 OpenGL Ref. Match 64 Bit
99.6 % (100%)
GFXBench - GFXBench 5.0 Aztec Ruins High Tier Offscreen
48.1 fps (9%)
GFXBench - GFXBench 5.0 Aztec Ruins Normal Tier Offscreen
128.3 fps (10%)
GFXBench - GFXBench Car Chase Offscreen
108.1 fps (12%)
GFXBench 3.1 - GFXBench Manhattan ES 3.1 Offscreen
165.2 fps (3%)
GFXBench 3.0 - GFXBench 3.0 Manhattan Offscreen
223 fps (13%)
GFXBench (DX / GLBenchmark) 2.7
GFXBench T-Rex HD Offscreen C24Z16 + NVIDIA GeForce GTX 1050 Max-Q
GFXBench (DX / GLBenchmark) 2.7 - GFXBench T-Rex HD Offscreen C24Z16
441.6 fps (4%)
LuxMark v2.0 64Bit - LuxMark v2.0 Room GPU
2542 Samples/s (11%)
min: 967     avg: 968     median: 967.5 (4%)     max: 968 Samples/s
LuxMark v2.0 64Bit - LuxMark v2.0 Sala GPU
5159 Samples/s (9%)
min: 1692     avg: 1702     median: 1702 (3%)     max: 1712 Samples/s
ComputeMark v2.1 - ComputeMark v2.1 Result
15488 Points (17%)
min: 4236     avg: 4343     median: 4342.5 (5%)     max: 4449 Points
Power Consumption - Furmark Stress Test Power Consumption - external Monitor *
291 Watt (41%)
Power Consumption - The Witcher 3 Power Consumption - external Monitor *
290 Watt (41%)
Power Consumption - Witcher 3 Power Consumption *
68 Watt (15%)
Power Consumption - Witcher 3 ultra Power Efficiency
0.3 fps per Watt (28%)
Power Consumption - Witcher 3 ultra Power Efficiency - external Monitor
0.2 fps per Watt (21%)
Emissions Witcher 3 Fan Noise + NVIDIA GeForce GTX 1050 Max-Q
Emissions - Witcher 3 Fan Noise
37.4 dB(A) (60%)
Clock Speed - GPU Clock Witcher 3 ultra
1810 MHz (71%)
Clock Speed - GPU Clock Speed Furmark
1677 MHz (66%)

Average Benchmarks NVIDIA GeForce GTX 1070 Ti (Desktop) → 100% n=1

Average Benchmarks NVIDIA Quadro FX 3800M → 35% n=1

Average Benchmarks NVIDIA GeForce GTX 1050 Max-Q → 54% n=1

- Bereich der Benchmarkergebnisse für diese Grafikkarte
- Durchschnittliche Benchmarkergebnisse für diese Grafikkarte
* Smaller numbers mean a higher performance
1 This benchmark is not used for the average calculation

Spiele-Benchmarks

Die folgenden Benchmarks basieren auf unseren Spieletests mit Testnotebooks. Die Performance dieser Grafikkarte bei den gelisteten Spielen ist abhängig von der verwendeten CPU, Speicherausstattung, Treiber und auch Betriebssystem. Dadurch müssen die untenstehenden Werte nicht repräsentativ sein. Detaillierte Informationen über das verwendete System sehen Sie nach einem Klick auf den fps-Wert.

low 1280x720
GeForce GTX 1050 Max-Q:
83.1  fps
med. 1920x1080
GeForce GTX 1050 Max-Q:
32.5  fps
high 1920x1080
GeForce GTX 1050 Max-Q:
26.4  fps
QHD 2560x1440
GeForce GTX 1050 Max-Q:
15.4  fps
4K 3840x2160
GeForce GTX 1050 Max-Q:
7.5  fps
low 1280x720
GeForce GTX 1050 Max-Q:
35.1  fps
med. 1920x1080
GeForce GTX 1050 Max-Q:
25.3  fps
high 1920x1080
GeForce GTX 1050 Max-Q:
16.1  fps
ultra 1920x1080
GeForce GTX 1050 Max-Q:
9.8  fps
med. 1920x1080
GeForce GTX 1050 Max-Q:
43.6  fps
high 1920x1080
GeForce GTX 1050 Max-Q:
35.8  fps
ultra 1920x1080
GeForce GTX 1050 Max-Q:
31.1  fps
QHD 2560x1440
GeForce GTX 1050 Max-Q:
19.9  fps
4K 3840x2160
GeForce GTX 1050 Max-Q:
9.9  fps
low 1280x720
GeForce GTX 1050 Max-Q:
61.3  fps
med. 1920x1080
GeForce GTX 1050 Max-Q:
34.4  fps
high 1920x1080
GeForce GTX 1050 Max-Q:
29.8  fps
ultra 1920x1080
GeForce GTX 1050 Max-Q:
27.7  fps
QHD 2560x1440
GeForce GTX 1050 Max-Q:
19.5  fps
4K 3840x2160
GeForce GTX 1050 Max-Q:
10  fps
low 1280x720
GeForce GTX 1050 Max-Q:
56.4  fps
med. 1920x1080
GeForce GTX 1050 Max-Q:
36.1  fps
high 1920x1080
GeForce GTX 1050 Max-Q:
28.7  fps
ultra 1920x1080
GeForce GTX 1050 Max-Q:
25.7  fps
QHD 2560x1440
GeForce GTX 1050 Max-Q:
17.3  fps
4K 3840x2160
GeForce GTX 1050 Max-Q:
9.1  fps
GRID 2019

GRID 2019

2019
low 1280x720
GeForce GTX 1050 Max-Q:
89.1  fps
med. 1920x1080
GeForce GTX 1050 Max-Q:
41.2  fps
high 1920x1080
GeForce GTX 1050 Max-Q:
29.2  fps
ultra 1920x1080
GeForce GTX 1050 Max-Q:
21.3  fps
QHD 2560x1440
GeForce GTX 1050 Max-Q:
11.7  fps
4K 3840x2160
GeForce GTX 1050 Max-Q:
7.3  fps
low 1280x720
GeForce GTX 1050 Max-Q:
56  fps
med. 1920x1080
GeForce GTX 1050 Max-Q:
31  fps
high 1920x1080
GeForce GTX 1050 Max-Q:
29  fps
ultra 1920x1080
GeForce GTX 1050 Max-Q:
19  fps
QHD 2560x1440
GeForce GTX 1050 Max-Q:
11  fps
4K 3840x2160
GeForce GTX 1050 Max-Q:
6  fps
FIFA 20

FIFA 20

2019
low 1280x720
GeForce GTX 1050 Max-Q:
200.7  fps
med. 1920x1080
GeForce GTX 1050 Max-Q:
105.2  fps
high 1920x1080
GeForce GTX 1050 Max-Q:
100.7  fps
ultra 1920x1080
GeForce GTX 1050 Max-Q:
86.4  fps
QHD 2560x1440
GeForce GTX 1050 Max-Q:
69.4  fps
4K 3840x2160
GeForce GTX 1050 Max-Q:
47.1  fps
low 1280x720
GeForce GTX 1050 Max-Q:
81.3  fps
med. 1920x1080
GeForce GTX 1050 Max-Q:
35.3  fps
high 1920x1080
GeForce GTX 1050 Max-Q:
22.5  fps
ultra 1920x1080
GeForce GTX 1050 Max-Q:
16.5  fps
QHD 2560x1440
GeForce GTX 1050 Max-Q:
11.6  fps
4K 3840x2160
GeForce GTX 1050 Max-Q:
4.9  fps
Control

Control

2019
low 1280x720
100%
GeForce GTX 1070 Ti (Desktop):
200  fps
34%
GeForce GTX 1050 Max-Q:
67.8  fps
med. 1920x1080
100%
GeForce GTX 1070 Ti (Desktop):
78  fps
29%
GeForce GTX 1050 Max-Q:
23  fps
high 1920x1080
100%
GeForce GTX 1070 Ti (Desktop):
58.5  fps
29%
GeForce GTX 1050 Max-Q:
16.8  fps
QHD 2560x1440
100%
GeForce GTX 1070 Ti (Desktop):
37.1  fps
28%
GeForce GTX 1050 Max-Q:
10.5  fps
4K 3840x2160
100%
GeForce GTX 1070 Ti (Desktop):
17.9  fps
28%
GeForce GTX 1050 Max-Q:
5.1  fps
F1 2019

F1 2019

2019
low 1280x720
100%
GeForce GTX 1070 Ti (Desktop):
244  fps
55%
GeForce GTX 1050 Max-Q:
134  fps
med. 1920x1080
100%
GeForce GTX 1070 Ti (Desktop):
183  fps
32%
GeForce GTX 1050 Max-Q:
58  fps
high 1920x1080
100%
GeForce GTX 1070 Ti (Desktop):
164  fps
30%
GeForce GTX 1050 Max-Q:
49  fps
ultra 1920x1080
100%
GeForce GTX 1070 Ti (Desktop):
120  fps
36%
GeForce GTX 1050 Max-Q:
43  fps
QHD 2560x1440
100%
GeForce GTX 1070 Ti (Desktop):
94  fps
29%
GeForce GTX 1050 Max-Q:
27  fps
4K 3840x2160
100%
GeForce GTX 1070 Ti (Desktop):
57  fps
26%
GeForce GTX 1050 Max-Q:
15  fps
low 1280x720
100%
GeForce GTX 1070 Ti (Desktop):
271  fps
med. 1920x1080
100%
GeForce GTX 1070 Ti (Desktop):
249  fps
high 1920x1080
100%
GeForce GTX 1070 Ti (Desktop):
241  fps
ultra 1920x1080
100%
GeForce GTX 1070 Ti (Desktop):
219  fps
QHD 2560x1440
100%
GeForce GTX 1070 Ti (Desktop):
222  fps
4K 3840x2160
100%
GeForce GTX 1070 Ti (Desktop):
221  fps
low 1280x720
GeForce GTX 1050 Max-Q:
119.3  fps
med. 1920x1080
GeForce GTX 1050 Max-Q:
38.5  fps
high 1920x1080
100%
GeForce GTX 1070 Ti (Desktop):
86.6  fps
27%
GeForce GTX 1050 Max-Q:
23.2  fps
ultra 1920x1080
100%
GeForce GTX 1070 Ti (Desktop):
63.4  fps
27%
GeForce GTX 1050 Max-Q:
16.9  fps
QHD 2560x1440
100%
GeForce GTX 1070 Ti (Desktop):
41.2  fps
16%
GeForce GTX 1050 Max-Q:
6.5  fps
4K 3840x2160
100%
GeForce GTX 1070 Ti (Desktop):
20.3  fps
16%
GeForce GTX 1050 Max-Q:
3.3  fps
Rage 2

Rage 2

2019
low 1280x720
GeForce GTX 1050 Max-Q:
69.5  fps
med. 1920x1080
GeForce GTX 1050 Max-Q:
31.1  fps
high 1920x1080
GeForce GTX 1050 Max-Q:
26.6  fps
ultra 1920x1080
GeForce GTX 1050 Max-Q:
26  fps
QHD 2560x1440
GeForce GTX 1050 Max-Q:
16.3  fps
4K 3840x2160
GeForce GTX 1050 Max-Q:
4.9  fps
Anno 1800

Anno 1800

2019
low 1280x720
GeForce GTX 1050 Max-Q:
73.2  fps
med. 1920x1080
GeForce GTX 1050 Max-Q:
45.8  fps
high 1920x1080
GeForce GTX 1050 Max-Q:
26.5  fps
ultra 1920x1080
100%
GeForce GTX 1070 Ti (Desktop):
46  fps
31%
GeForce GTX 1050 Max-Q:
14.1  fps
QHD 2560x1440
100%
GeForce GTX 1070 Ti (Desktop):
40.4  fps
25%
GeForce GTX 1050 Max-Q:
10.1  fps
4K 3840x2160
100%
GeForce GTX 1070 Ti (Desktop):
24.1  fps
25%
GeForce GTX 1050 Max-Q:
6.1  fps
low 1280x720
GeForce GTX 1050 Max-Q:
73  fps
med. 1920x1080
GeForce GTX 1050 Max-Q:
34  fps
high 1920x1080
GeForce GTX 1050 Max-Q:
27  fps
ultra 1920x1080
GeForce GTX 1050 Max-Q:
19  fps
QHD 2560x1440
GeForce GTX 1050 Max-Q:
12  fps
4K 3840x2160
GeForce GTX 1050 Max-Q:
6  fps
low 1280x720
GeForce GTX 1050 Max-Q:
142.1  fps
med. 1920x1080
GeForce GTX 1050 Max-Q:
45.7  fps
high 1920x1080
GeForce GTX 1050 Max-Q:
38.8  fps
ultra 1920x1080
GeForce GTX 1050 Max-Q:
21.8  fps
QHD 2560x1440
GeForce GTX 1050 Max-Q:
16.1  fps
4K 3840x2160
GeForce GTX 1050 Max-Q:
8.8  fps
Anthem

Anthem

2019
low 1280x720
GeForce GTX 1050 Max-Q:
58.2  fps
med. 1920x1080
GeForce GTX 1050 Max-Q:
29.9  fps
high 1920x1080
GeForce GTX 1050 Max-Q:
28.6  fps
ultra 1920x1080
GeForce GTX 1050 Max-Q:
23.5  fps
QHD 2560x1440
GeForce GTX 1050 Max-Q:
13.5  fps
4K 3840x2160
GeForce GTX 1050 Max-Q:
6.9  fps
low 1280x720
100%
GeForce GTX 1070 Ti (Desktop):
121  fps
57%
GeForce GTX 1050 Max-Q:
69  fps
med. 1920x1080
100%
GeForce GTX 1070 Ti (Desktop):
107  fps
36%
GeForce GTX 1050 Max-Q:
39  fps
high 1920x1080
100%
GeForce GTX 1070 Ti (Desktop):
103  fps
36%
GeForce GTX 1050 Max-Q:
37  fps
ultra 1920x1080
100%
GeForce GTX 1070 Ti (Desktop):
93  fps
37%
GeForce GTX 1050 Max-Q:
34  fps
QHD 2560x1440
100%
GeForce GTX 1070 Ti (Desktop):
76  fps
32%
GeForce GTX 1050 Max-Q:
24  fps
4K 3840x2160
100%
GeForce GTX 1070 Ti (Desktop):
42  fps
29%
GeForce GTX 1050 Max-Q:
12  fps
low 1280x720
100%
GeForce GTX 1070 Ti (Desktop):
147  fps
35%
GeForce GTX 1050 Max-Q:
52.1  fps
med. 1920x1080
100%
GeForce GTX 1070 Ti (Desktop):
83  fps
30%
GeForce GTX 1050 Max-Q:
24.9  fps
high 1920x1080
100%
GeForce GTX 1070 Ti (Desktop):
63  fps
30%
GeForce GTX 1050 Max-Q:
18.7  fps
ultra 1920x1080
100%
GeForce GTX 1070 Ti (Desktop):
52.3  fps
28%
GeForce GTX 1050 Max-Q:
14.6  fps
QHD 2560x1440
100%
GeForce GTX 1070 Ti (Desktop):
40.2  fps
28%
GeForce GTX 1050 Max-Q:
11.4  fps
4K 3840x2160
100%
GeForce GTX 1070 Ti (Desktop):
24.6  fps
29%
GeForce GTX 1050 Max-Q:
7.1  fps
low 1280x720
100%
GeForce GTX 1070 Ti (Desktop):
144  fps
75%
GeForce GTX 1050 Max-Q:
107.9  fps
med. 1920x1080
100%
GeForce GTX 1070 Ti (Desktop):
138  fps
32%
GeForce GTX 1050 Max-Q:
44.4  fps
high 1920x1080
100%
GeForce GTX 1070 Ti (Desktop):
123  fps
29%
GeForce GTX 1050 Max-Q:
35.3  fps
ultra 1920x1080
100%
GeForce GTX 1070 Ti (Desktop):
121  fps
29%
GeForce GTX 1050 Max-Q:
35.3  fps
QHD 2560x1440
100%
GeForce GTX 1070 Ti (Desktop):
81  fps
31%
GeForce GTX 1050 Max-Q:
24.8  fps
4K 3840x2160
100%
GeForce GTX 1070 Ti (Desktop):
42.4  fps
30%
GeForce GTX 1050 Max-Q:
12.7  fps
ultra 1920x1080
100%
GeForce GTX 1070 Ti (Desktop):
88  fps
QHD 2560x1440
100%
GeForce GTX 1070 Ti (Desktop):
64  fps
4K 3840x2160
100%
GeForce GTX 1070 Ti (Desktop):
35.3  fps
med. 1920x1080
GeForce GTX 1050 Max-Q:
33.6  fps
high 1920x1080
GeForce GTX 1050 Max-Q:
37.2  fps
ultra 1920x1080
100%
GeForce GTX 1070 Ti (Desktop):
110  fps
29%
GeForce GTX 1050 Max-Q:
31.5  fps
QHD 2560x1440
100%
GeForce GTX 1070 Ti (Desktop):
74  fps
4K 3840x2160
100%
GeForce GTX 1070 Ti (Desktop):
35.4  fps
med. 1920x1080
GeForce GTX 1050 Max-Q:
46.1  fps
high 1920x1080
GeForce GTX 1050 Max-Q:
39.7  fps
ultra 1920x1080
100%
GeForce GTX 1070 Ti (Desktop):
111  fps
33%
GeForce GTX 1050 Max-Q:
36.5  fps
QHD 2560x1440
100%
GeForce GTX 1070 Ti (Desktop):
83  fps
4K 3840x2160
100%
GeForce GTX 1070 Ti (Desktop):
47.1  fps
low 1280x720
GeForce GTX 1050 Max-Q:
183.8  fps
med. 1920x1080
GeForce GTX 1050 Max-Q:
104.8  fps
high 1920x1080
GeForce GTX 1050 Max-Q:
64.7  fps
ultra 1920x1080
GeForce GTX 1050 Max-Q:
46.6  fps
QHD 2560x1440
GeForce GTX 1050 Max-Q:
31.5  fps
4K 3840x2160
GeForce GTX 1050 Max-Q:
15.5  fps
ultra 1920x1080
100%
GeForce GTX 1070 Ti (Desktop):
120  fps
QHD 2560x1440
100%
GeForce GTX 1070 Ti (Desktop):
80  fps
4K 3840x2160
100%
GeForce GTX 1070 Ti (Desktop):
40.1  fps
low 1280x720
GeForce GTX 1050 Max-Q:
56  fps
med. 1920x1080
GeForce GTX 1050 Max-Q:
37  fps
high 1920x1080
GeForce GTX 1050 Max-Q:
31  fps
ultra 1920x1080
100%
GeForce GTX 1070 Ti (Desktop):
63  fps
25%
GeForce GTX 1050 Max-Q:
16  fps
QHD 2560x1440
100%
GeForce GTX 1070 Ti (Desktop):
48  fps
21%
GeForce GTX 1050 Max-Q:
10  fps
4K 3840x2160
100%
GeForce GTX 1070 Ti (Desktop):
27  fps
22%
GeForce GTX 1050 Max-Q:
6  fps
ultra 1920x1080
100%
GeForce GTX 1070 Ti (Desktop):
100  fps
QHD 2560x1440
100%
GeForce GTX 1070 Ti (Desktop):
81  fps
4K 3840x2160
100%
GeForce GTX 1070 Ti (Desktop):
55  fps
FIFA 19

FIFA 19

2018
high 1920x1080
GeForce GTX 1050 Max-Q:
96.5  fps
ultra 1920x1080
100%
GeForce GTX 1070 Ti (Desktop):
267  fps
38%
GeForce GTX 1050 Max-Q:
100.8  fps
4K 3840x2160
100%
GeForce GTX 1070 Ti (Desktop):
141  fps
low 1280x720
GeForce GTX 1050 Max-Q:
44 57 ~ 51 fps
med. 1920x1080
GeForce GTX 1050 Max-Q:
27 33 ~ 30 fps
high 1920x1080
GeForce GTX 1050 Max-Q:
25 26 ~ 26 fps
ultra 1920x1080
100%
GeForce GTX 1070 Ti (Desktop):
84  fps
27%
GeForce GTX 1050 Max-Q:
22 23 ~ 23 fps
QHD 2560x1440
100%
GeForce GTX 1070 Ti (Desktop):
51  fps
31%
GeForce GTX 1050 Max-Q:
16  fps
4K 3840x2160
100%
GeForce GTX 1070 Ti (Desktop):
28  fps
29%
GeForce GTX 1050 Max-Q:
8  fps
F1 2018

F1 2018

2018
low 1280x720
GeForce GTX 1050 Max-Q:
104  fps
med. 1920x1080
GeForce GTX 1050 Max-Q:
63  fps
high 1920x1080
GeForce GTX 1050 Max-Q:
47  fps
ultra 1920x1080
100%
GeForce GTX 1070 Ti (Desktop):
97  fps
30%
GeForce GTX 1050 Max-Q:
29  fps
QHD 2560x1440
100%
GeForce GTX 1070 Ti (Desktop):
78  fps
4K 3840x2160
100%
GeForce GTX 1070 Ti (Desktop):
49  fps
27%
GeForce GTX 1050 Max-Q:
13  fps
low 1280x720
GeForce GTX 1050 Max-Q:
73.7  fps
med. 1920x1080
GeForce GTX 1050 Max-Q:
32  fps
high 1920x1080
GeForce GTX 1050 Max-Q:
24  fps
ultra 1920x1080
100%
GeForce GTX 1070 Ti (Desktop):
78  fps
26%
GeForce GTX 1050 Max-Q:
20  fps
QHD 2560x1440
100%
GeForce GTX 1070 Ti (Desktop):
48.5  fps
4K 3840x2160
100%
GeForce GTX 1070 Ti (Desktop):
23.8  fps
24%
GeForce GTX 1050 Max-Q:
5.8  fps
med. 1920x1080
GeForce GTX 1050 Max-Q:
42  fps
high 1920x1080
GeForce GTX 1050 Max-Q:
37  fps
ultra 1920x1080
GeForce GTX 1050 Max-Q:
33.4  fps
4K 3840x2160
GeForce GTX 1050 Max-Q:
10.4  fps
Far Cry 5

Far Cry 5

2018
low 1280x720
100%
GeForce GTX 1070 Ti (Desktop):
135  fps
51%
GeForce GTX 1050 Max-Q:
66 71 ~ 69 fps
med. 1920x1080
100%
GeForce GTX 1070 Ti (Desktop):
114  fps
32%
GeForce GTX 1050 Max-Q:
35 38 ~ 37 fps
high 1920x1080
100%
GeForce GTX 1070 Ti (Desktop):
108  fps
31%
GeForce GTX 1050 Max-Q:
33 35 ~ 34 fps
ultra 1920x1080
100%
GeForce GTX 1070 Ti (Desktop):
102  fps
30%
GeForce GTX 1050 Max-Q:
30 32 ~ 31 fps
QHD 2560x1440
100%
GeForce GTX 1070 Ti (Desktop):
75  fps
29%
GeForce GTX 1050 Max-Q:
22  fps
4K 3840x2160
100%
GeForce GTX 1070 Ti (Desktop):
39  fps
28%
GeForce GTX 1050 Max-Q:
10 11 ~ 11 fps
World of Tanks enCore

World of Tanks enCore

2018
low 1366x768
GeForce GTX 1050 Max-Q:
429.1  fps
med. 1920x1080
GeForce GTX 1050 Max-Q:
132.4  fps
ultra 1920x1080
GeForce GTX 1050 Max-Q:
51.4  fps
QHD 2560x1440
GeForce GTX 1050 Max-Q:
32.5  fps
4K 3840x2160
GeForce GTX 1050 Max-Q:
16  fps
low 1280x720
100%
GeForce GTX 1070 Ti (Desktop):
101  fps
88%
GeForce GTX 1050 Max-Q:
88.8  fps
med. 1920x1080
100%
GeForce GTX 1070 Ti (Desktop):
89  fps
91%
GeForce GTX 1050 Max-Q:
80.9  fps
high 1920x1080
100%
GeForce GTX 1070 Ti (Desktop):
74.5  fps
87%
GeForce GTX 1050 Max-Q:
65.1  fps
4K 3840x2160
100%
GeForce GTX 1070 Ti (Desktop):
66.7  fps
45%
GeForce GTX 1050 Max-Q:
30.3  fps
low 1280x720
100%
GeForce GTX 1070 Ti (Desktop):
154  fps
53%
GeForce GTX 1050 Max-Q:
82.1  fps
med. 1920x1080
100%
GeForce GTX 1070 Ti (Desktop):
100  fps
37%
GeForce GTX 1050 Max-Q:
36.8  fps
high 1920x1080
100%
GeForce GTX 1070 Ti (Desktop):
82  fps
36%
GeForce GTX 1050 Max-Q:
29.5  fps
ultra 1920x1080
100%
GeForce GTX 1070 Ti (Desktop):
59.1  fps
36%
GeForce GTX 1050 Max-Q:
21.5  fps
QHD 2560x1440
100%
GeForce GTX 1070 Ti (Desktop):
42.4  fps
4K 3840x2160
100%
GeForce GTX 1070 Ti (Desktop):
22.7  fps
26%
GeForce GTX 1050 Max-Q:
6  fps
low 1280x720
100%
GeForce GTX 1070 Ti (Desktop):
146  fps
39%
GeForce GTX 1050 Max-Q:
56.9  fps
med. 1920x1080
100%
GeForce GTX 1070 Ti (Desktop):
87  fps
34%
GeForce GTX 1050 Max-Q:
29.3  fps
high 1920x1080
100%
GeForce GTX 1070 Ti (Desktop):
63  fps
33%
GeForce GTX 1050 Max-Q:
20.6  fps
4K 3840x2160
100%
GeForce GTX 1070 Ti (Desktop):
27.7  fps
29%
GeForce GTX 1050 Max-Q:
7.9  fps
Fortnite

Fortnite

2018
low 1280x720
GeForce GTX 1050 Max-Q:
142.8  fps
med. 1920x1080
GeForce GTX 1050 Max-Q:
111.8  fps
high 1920x1080
GeForce GTX 1050 Max-Q:
49.4  fps
ultra 1920x1080
100%
GeForce GTX 1070 Ti (Desktop):
109  fps
33%
GeForce GTX 1050 Max-Q:
36.5  fps
QHD 2560x1440
100%
GeForce GTX 1070 Ti (Desktop):
72  fps
4K 3840x2160
100%
GeForce GTX 1070 Ti (Desktop):
36  fps
26%
GeForce GTX 1050 Max-Q:
9.3  fps
low 1280x720
GeForce GTX 1050 Max-Q:
82.5  fps
med. 1920x1080
GeForce GTX 1050 Max-Q:
56.5  fps
high 1920x1080
GeForce GTX 1050 Max-Q:
48.8  fps
ultra 1920x1080
100%
GeForce GTX 1070 Ti (Desktop):
117  fps
28%
GeForce GTX 1050 Max-Q:
32.7  fps
QHD 2560x1440
100%
GeForce GTX 1070 Ti (Desktop):
77  fps
4K 3840x2160
100%
GeForce GTX 1070 Ti (Desktop):
38  fps
19%
GeForce GTX 1050 Max-Q:
7.4  fps
ultra 1920x1080
100%
GeForce GTX 1070 Ti (Desktop):
122  fps
QHD 2560x1440
100%
GeForce GTX 1070 Ti (Desktop):
85  fps
4K 3840x2160
100%
GeForce GTX 1070 Ti (Desktop):
45  fps
low 1280x720
GeForce GTX 1050 Max-Q:
144.8  fps
med. 1920x1080
GeForce GTX 1050 Max-Q:
99.6  fps
high 1920x1080
GeForce GTX 1050 Max-Q:
46.7  fps
ultra 1920x1080
GeForce GTX 1050 Max-Q:
36.7  fps
4K 3840x2160
GeForce GTX 1050 Max-Q:
16.1  fps
low 1280x720
100%
GeForce GTX 1070 Ti (Desktop):
103  fps
57%
GeForce GTX 1050 Max-Q:
59  fps
med. 1920x1080
100%
GeForce GTX 1070 Ti (Desktop):
92  fps
43%
GeForce GTX 1050 Max-Q:
40  fps
high 1920x1080
100%
GeForce GTX 1070 Ti (Desktop):
88  fps
40%
GeForce GTX 1050 Max-Q:
35  fps
ultra 1920x1080
100%
GeForce GTX 1070 Ti (Desktop):
75  fps
37%
GeForce GTX 1050 Max-Q:
28  fps
QHD 2560x1440
100%
GeForce GTX 1070 Ti (Desktop):
58  fps
4K 3840x2160
100%
GeForce GTX 1070 Ti (Desktop):
34  fps
32%
GeForce GTX 1050 Max-Q:
11  fps
Destiny 2

Destiny 2

2017
low 1280x720
GeForce GTX 1050 Max-Q:
82.2  fps
med. 1920x1080
GeForce GTX 1050 Max-Q:
57.4  fps
high 1920x1080
GeForce GTX 1050 Max-Q:
51.6  fps
ultra 1920x1080
GeForce GTX 1050 Max-Q:
38.1  fps
4K 3840x2160
GeForce GTX 1050 Max-Q:
13.5  fps
low 1280x720
100%
GeForce GTX 1070 Ti (Desktop):
165  fps
59%
GeForce GTX 1050 Max-Q:
97  fps
med. 1920x1080
100%
GeForce GTX 1070 Ti (Desktop):
136  fps
32%
GeForce GTX 1050 Max-Q:
44  fps
high 1920x1080
100%
GeForce GTX 1070 Ti (Desktop):
109  fps
28%
GeForce GTX 1050 Max-Q:
31  fps
ultra 1920x1080
100%
GeForce GTX 1070 Ti (Desktop):
85  fps
28%
GeForce GTX 1050 Max-Q:
24  fps
4K 3840x2160
100%
GeForce GTX 1070 Ti (Desktop):
34  fps
29%
GeForce GTX 1050 Max-Q:
10  fps
FIFA 18

FIFA 18

2017
low 1280x720
GeForce GTX 1050 Max-Q:
254.7  fps
med. 1920x1080
GeForce GTX 1050 Max-Q:
153.2  fps
high 1920x1080
GeForce GTX 1050 Max-Q:
127.5  fps
ultra 1920x1080
GeForce GTX 1050 Max-Q:
127  fps
4K 3840x2160
GeForce GTX 1050 Max-Q:
55.5  fps
ultra 1920x1080
100%
GeForce GTX 1070 Ti (Desktop):
47.1  fps
4K 3840x2160
100%
GeForce GTX 1070 Ti (Desktop):
17.3  fps
F1 2017

F1 2017

2017
ultra 1920x1080
100%
GeForce GTX 1070 Ti (Desktop):
106  fps
4K 3840x2160
100%
GeForce GTX 1070 Ti (Desktop):
52  fps
high 1920x1080
GeForce GTX 1050 Max-Q:
51.4  fps
ultra 1920x1080
GeForce GTX 1050 Max-Q:
33.6  fps
4K 3840x2160
GeForce GTX 1050 Max-Q:
11.3  fps
low 1280x720
GeForce GTX 1050 Max-Q:
136  fps
med. 1366x768
GeForce GTX 1050 Max-Q:
128  fps
high 1920x1080
GeForce GTX 1050 Max-Q:
120  fps
ultra 1920x1080
GeForce GTX 1050 Max-Q:
118  fps
4K 3820x2160
100%
GeForce GTX 1070 Ti (Desktop):
152  fps
36%
GeForce GTX 1050 Max-Q:
55  fps
Dirt 4

Dirt 4

2017
low 1280x720
GeForce GTX 1050 Max-Q:
191.1  fps
med. 1920x1080
GeForce GTX 1050 Max-Q:
88  fps
high 1920x1080
GeForce GTX 1050 Max-Q:
47.1  fps
ultra 1920x1080
GeForce GTX 1050 Max-Q:
26.2  fps
4K 3840x2160
100%
GeForce GTX 1070 Ti (Desktop):
57.9  fps
27%
GeForce GTX 1050 Max-Q:
15.4  fps
low 1280x720
GeForce GTX 1050 Max-Q:
240.3  fps
med. 1920x1080
GeForce GTX 1050 Max-Q:
155.4  fps
high 1920x1080
100%
GeForce GTX 1070 Ti (Desktop):
223  fps
44%
GeForce GTX 1050 Max-Q:
98.8  fps
4K 3840x2160
100%
GeForce GTX 1070 Ti (Desktop):
92  fps
40%
GeForce GTX 1050 Max-Q:
36.7  fps
low 1280x720
GeForce GTX 1050 Max-Q:
80.6  fps
med. 1920x1080
GeForce GTX 1050 Max-Q:
35.7  fps
high 1920x1080
GeForce GTX 1050 Max-Q:
32.5  fps
ultra 1920x1080
100%
GeForce GTX 1070 Ti (Desktop):
54.2  fps
32%
GeForce GTX 1050 Max-Q:
17.1  fps
4K 3840x2160
100%
GeForce GTX 1070 Ti (Desktop):
35.8  fps
29%
GeForce GTX 1050 Max-Q:
10.5  fps
For Honor

For Honor

2017
low 1280x720
GeForce GTX 1050 Max-Q:
135.2 140.5 ~ 138 fps
med. 1920x1080
GeForce GTX 1050 Max-Q:
52.7 53.5 ~ 53 fps
high 1920x1080
100%
GeForce GTX 1070 Ti (Desktop):
156  fps
32%
GeForce GTX 1050 Max-Q:
49.8 49.8 ~ 50 fps
ultra 1920x1080
100%
GeForce GTX 1070 Ti (Desktop):
122  fps
31%
GeForce GTX 1050 Max-Q:
38.1 38.2 ~ 38 fps
4K 3840x2160
100%
GeForce GTX 1070 Ti (Desktop):
47.9  fps
31%
GeForce GTX 1050 Max-Q:
14.7 15 ~ 15 fps
4K 3840x2160
100%
GeForce GTX 1070 Ti (Desktop):
67.8  fps
4K 3840x2160
100%
GeForce GTX 1070 Ti (Desktop):
80  fps
low 1280x720
GeForce GTX 1050 Max-Q:
144.7  fps
med. 1366x768
GeForce GTX 1050 Max-Q:
89.2  fps
high 1920x1080
GeForce GTX 1050 Max-Q:
45  fps
ultra 1920x1080
GeForce GTX 1050 Max-Q:
41.3  fps
4K 3840x2160
GeForce GTX 1050 Max-Q:
15.9  fps
low 1024x768
GeForce GTX 1050 Max-Q:
141  fps
med. 1366x768
GeForce GTX 1050 Max-Q:
82.7  fps
high 1920x1080
GeForce GTX 1050 Max-Q:
35  fps
ultra 1920x1080
100%
GeForce GTX 1070 Ti (Desktop):
108  fps
26%
GeForce GTX 1050 Max-Q:
28.6  fps
4K 3840x2160
100%
GeForce GTX 1070 Ti (Desktop):
91  fps
25%
GeForce GTX 1050 Max-Q:
23  fps
low 1280x720
GeForce GTX 1050 Max-Q:
70.5 71.5 ~ 71 fps
med. 1366x768
GeForce GTX 1050 Max-Q:
52.6 54.8 ~ 54 fps
high 1920x1080
GeForce GTX 1050 Max-Q:
28.3 30.1 ~ 29 fps
ultra 1920x1080
100%
GeForce GTX 1070 Ti (Desktop):
67.9  fps
31%
GeForce GTX 1050 Max-Q:
20.3 21.4 ~ 21 fps
4K 3840x2160
100%
GeForce GTX 1070 Ti (Desktop):
31.9  fps
28%
GeForce GTX 1050 Max-Q:
9 9.6 ~ 9 fps
Overwatch

Overwatch

2016
low 1280x720
GeForce GTX 1050 Max-Q:
256.9  fps
med. 1366x768
GeForce GTX 1050 Max-Q:
160  fps
high 1920x1080
GeForce GTX 1050 Max-Q:
80.5  fps
ultra 1920x1080
100%
GeForce GTX 1070 Ti (Desktop):
182  fps
27%
GeForce GTX 1050 Max-Q:
48.9  fps
4K 3840x2160
100%
GeForce GTX 1070 Ti (Desktop):
88.7  fps
29%
GeForce GTX 1050 Max-Q:
26  fps
low 1280x768
GeForce GTX 1050 Max-Q:
53.8  fps
med. 1920x1080
GeForce GTX 1050 Max-Q:
33.5  fps
high 1920x1080
GeForce GTX 1050 Max-Q:
29.1  fps
4K 3840x2160
GeForce GTX 1050 Max-Q:
18.9  fps
low 1280x720
GeForce GTX 1050 Max-Q:
109.9  fps
med. 1366x768
GeForce GTX 1050 Max-Q:
69.8  fps
high 1920x1080
GeForce GTX 1050 Max-Q:
32.3  fps
ultra 1920x1080
100%
GeForce GTX 1070 Ti (Desktop):
94.6  fps
26%
GeForce GTX 1050 Max-Q:
24.8  fps
4K 3840x2160
100%
GeForce GTX 1070 Ti (Desktop):
45.6  fps
24%
GeForce GTX 1050 Max-Q:
10.9  fps
ultra 1920x1080
100%
GeForce GTX 1070 Ti (Desktop):
98  fps
4K 3840x2160
100%
GeForce GTX 1070 Ti (Desktop):
41  fps
low 1024x768
GeForce GTX 1050 Max-Q:
98 105.5 ~ 102 fps
med. 1366x768
GeForce GTX 1050 Max-Q:
41.4 56 62 ~ 53 fps
high 1920x1080
GeForce GTX 1050 Max-Q:
33.9 34.6 36 ~ 35 fps
ultra 1920x1080
100%
GeForce GTX 1070 Ti (Desktop):
111  fps
26%
GeForce GTX 1050 Max-Q:
28.7 29 30.3 ~ 29 fps
4K 3840x2160
100%
GeForce GTX 1070 Ti (Desktop):
46.5  fps
28%
GeForce GTX 1050 Max-Q:
12.9  fps
low 1024x768
GeForce GTX 1050 Max-Q:
108 170.3 ~ 139 fps
med. 1366x768
GeForce GTX 1050 Max-Q:
93.5 127.3 ~ 110 fps
high 1920x1080
GeForce GTX 1050 Max-Q:
67.5 80.4 ~ 74 fps
ultra 1920x1080
100%
GeForce GTX 1070 Ti (Desktop):
177  fps
37%
GeForce GTX 1050 Max-Q:
62.8 67 ~ 65 fps
4K 3840x2160
100%
GeForce GTX 1070 Ti (Desktop):
77  fps
31%
GeForce GTX 1050 Max-Q:
22.1 26.1 ~ 24 fps
low 1366x768
GeForce GTX 1050 Max-Q:
174.8  fps
med. 1366x768
GeForce GTX 1050 Max-Q:
140.9  fps
high 1920x1080
GeForce GTX 1050 Max-Q:
109.3  fps
ultra 1920x1080
GeForce GTX 1050 Max-Q:
83.3  fps
4K 3840 x 2160
GeForce GTX 1050 Max-Q:
26.1  fps
low 1280x720
100%
GeForce GTX 1070 Ti (Desktop):
142.7  fps
105%
GeForce GTX 1050 Max-Q:
149.5  fps
med. 1366x768
100%
GeForce GTX 1070 Ti (Desktop):
134.2  fps
100%
GeForce GTX 1050 Max-Q:
134.1  fps
high 1920x1080
100%
GeForce GTX 1070 Ti (Desktop):
126.6  fps
91%
GeForce GTX 1050 Max-Q:
115.5  fps
ultra 1920x1080
100%
GeForce GTX 1070 Ti (Desktop):
121.2  fps
86%
GeForce GTX 1050 Max-Q:
104.1  fps
4K 3840x2160
100%
GeForce GTX 1070 Ti (Desktop):
105  fps
35%
GeForce GTX 1050 Max-Q:
37.1  fps
low 1024x768
100%
GeForce GTX 1070 Ti (Desktop):
293  fps
30%
GeForce GTX 1050 Max-Q:
64 100.5 103.2 ~ 89 fps
med. 1366x768
GeForce GTX 1050 Max-Q:
57.6 59.3 60 ~ 59 fps
high 1920x1080
GeForce GTX 1050 Max-Q:
34 34.5 41 ~ 37 fps
ultra 1920x1080
100%
GeForce GTX 1070 Ti (Desktop):
71.8  fps
32%
GeForce GTX 1050 Max-Q:
18.5 20.8 30 ~ 23 fps
4K 3840x2160
100%
GeForce GTX 1070 Ti (Desktop):
47.1  fps
28%
GeForce GTX 1050 Max-Q:
12 13.1 ~ 13 fps
GTA V

GTA V

2015
low 1024x768
GeForce GTX 1050 Max-Q:
118.7 154.1 ~ 136 fps
med. 1366x768
GeForce GTX 1050 Max-Q:
112.9 139.8 ~ 126 fps
high 1920x1080
GeForce GTX 1050 Max-Q:
61.8 62.1 ~ 62 fps
ultra 1920x1080
GeForce GTX 1050 Max-Q:
27 27.7 ~ 27 fps
4K 3840x2160
100%
GeForce GTX 1070 Ti (Desktop):
67  fps
42%
GeForce GTX 1050 Max-Q:
26.1 29.1 ~ 28 fps
Thief

Thief

2014
low 1024x768
GeForce GTX 1050 Max-Q:
106  fps
med. 1366x768
GeForce GTX 1050 Max-Q:
56.5 76 ~ 66 fps
high 1366x768
GeForce GTX 1050 Max-Q:
57.2 66 ~ 62 fps
ultra 1920x1080
GeForce GTX 1050 Max-Q:
38 38.8 ~ 38 fps
low 1024x768
GeForce GTX 1050 Max-Q:
79.7  fps
med. 1366x768
GeForce GTX 1050 Max-Q:
71.8  fps
high 1366x768
GeForce GTX 1050 Max-Q:
48.7  fps
ultra 1920x1080
GeForce GTX 1050 Max-Q:
21.9  fps
low 1280x720
GeForce GTX 1050 Max-Q:
266 278.7 285.1 ~ 277 fps
med. 1366x768
GeForce GTX 1050 Max-Q:
172.6 172.9 252 ~ 199 fps
high 1366x768
GeForce GTX 1050 Max-Q:
147.7 150 150.4 151.8 ~ 150 fps
ultra 1920x1080
100%
GeForce GTX 1070 Ti (Desktop):
132  fps
46%
GeForce GTX 1050 Max-Q:
59 60.4 62.1 62.1 ~ 61 fps
low 1024x768
GeForce GTX 1050 Max-Q:
333.8  fps
med. 1366x768
GeForce GTX 1050 Max-Q:
216.6  fps
high 1366x768
GeForce GTX 1050 Max-Q:
157.8  fps
ultra 1920x1080
GeForce GTX 1050 Max-Q:
73.8  fps
low 1024x768
GeForce GTX 1050 Max-Q:
316  fps
med. 1366x768
GeForce GTX 1050 Max-Q:
296.3  fps
high 1366x768
GeForce GTX 1050 Max-Q:
233.3  fps
ultra 1920x1080
GeForce GTX 1050 Max-Q:
143.8  fps
QHD 2560x1440
GeForce GTX 1050 Max-Q:
93.5  fps
4K 3820x2160
GeForce GTX 1050 Max-Q:
53.4  fps
Fifa 11

Fifa 11

2010
med. 1024x768
Quadro FX 3800M:
230.6  fps
high 1360x768
Quadro FX 3800M:
124.2  fps
Risen

Risen

2009
med. 1024x768
Quadro FX 3800M:
64.9  fps
ultra 1920x1080
Quadro FX 3800M:
31.8  fps
Need for Speed Shift

Need for Speed Shift

2009
med. 1024x768
Quadro FX 3800M:
78.5  fps
ultra 1920x1080
Quadro FX 3800M:
40.9  fps
Colin McRae: DIRT 2

Colin McRae: DIRT 2

2009
low 800x600
Quadro FX 3800M:
97  fps
med. 1024x768
Quadro FX 3800M:
82  fps
ultra 1920x1080
Quadro FX 3800M:
29.9  fps
Anno 1404

Anno 1404

2009
low 1024x768
Quadro FX 3800M:
142.8  fps
ultra 1280x1024
Quadro FX 3800M:
61.9  fps

Average Gaming NVIDIA GeForce GTX 1070 Ti (Desktop) → 100%

Average Gaming 30-70 fps → 100%

Average Gaming NVIDIA GeForce GTX 1050 Max-Q → 36%

Average Gaming 30-70 fps → 37%

NVIDIA GeForce GTX 1050 Max-Qlowmed.highultraQHD4K
Hunt Showdown83.132.526.415.47.5
Red Dead Redemption 235.125.316.19.8
Star Wars Jedi Fallen Order43.635.831.119.99.9
Need for Speed Heat61.334.429.827.719.510
Call of Duty Modern Warfare 201956.436.128.725.717.39.1
GRID 201989.141.229.221.311.77.3
Ghost Recon Breakpoint56312919116
FIFA 20200.7105.2100.786.469.447.1
Borderlands 381.335.322.516.511.64.9
Control67.82316.810.55.1
F1 20191345849432715
Total War: Three Kingdoms119.338.523.216.96.53.3
Rage 269.531.126.62616.34.9
Anno 180073.245.826.514.110.16.1
The Division 273342719126
Dirt Rally 2.0142.145.738.821.816.18.8
Anthem58.229.928.623.513.56.9
Far Cry New Dawn693937342412
Metro Exodus52.124.918.714.611.47.1
Apex Legends107.944.435.335.324.812.7
Darksiders III33.637.231.5
Battlefield V46.139.736.5
Farming Simulator 19183.8104.864.746.631.515.5
Assassin´s Creed Odyssey56373116106
FIFA 1996.5100.8
Shadow of the Tomb Raider51302623168
F1 201810463472913
Monster Hunter World73.73224205.8
The Crew 2423733.410.4
Far Cry 5693734312211
World of Tanks enCore429.1132.451.432.516
X-Plane 11.1188.880.965.130.3
Kingdom Come: Deliverance82.136.829.521.56
Final Fantasy XV Benchmark56.929.320.67.9
Fortnite142.8111.849.436.59.3
Star Wars Battlefront 282.556.548.832.77.4
Call of Duty WWII144.899.646.736.716.1
Assassin´s Creed Origins5940352811
Destiny 282.257.451.638.113.5
Middle-earth: Shadow of War9744312410
FIFA 18254.7153.2127.512755.5
Playerunknown's Battlegrounds (PUBG)51.433.611.3
Team Fortress 213612812011855
Dirt 4191.18847.126.215.4
Rocket League240.3155.498.836.7
Ghost Recon Wildlands80.635.732.517.110.5
For Honor13853503815
Battlefield 1144.789.24541.315.9
Civilization VI14182.73528.623
Deus Ex Mankind Divided715429219
Overwatch256.916080.548.926
Ashes of the Singularity53.833.529.118.9
The Division109.969.832.324.810.9
Rise of the Tomb Raider10253352912.9
Rainbow Six Siege139110746524
World of Warships174.8140.9109.383.326.1
Dota 2 Reborn149.5134.1115.5104.137.1
The Witcher 38959372313
GTA V136126622728
Thief106666238
Company of Heroes 279.771.848.721.87
BioShock Infinite27719915061
Tomb Raider333.8216.6157.873.8
Counter-Strike: GO316296.3233.3143.893.553.4
< 30 fps
< 60 fps
< 120 fps
≥ 120 fps

10
26
22
5
33
13
11
20
27
11
5
29
19
8
2
21
2
2
49
7

NVIDIA GeForce GTX 1070 Ti (Desktop)lowmed.highultraQHD4K
Control2007858.537.117.9
F1 20192441831641209457
League of Legends271249241219222221
Total War: Three Kingdoms86.663.441.220.3
Anno 18004640.424.1
Far Cry New Dawn121107103937642
Metro Exodus147836352.340.224.6
Apex Legends1441381231218142.4
Just Cause 4886435.3
Darksiders III1107435.4
Battlefield V1118347.1
Call of Duty Black Ops 41208040.1
Assassin´s Creed Odyssey634827
Forza Horizon 41008155
FIFA 19267141
Shadow of the Tomb Raider845128
F1 2018977849
Monster Hunter World7848.523.8
Far Cry 51351141081027539
X-Plane 11.111018974.566.7
Kingdom Come: Deliverance1541008259.142.422.7
Final Fantasy XV Benchmark146876327.7
Fortnite1097236
Star Wars Battlefront 21177738
Need for Speed Payback1228545
Assassin´s Creed Origins1039288755834
Middle-earth: Shadow of War1651361098534
Ark Survival Evolved47.117.3
F1 201710652
Team Fortress 2152
Dirt 457.9
Rocket League22392
Ghost Recon Wildlands54.235.8
For Honor15612247.9
Call of Duty Infinite Warfare67.8
Farming Simulator 1780
Civilization VI10891
Deus Ex Mankind Divided67.931.9
Overwatch18288.7
The Division94.645.6
Far Cry Primal9841
Rise of the Tomb Raider11146.5
Rainbow Six Siege17777
Dota 2 Reborn142.7134.2126.6121.2105
The Witcher 329371.847.1
GTA V67
BioShock Infinite132
< 30 fps
< 60 fps
< 120 fps
≥ 120 fps


2
12


8
5

1
9
6

5
22
11

9
13
1
10
24
9
3
NVIDIA Quadro FX 3800Mlowmed.highultraQHD4K
Fifa 11230.6124.2
Risen64.931.8
Need for Speed Shift78.540.9
Colin McRae: DIRT 2978229.9
Anno 1404142.861.9
< 30 fps
< 60 fps
< 120 fps
≥ 120 fps


1
1


3
1


1
1
2
1


Eine Liste mit weiteren Spielen und allen Grafikkarten finden Sie auf unserer Seite: Welches Spiel ist mit welcher Grafikkarte spielbar?

v1.28
log 20. 01:07:31

#0 ran 0s before starting gpusingle class +0s ... 0s

#1 checking url part for id 8258 +0s ... 0s

#2 checking url part for id 1541 +0s ... 0s

#3 checking url part for id 8482 +0s ... 0s

#4 redirected to Ajax server, took 1726787250s time from redirect:1 +0s ... 0s

#5 did not recreate cache, as it is less than 5 days old! Created at Thu, 19 Sep 2024 05:16:33 +0200 +0s ... 0s

#6 composed specs +0.005s ... 0.006s

#7 did output specs +0s ... 0.006s

#8 start showIntegratedCPUs +0s ... 0.006s

#9 getting avg benchmarks for device 8258 +0.02s ... 0.025s

#10 got single benchmarks 8258 +0s ... 0.026s

#11 getting avg benchmarks for device 1541 +0s ... 0.026s

#12 got single benchmarks 1541 +0.006s ... 0.032s

#13 getting avg benchmarks for device 8482 +0.004s ... 0.036s

#14 got single benchmarks 8482 +0.008s ... 0.044s

#15 got avg benchmarks for devices +0s ... 0.044s

#16 min, max, avg, median took s +0.033s ... 0.077s

#17 before gaming benchmark output +0s ... 0.077s

#18 Got 541 rows for game benchmarks. +0.022s ... 0.1s

#19 composed SQL query for gamebenchmarks +0s ... 0.1s

#20 got data and put it in $dataArray +0.004s ... 0.104s

#21 benchmarks composed for output. +0.024s ... 0.128s

#22 calculated avg scores. +0s ... 0.128s

#23 return log +0.001s ... 0.13s

Teilen Sie diesen Artikel, um uns zu unterstützen. Jeder Link hilft!
> Notebook Test, Laptop Test und News > Benchmarks / Technik > Benchmarks / Technik > Grafikkarten Vergleich - Head 2 Head
Autor: Klaus Hinum,  8.09.2017 (Update:  1.07.2023)