NVIDIA GeForce GTX 1070 SLI (Laptop) vs AMD Radeon Pro WX 3200 vs NVIDIA GeForce GTX 1050 Max-Q
NVIDIA GeForce GTX 1070 SLI (Laptop) ► remove from comparison
Die Nvidia GeForce GTX 1070 SLI (Laptop) bezeichnet einen SLI-Verbund aus zwei High-End GeForce GTX 1070 Grafikkarten. Die GPUs nutzen denselben GP104-Chip mit 2.048 CUDA-Kernen wie das Notebook-Modell. Beide Karten rendern jeweils abwechselnd ein Bild (AFR), wodurch sich die Leistung gegenüber einer einzelnen GPU im Optimalfall fast verdoppelt. Der je 8 GB große Grafikspeicher verdoppelt sich durch den Einsatz beider Karten nicht, da jeweils die selben Daten gespeichert werden.
Features
Der GP104-Chip wird in einem 16nm-FinFET-Prozess bei TSMC gefertigt und bietet eine Reihe neuer Features, unter anderem Support für DisplayPort 1.4 (ready), HDMI 2.0b, HDR, Simultaneous Multi-Projection (SMP) sowie verbessertes H.265 Video De- und Encoding (PlayReady 3.0). Eine genaue Auflistung der Verbesserungen und Features der neuen Pascal Desktop-GPUs finden Sie in unserem Pascal-Architektur-Artikel
Performance
Die Performance der GTX 1070 SLI ist stark abhängig vom Treibersupport und den Spielen. Im Optimalfall wird die Performance einer einzelnen GTX 1070, wie schon bei den Vorgängern, fast verdoppelt, in anderen Fällen kann der Verbund auch deutlich schlechter oder gar nicht skalieren. Des Weiteren können mehr oder weniger ausgeprägte Mikroruckler die gefühlte Performance beeinträchtigen. Dennoch lassen sich die meisten Spiele des Jahres 2016 in maximalen Einstellungen und 4K-Auflösung flüssig darstellen.
Hinter dem nochmals rund 30 bis 35 Prozent schnelleren SLI-Verbund zweier GeForce-GTX-1080-Karten stellt die GTX 1070 SLI im Jahr 2016 die zweitschnellste Notebook-Grafiklösung auf dem Markt dar.
Leistungsaufnahme
Im SLI-Verbund verdoppelt sich der Stromverbrauch gegenüber einer einzelnen GTX 1070, sodass beide Karten zusammen vermutlich etwa 220 bis 240 Watt aufnehmen dürften. Aus diesem Grund ist die Grafiklösung nur in sehr großen und schweren Gaming-Notebooks zu finden.
AMD Radeon Pro WX 3200 ► remove from comparison
Die AMD Radeon Pro WX 3200 Mobile ist eine professionelle Grafikkarte für Laptops. Sie basiert auf den kleinen Polaris 12 Chip und entspricht damit der Consumer Radeon RX 550. Der Chip trägt den Codenamen Lexa und taktet die 640 Shader mit 1082 MHz. Der Speicher ist mit 1000 MHz (6000 MHz GDDR5 effektiv) getaktet und mit einem 128 Bit Bus angebunden.
Die AMD Radeon Pro (ehemals FirePro) Serie ist das Gegenstück zur Quadro Serie von Nvidia und bietet zertifizierte Treiber für professionelle 3D Anwendungen (CAD und DCC). Durch einige freigeschaltene Features und Optimierungen ist die Performance in derartigen Programmen dadurch deutlich besser als bei Consumer Radeon Grafikchips.
Die WX3200 nutzt die Polaris Architektur (4. Generation GCN) der 400er Serie und bietet lediglich einen leicht verbesserten Prozess der höhere Taktraten erlaubt. Mehr Informationen zur Polaris Architektur finden sie hier in unserem Fokusartikel .
Die mobile WX 3200 sollte alle Features der Polaris Chips unterstützen, so wie DisplayPort 1.4 (ready), HDMI 2.0b, neue H.265 Video-En- und Decoder und Architekturverbesserungen.
NVIDIA GeForce GTX 1050 Max-Q ► remove from comparison
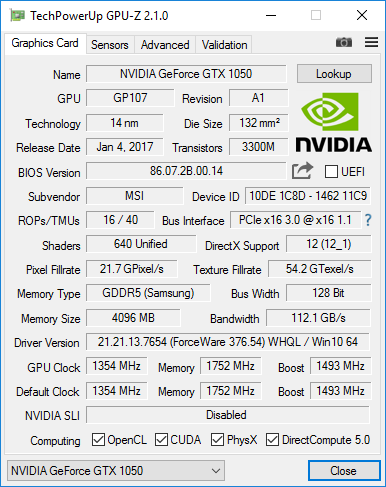
Die Nvidia GeForce GTX 1050 mit Max-Q Design ist eine Mittelklasse-GPU basierend auf der Pascal-Architektur und wurde im Januar 2018 vorgestellt. Je nach Kühlungsdesign ist sie 10-15% langsamer als eine GTX 1050 . Wie die GTX 1050, basiert die Max-Q Variante auf den GP107 Chp, der in 14 nm bei Samsung produziert wird.
Im Vergleich zur normalen GTX 1050 gibt es noch weitere Unterschiede als den Takt. Der Treiber wurde auf Effizienz (und nicht Leistung) optimiert (nur für die Max-Q Modelle), optimierte Spannungswandler für 1V Betreib, high-end Kühlungsmethoden und eine 40 dB Grenze für die Lüfterlautstärke (mit Taktanpasssungen um dies jederzeit zu gewährleisten) zeichnen die Max-Q Variante aus.
Features
Der GP107-Chip wird in einem 14-nm-FinFET-Prozess bei Samsung gefertigt und bietet eine Reihe neuer Features, unter anderem Support für DisplayPort 1.4 (ready), HDMI 2.0b, HDR, Simultaneous Multi-Projection (SMP) sowie verbessertes H.265 Video De- und Encoding (PlayReady 3.0). Eine genaue Auflistung der Verbesserungen und Features der neuen Pascal Desktop-GPUs finden Sie in unserem Pascal-Architektur-Artikel .
Performance
Die exakte Performance der GeForce GTX 1050 Max-Q kann sich in Abhängigkeit von der Kühlung des jeweiligen Notebooks stark unterscheiden. Nvidia gibt an das die durchschnittliche GTX 1050 mit Max-Q Design etwa 10 bis 15 Prozent langsamer ist als eine GTX 1050. Dadurch eignet sich die Grafikkarte am besten für Full HD und hoher (aber nicht maximaler) Detailstufe.
Leistungsaufnahme
Die Leistungsaufnahme der GeForce GTX 1050 Max-Q ist von Nvidia mit 34 bis 40 Watt angegeben (je nach Taktung) und damit deutlich geringer als die 53 Watt der normalen GeForce GTX 1050 . Dadurch eignet sich die Grafikkarte auch für dünne und leichte Notebooks.
NVIDIA GeForce GTX 1070 SLI (Laptop) AMD Radeon Pro WX 3200 NVIDIA GeForce GTX 1050 Max-Q GeForce GTX 1000 Serie Codename Pascal GP104 SLI Polaris 12 N17P-G0 Max-Q Architektur Pascal Polaris Pascal Pipelines 4096 - unified 640 - unified 640 - unified Kerntakt 1443 - 1645 (Boost) MHz 1082 MHz 999 - 1189 - 1139 - 1328 (Boost) MHz Speichertakt 8000 MHz 6000 MHz 7000 MHz Speicherbandbreite 256 Bit 128 Bit 128 Bit Speichertyp GDDR5 GDDR5 GDDR5 Max. Speichergröße 2x 8192 MB 4 GB 4 GB Shared Memory nein nein nein API DirectX 12_1, OpenGL 4.5 DirectX 12, OpenGL Vulkan DirectX 12_1, OpenGL 4.5 Transistors 14.4 Billion Herstellungsprozess 16 nm 14 nm 14 nm Features Multi-Projection, VR Ready, G-SYNC, Vulkan, Multi Monitor, CUDA, 3D Vision, PhysX, GeForce Experience, Surround, GameStream, GPU Boost 2.0, Adaptive Vertical Sync, SLI DisplayPort 1.3 HBR / 1.4 HDR Ready, HDMI 2.0 Notebookgröße groß (17" z.B.) mittel (15.4" z.B.) groß (17" z.B.) Erscheinungsdatum 16.08.2016 26.09.2019 03.01.2018 Stromverbrauch 34 - 40 Watt Herstellerseite www.nvidia.com
Benchmarks Performance Rating - 3DMark 11 + Fire Strike + Time Spy - GeForce GTX 1070 SLI (Laptop)
14.6 pt (44%)
...
NVIDIA GeForce GTX 1070 SLI (Laptop)
max:
Performance Rating - 3DMark 11 + Fire Strike + Time Spy - Radeon Pro WX 3200
1.4 pt (4%)
...
...
max:
Performance Rating - 3DMark 11 + Fire Strike + Time Spy - GeForce GTX 1050 Max-Q
2.5 pt (8%)
...
NVIDIA GeForce GTX 1050 Max-Q
...
max:
3DMark - 3DMark Time Spy Score
min: 8781 avg: 8856 median: 8856 (26%) max: 8931 Points
min: 1039 avg: 1059 median: 1059 (3%) max: 1079 Points
min: 1709 avg: 1754 median: 1753.5 (5%) max: 1798 Points
3DMark - 3DMark Time Spy Graphics
min: 10307 avg: 10455 median: 10455 (28%) max: 10603 Points
min: 938 avg: 956 median: 955.5 (3%) max: 973 Points
min: 1596 avg: 1615 median: 1615 (4%) max: 1634 Points
3DMark - 3DMark Ice Storm Unlimited Graphics
min: 28712 avg: 105833 median: 105833 (11%) max: 182954 Points
318811 Points (32%)
3DMark - 3DMark Ice Storm Extreme Graphics
359951 Points (45%)
62128 Points (8%)
22530 Points (3%)
3DMark - 3DMark Cloud Gate Score
min: 31696 avg: 32422 median: 32510 (35%) max: 33061 Points
min: 11941 avg: 11960 median: 11960 (13%) max: 11979 Points
min: 14739 avg: 17501 median: 18259.5 (20%) max: 18746 Points
3DMark - 3DMark Cloud Gate Graphics
min: 149345 avg: 153545 median: 152370 (40%) max: 158919 Points
min: 18780 avg: 18866 median: 18866 (5%) max: 18952 Points
min: 27059 avg: 33618 median: 35392 (9%) max: 36630 Points
3DMark - 3DMark Fire Strike Standard Score
min: 20379 avg: 20776 median: 20816 (37%) max: 21132 Points
min: 2822 avg: 2871 median: 2871 (5%) max: 2920 Points
min: 5114 avg: 5213 median: 5223 (9%) max: 5292 Points
3DMark - 3DMark Fire Strike Standard Graphics
min: 32640 avg: 33718 median: 32969 (37%) max: 35545 Points
min: 3088 avg: 3156 median: 3156 (4%) max: 3224 Points
min: 5616 avg: 5677 median: 5649.5 (6%) max: 5792 Points
3DMark - 3DMark Ice Storm Graphics
min: 378149 avg: 400739 median: 410383 (48%) max: 413686 Points
78927 Points (9%)
min: 36552 avg: 43792 median: 43792 (5%) max: 51032 Points
3DMark 11 - 3DM11 Performance Score
min: 23326 avg: 23835 median: 23911 (33%) max: 24267 Points
min: 4592 avg: 4657 median: 4657 (6%) max: 4722 Points
min: 7116 avg: 7354 median: 7347.5 (10%) max: 7603 Points
3DMark 11 - 3DM11 Performance GPU
min: 41469 avg: 43219 median: 42910 (37%) max: 45279 Points
min: 4256 avg: 4338 median: 4337.5 (4%) max: 4419 Points
min: 6874 avg: 7142 median: 7153.5 (6%) max: 7385 Points
3DMark Vantage + NVIDIA GeForce GTX 1070 SLI (Laptop) 3DMark Vantage - 3DM Vant. Perf. total
56476 Points (16%)
3DM Vant. Perf. total + AMD Radeon Pro WX 3200
12538 Points (4%)
3DM Vant. Perf. total + NVIDIA GeForce GTX 1050 Max-Q
min: 26044 avg: 26081 median: 26080.5 (8%) max: 26117 Points
3DM Vant. Perf. GPU no PhysX + NVIDIA GeForce GTX 1070 SLI (Laptop) 3DMark Vantage - 3DM Vant. Perf. GPU no PhysX
77533 Points (42%)
3DM Vant. Perf. GPU no PhysX + NVIDIA GeForce GTX 1050 Max-Q
min: 25008 avg: 25293 median: 25292.5 (14%) max: 25577 Points
3DMark 06 3DMark 06 - Standard 1280x1024 + AMD Radeon Pro WX 3200
min: 16054 avg: 16329 median: 16329 (21%) max: 16604 Points
3DMark 06 - Standard 1280x1024 + NVIDIA GeForce GTX 1050 Max-Q
min: 9694 avg: 19691 median: 19690.5 (26%) max: 29687 Points
Unigine Valley 1.0 - Unigine Valley 1.0 DX
13.4 fps (4%)
30.8 fps (10%)
Unigine Heaven 3.0 - Unigine Heaven 3.0 DX 11
70.2 fps (23%)
Unigine Heaven 3.0 - Unigine Heaven 3.0 OpenGL
65 fps (29%)
Unigine Heaven 2.1 - Heaven 2.1 high
min: 100.9 avg: 101.2 median: 101.2 (19%) max: 101.4 fps
SPECviewperf 11 + NVIDIA GeForce GTX 1070 SLI (Laptop) SPECviewperf 11 - specvp11 snx-01
13.2 fps (8%)
specvp11 tcvis-02 + NVIDIA GeForce GTX 1070 SLI (Laptop) SPECviewperf 11 - specvp11 tcvis-02
3.7 fps (2%)
specvp11 sw-02 + NVIDIA GeForce GTX 1070 SLI (Laptop) SPECviewperf 11 - specvp11 sw-02
24.7 fps (19%)
specvp11 proe-05 + NVIDIA GeForce GTX 1070 SLI (Laptop) SPECviewperf 11 - specvp11 proe-05
3.4 fps (4%)
specvp11 maya-03 + NVIDIA GeForce GTX 1070 SLI (Laptop) SPECviewperf 11 - specvp11 maya-03
15.3 fps (12%)
specvp11 lightwave-01 + NVIDIA GeForce GTX 1070 SLI (Laptop) SPECviewperf 11 - specvp11 lightwave-01
28.9 fps (31%)
specvp11 ensight-04 + NVIDIA GeForce GTX 1070 SLI (Laptop) SPECviewperf 11 - specvp11 ensight-04
72.8 fps (35%)
specvp11 catia-03 + NVIDIA GeForce GTX 1070 SLI (Laptop) SPECviewperf 11 - specvp11 catia-03
20.3 fps (11%)
SPECviewperf 12 + NVIDIA GeForce GTX 1070 SLI (Laptop) SPECviewperf 12 - specvp12 sw-03
64.7 fps (16%)
specvp12 sw-03 + AMD Radeon Pro WX 3200
min: 39.3 avg: 40.4 median: 40.4 (10%) max: 41.43 fps
specvp12 snx-02 + NVIDIA GeForce GTX 1070 SLI (Laptop) SPECviewperf 12 - specvp12 snx-02
8.7 fps (1%)
specvp12 snx-02 + AMD Radeon Pro WX 3200
min: 27.78 avg: 31.5 median: 31.5 (5%) max: 35.12 fps
specvp12 showcase-01 + NVIDIA GeForce GTX 1070 SLI (Laptop) SPECviewperf 12 - specvp12 showcase-01
82.3 fps (18%)
specvp12 showcase-01 + AMD Radeon Pro WX 3200
min: 16.24 avg: 17.8 median: 17.7 (4%) max: 19.25 fps
specvp12 mediacal-01 + NVIDIA GeForce GTX 1070 SLI (Laptop) SPECviewperf 12 - specvp12 mediacal-01
43.5 fps (11%)
specvp12 mediacal-01 + AMD Radeon Pro WX 3200
min: 7.42 avg: 8.1 median: 8.1 (2%) max: 8.83 fps
specvp12 maya-04 + NVIDIA GeForce GTX 1070 SLI (Laptop) SPECviewperf 12 - specvp12 maya-04
144.7 fps (39%)
specvp12 maya-04 + AMD Radeon Pro WX 3200
min: 19.07 avg: 22 median: 22 (6%) max: 24.84 fps
specvp12 energy-01 + NVIDIA GeForce GTX 1070 SLI (Laptop) SPECviewperf 12 - specvp12 energy-01
9.2 fps (8%)
specvp12 energy-01 + AMD Radeon Pro WX 3200
min: 1.44 avg: 1.6 median: 1.6 (1%) max: 1.69 fps
specvp12 creo-01 + NVIDIA GeForce GTX 1070 SLI (Laptop) SPECviewperf 12 - specvp12 creo-01
56.4 fps (23%)
specvp12 creo-01 + AMD Radeon Pro WX 3200
min: 30.39 avg: 34.2 median: 34.1 (14%) max: 37.9 fps
specvp12 catia-04 + NVIDIA GeForce GTX 1070 SLI (Laptop) SPECviewperf 12 - specvp12 catia-04
84.1 fps (14%)
specvp12 catia-04 + AMD Radeon Pro WX 3200
min: 23.13 avg: 27.6 median: 27.6 (5%) max: 32.08 fps
specvp12 3dsmax-05 + AMD Radeon Pro WX 3200 SPECviewperf 12 - specvp12 3dsmax-05
29 fps (5%)
SPECviewperf 13 specvp13 sw-04 + AMD Radeon Pro WX 3200 SPECviewperf 13 - specvp13 sw-04
min: 42.53 avg: 43.6 median: 43.6 (12%) max: 44.6 fps
specvp13 snx-03 + AMD Radeon Pro WX 3200 SPECviewperf 13 - specvp13 snx-03
min: 49.48 avg: 57.8 median: 57.8 (6%) max: 66.1 fps
specvp13 showcase-02 + AMD Radeon Pro WX 3200 SPECviewperf 13 - specvp13 showcase-02
min: 16.69 avg: 18 median: 18 (4%) max: 19.38 fps
specvp13 medical-02 + AMD Radeon Pro WX 3200 SPECviewperf 13 - specvp13 medical-02
min: 11.26 avg: 11.5 median: 11.5 (2%) max: 11.8 fps
specvp13 maya-05 + AMD Radeon Pro WX 3200 SPECviewperf 13 - specvp13 maya-05
min: 29.43 avg: 37.3 median: 37.3 (4%) max: 45.21 fps
specvp13 energy-02 + AMD Radeon Pro WX 3200 SPECviewperf 13 - specvp13 energy-02
min: 1.88 avg: 2 median: 2 (1%) max: 2.15 fps
specvp13 creo-02 + AMD Radeon Pro WX 3200 SPECviewperf 13 - specvp13 creo-02
min: 29.71 avg: 37.2 median: 37.2 (5%) max: 44.68 fps
specvp13 catia-05 + AMD Radeon Pro WX 3200 SPECviewperf 13 - specvp13 catia-05
min: 32.53 avg: 38.9 median: 38.9 (4%) max: 45.35 fps
specvp13 3dsmax-06 + AMD Radeon Pro WX 3200 SPECviewperf 13 - specvp13 3dsmax-06
min: 32.36 avg: 33.8 median: 33.8 (6%) max: 35.17 fps
Cinebench R10 Cinebench R10 Shading (32bit) + AMD Radeon Pro WX 3200 Cinebench R10 - Cinebench R10 Shading (32bit)
9857 Points (7%)
Cinebench R10 Shading (32bit) + NVIDIA GeForce GTX 1050 Max-Q
min: 1803 avg: 5147 median: 6811 (5%) max: 6828 Points
Cinebench R11.5 Cinebench R11.5 OpenGL 64 Bit + NVIDIA GeForce GTX 1070 SLI (Laptop) Cinebench R11.5 - Cinebench R11.5 OpenGL 64 Bit
80.5 fps (26%)
Cinebench R11.5 OpenGL 64 Bit + AMD Radeon Pro WX 3200
57.4 fps (19%)
Cinebench R11.5 OpenGL 64 Bit + NVIDIA GeForce GTX 1050 Max-Q
min: 20.54 avg: 47.4 median: 47.4 (16%) max: 74.3 fps
Cinebench R15 + NVIDIA GeForce GTX 1070 SLI (Laptop) Cinebench R15 - Cinebench R15 OpenGL 64 Bit
min: 139.6 avg: 142.2 median: 142.2 (8%) max: 144.8 fps
Cinebench R15 OpenGL 64 Bit + AMD Radeon Pro WX 3200
min: 74 avg: 76.5 median: 76.5 (4%) max: 79 fps
Cinebench R15 OpenGL 64 Bit + NVIDIA GeForce GTX 1050 Max-Q
min: 64.5 avg: 100.9 median: 109.5 (6%) max: 119.9 fps
Cinebench R15 OpenGL Ref. Match 64 Bit + NVIDIA GeForce GTX 1070 SLI (Laptop) Cinebench R15 - Cinebench R15 OpenGL Ref. Match 64 Bit
99.6 % (100%)
Cinebench R15 OpenGL Ref. Match 64 Bit + AMD Radeon Pro WX 3200
98 % (98%)
Cinebench R15 OpenGL Ref. Match 64 Bit + NVIDIA GeForce GTX 1050 Max-Q
99.6 % (100%)
GFXBench - GFXBench 5.0 Aztec Ruins High Tier Offscreen
48.1 fps (9%)
GFXBench - GFXBench 5.0 Aztec Ruins Normal Tier Offscreen
128.3 fps (10%)
GFXBench - GFXBench Car Chase Offscreen
108.1 fps (12%)
GFXBench 3.1 - GFXBench Manhattan ES 3.1 Offscreen
165.2 fps (3%)
GFXBench 3.0 - GFXBench 3.0 Manhattan Offscreen
545 fps (32%)
223 fps (13%)
GFXBench (DX / GLBenchmark) 2.7 + NVIDIA GeForce GTX 1050 Max-Q GFXBench (DX / GLBenchmark) 2.7 - GFXBench T-Rex HD Offscreen C24Z16
441.6 fps (4%)
LuxMark v2.0 64Bit - LuxMark v2.0 Room GPU
5280 Samples/s (24%)
495 Samples/s (2%)
min: 967 avg: 968 median: 967.5 (4%) max: 968 Samples/s
LuxMark v2.0 64Bit - LuxMark v2.0 Sala GPU
10434 Samples/s (18%)
921 Samples/s (2%)
min: 1692 avg: 1702 median: 1702 (3%) max: 1712 Samples/s
ComputeMark v2.1 - ComputeMark v2.1 Result
13059 Points (14%)
649 Points (1%)
min: 4236 avg: 4343 median: 4342.5 (5%) max: 4449 Points
Power Consumption - Witcher 3 Power Consumption *
295 Watt (65%)
min: 50.4 avg: 50.7 median: 50.7 (11%) max: 51 Watt
68 Watt (15%)
Power Consumption - Witcher 3 ultra Power Efficiency
0.3 fps per Watt (31%)
min: 0.1843 avg: 0.2 median: 0.2 (18%) max: 0.2222 fps per Watt
0.3 fps per Watt (28%)
Emissions Witcher 3 Fan Noise + NVIDIA GeForce GTX 1070 SLI (Laptop) Emissions - Witcher 3 Fan Noise
56 dB(A) (90%)
Witcher 3 Fan Noise + AMD Radeon Pro WX 3200
min: 34.2 avg: 34.8 median: 34.8 (56%) max: 35.3 dB(A)
Witcher 3 Fan Noise + NVIDIA GeForce GTX 1050 Max-Q
37.4 dB(A) (60%)
Clock Speed - GPU Clock Witcher 3 ultra
1650 MHz (65%)
Average Benchmarks NVIDIA GeForce GTX 1070 SLI (Laptop) → 100% n=17 Average Benchmarks AMD Radeon Pro WX 3200 → 25% n=17 Average Benchmarks NVIDIA GeForce GTX 1050 Max-Q → 34% n=17
- Bereich der Benchmarkergebnisse für diese Grafikkarte
- Durchschnittliche Benchmarkergebnisse für diese Grafikkarte
* Smaller numbers mean a higher performance
1 This benchmark is not used for the average calculation
Spiele-Benchmarks Die folgenden Benchmarks basieren auf unseren Spieletests mit Testnotebooks. Die Performance dieser Grafikkarte bei den gelisteten Spielen ist abhängig von der verwendeten CPU, Speicherausstattung, Treiber und auch Betriebssystem. Dadurch müssen die untenstehenden Werte nicht repräsentativ sein. Detaillierte Informationen über das verwendete System sehen Sie nach einem Klick auf den fps-Wert.
GeForce GTX 1050 Max-Q:
83.1 fps
GeForce GTX 1050 Max-Q:
32.5 fps
GeForce GTX 1050 Max-Q:
26.4 fps
GeForce GTX 1050 Max-Q:
15.4 fps
GeForce GTX 1050 Max-Q:
7.5 fps
GeForce GTX 1050 Max-Q:
35.1 fps
GeForce GTX 1050 Max-Q:
25.3 fps
GeForce GTX 1050 Max-Q:
16.1 fps
GeForce GTX 1050 Max-Q:
9.8 fps
GeForce GTX 1050 Max-Q:
43.6 fps
GeForce GTX 1050 Max-Q:
35.8 fps
GeForce GTX 1050 Max-Q:
31.1 fps
GeForce GTX 1050 Max-Q:
19.9 fps
GeForce GTX 1050 Max-Q:
9.9 fps
GeForce GTX 1050 Max-Q:
61.3 fps
GeForce GTX 1050 Max-Q:
34.4 fps
GeForce GTX 1050 Max-Q:
29.8 fps
GeForce GTX 1050 Max-Q:
27.7 fps
GeForce GTX 1050 Max-Q:
19.5 fps
GeForce GTX 1050 Max-Q:
10 fps
GeForce GTX 1050 Max-Q:
56.4 fps
GeForce GTX 1050 Max-Q:
36.1 fps
GeForce GTX 1050 Max-Q:
28.7 fps
GeForce GTX 1050 Max-Q:
25.7 fps
GeForce GTX 1050 Max-Q:
17.3 fps
GeForce GTX 1050 Max-Q:
9.1 fps
GeForce GTX 1050 Max-Q:
89.1 fps
GeForce GTX 1050 Max-Q:
41.2 fps
GeForce GTX 1050 Max-Q:
29.2 fps
GeForce GTX 1050 Max-Q:
21.3 fps
GeForce GTX 1050 Max-Q:
11.7 fps
GeForce GTX 1050 Max-Q:
7.3 fps
GeForce GTX 1050 Max-Q:
56 fps
GeForce GTX 1050 Max-Q:
31 fps
GeForce GTX 1050 Max-Q:
29 fps
GeForce GTX 1050 Max-Q:
19 fps
GeForce GTX 1050 Max-Q:
11 fps
GeForce GTX 1050 Max-Q:
6 fps
GeForce GTX 1050 Max-Q:
200.7 fps
GeForce GTX 1050 Max-Q:
105.2 fps
GeForce GTX 1050 Max-Q:
100.7 fps
GeForce GTX 1050 Max-Q:
86.4 fps
GeForce GTX 1050 Max-Q:
69.4 fps
GeForce GTX 1050 Max-Q:
47.1 fps
GeForce GTX 1050 Max-Q:
81.3 fps
GeForce GTX 1050 Max-Q:
35.3 fps
GeForce GTX 1050 Max-Q:
22.5 fps
GeForce GTX 1050 Max-Q:
16.5 fps
GeForce GTX 1050 Max-Q:
11.6 fps
GeForce GTX 1050 Max-Q:
4.9 fps
Radeon Pro WX 3200:
42.4 fps
GeForce GTX 1050 Max-Q:
67.8 fps
Radeon Pro WX 3200:
12.5 fps
GeForce GTX 1050 Max-Q:
23 fps
Radeon Pro WX 3200:
8.3 fps
GeForce GTX 1050 Max-Q:
16.8 fps
GeForce GTX 1050 Max-Q:
10.5 fps
GeForce GTX 1050 Max-Q:
5.1 fps
Radeon Pro WX 3200:
59 fps
GeForce GTX 1050 Max-Q:
134 fps
Radeon Pro WX 3200:
33 fps
GeForce GTX 1050 Max-Q:
58 fps
Radeon Pro WX 3200:
25 fps
GeForce GTX 1050 Max-Q:
49 fps
Radeon Pro WX 3200:
15 fps
GeForce GTX 1050 Max-Q:
43 fps
GeForce GTX 1050 Max-Q:
27 fps
GeForce GTX 1050 Max-Q:
15 fps
Radeon Pro WX 3200:
55.5 fps
GeForce GTX 1050 Max-Q:
119.3 fps
Radeon Pro WX 3200:
15.3 fps
GeForce GTX 1050 Max-Q:
38.5 fps
Radeon Pro WX 3200:
9.9 fps
GeForce GTX 1050 Max-Q:
23.2 fps
GeForce GTX 1050 Max-Q:
16.9 fps
GeForce GTX 1050 Max-Q:
6.5 fps
GeForce GTX 1050 Max-Q:
3.3 fps
Radeon Pro WX 3200:
40.9 fps
GeForce GTX 1050 Max-Q:
69.5 fps
Radeon Pro WX 3200:
16.8 fps
GeForce GTX 1050 Max-Q:
31.1 fps
Radeon Pro WX 3200:
14.1 fps
GeForce GTX 1050 Max-Q:
26.6 fps
Radeon Pro WX 3200:
10 fps
GeForce GTX 1050 Max-Q:
26 fps
GeForce GTX 1050 Max-Q:
16.3 fps
GeForce GTX 1050 Max-Q:
4.9 fps
GeForce GTX 1050 Max-Q:
73.2 fps
GeForce GTX 1050 Max-Q:
45.8 fps
GeForce GTX 1050 Max-Q:
26.5 fps
GeForce GTX 1050 Max-Q:
14.1 fps
GeForce GTX 1050 Max-Q:
10.1 fps
GeForce GTX 1050 Max-Q:
6.1 fps
GeForce GTX 1050 Max-Q:
73 fps
GeForce GTX 1050 Max-Q:
34 fps
GeForce GTX 1050 Max-Q:
27 fps
GeForce GTX 1050 Max-Q:
19 fps
GeForce GTX 1050 Max-Q:
12 fps
GeForce GTX 1050 Max-Q:
6 fps
GeForce GTX 1050 Max-Q:
142.1 fps
GeForce GTX 1050 Max-Q:
45.7 fps
GeForce GTX 1050 Max-Q:
38.8 fps
GeForce GTX 1050 Max-Q:
21.8 fps
GeForce GTX 1050 Max-Q:
16.1 fps
GeForce GTX 1050 Max-Q:
8.8 fps
GeForce GTX 1050 Max-Q:
58.2 fps
GeForce GTX 1050 Max-Q:
29.9 fps
GeForce GTX 1050 Max-Q:
28.6 fps
GeForce GTX 1050 Max-Q:
23.5 fps
GeForce GTX 1050 Max-Q:
13.5 fps
GeForce GTX 1050 Max-Q:
6.9 fps
GeForce GTX 1050 Max-Q:
69 fps
GeForce GTX 1050 Max-Q:
39 fps
GeForce GTX 1050 Max-Q:
37 fps
GeForce GTX 1050 Max-Q:
34 fps
GeForce GTX 1050 Max-Q:
24 fps
GeForce GTX 1050 Max-Q:
12 fps
Radeon Pro WX 3200:
31.1 fps
GeForce GTX 1050 Max-Q:
52.1 fps
Radeon Pro WX 3200:
14 fps
GeForce GTX 1050 Max-Q:
24.9 fps
Radeon Pro WX 3200:
10 fps
GeForce GTX 1050 Max-Q:
18.7 fps
GeForce GTX 1050 Max-Q:
14.6 fps
GeForce GTX 1050 Max-Q:
11.4 fps
GeForce GTX 1050 Max-Q:
7.1 fps
Radeon Pro WX 3200:
65.9 fps
GeForce GTX 1050 Max-Q:
107.9 fps
Radeon Pro WX 3200:
24.3 fps
GeForce GTX 1050 Max-Q:
44.4 fps
Radeon Pro WX 3200:
15.1 fps
GeForce GTX 1050 Max-Q:
35.3 fps
Radeon Pro WX 3200:
13.2 fps
GeForce GTX 1050 Max-Q:
35.3 fps
GeForce GTX 1050 Max-Q:
24.8 fps
GeForce GTX 1050 Max-Q:
12.7 fps
GeForce GTX 1050 Max-Q:
33.6 fps
GeForce GTX 1050 Max-Q:
37.2 fps
GeForce GTX 1050 Max-Q:
31.5 fps
GeForce GTX 1050 Max-Q:
46.1 fps
GeForce GTX 1050 Max-Q:
39.7 fps
GeForce GTX 1050 Max-Q:
36.5 fps
GeForce GTX 1050 Max-Q:
183.8 fps
GeForce GTX 1050 Max-Q:
104.8 fps
GeForce GTX 1050 Max-Q:
64.7 fps
GeForce GTX 1050 Max-Q:
46.6 fps
GeForce GTX 1050 Max-Q:
31.5 fps
GeForce GTX 1050 Max-Q:
15.5 fps
GeForce GTX 1050 Max-Q:
56 fps
GeForce GTX 1050 Max-Q:
37 fps
GeForce GTX 1050 Max-Q:
31 fps
GeForce GTX 1050 Max-Q:
16 fps
GeForce GTX 1050 Max-Q:
10 fps
GeForce GTX 1050 Max-Q:
6 fps
GeForce GTX 1050 Max-Q:
96.5 fps
GeForce GTX 1050 Max-Q:
100.8 fps
GeForce GTX 1050 Max-Q:
44 57 ~ 51 fps
GeForce GTX 1050 Max-Q:
27 33 ~ 30 fps
GeForce GTX 1050 Max-Q:
25 26 ~ 26 fps
GeForce GTX 1050 Max-Q:
22 23 ~ 23 fps
GeForce GTX 1050 Max-Q:
16 fps
GeForce GTX 1050 Max-Q:
8 fps
GeForce GTX 1050 Max-Q:
104 fps
GeForce GTX 1050 Max-Q:
63 fps
GeForce GTX 1050 Max-Q:
47 fps
GeForce GTX 1050 Max-Q:
29 fps
GeForce GTX 1050 Max-Q:
13 fps
GeForce GTX 1050 Max-Q:
73.7 fps
GeForce GTX 1050 Max-Q:
32 fps
GeForce GTX 1050 Max-Q:
24 fps
GeForce GTX 1050 Max-Q:
20 fps
GeForce GTX 1050 Max-Q:
5.8 fps
GeForce GTX 1050 Max-Q:
42 fps
GeForce GTX 1050 Max-Q:
37 fps
GeForce GTX 1050 Max-Q:
33.4 fps
GeForce GTX 1050 Max-Q:
10.4 fps
Radeon Pro WX 3200:
43 fps
GeForce GTX 1050 Max-Q:
66 71 ~ 69 fps
Radeon Pro WX 3200:
20 fps
GeForce GTX 1050 Max-Q:
35 38 ~ 37 fps
Radeon Pro WX 3200:
18 fps
GeForce GTX 1050 Max-Q:
33 35 ~ 34 fps
Radeon Pro WX 3200:
17 fps
GeForce GTX 1050 Max-Q:
30 32 ~ 31 fps
GeForce GTX 1050 Max-Q:
22 fps
GeForce GTX 1050 Max-Q:
10 11 ~ 11 fps
GeForce GTX 1050 Max-Q:
429.1 fps
GeForce GTX 1050 Max-Q:
132.4 fps
GeForce GTX 1050 Max-Q:
51.4 fps
GeForce GTX 1050 Max-Q:
32.5 fps
GeForce GTX 1050 Max-Q:
16 fps
Radeon Pro WX 3200:
25 25.4 ~ 25 fps
GeForce GTX 1050 Max-Q:
88.8 fps
GeForce GTX 1050 Max-Q:
80.9 fps
GeForce GTX 1050 Max-Q:
65.1 fps
GeForce GTX 1050 Max-Q:
30.3 fps
GeForce GTX 1050 Max-Q:
82.1 fps
GeForce GTX 1050 Max-Q:
36.8 fps
GeForce GTX 1050 Max-Q:
29.5 fps
GeForce GTX 1050 Max-Q:
21.5 fps
GeForce GTX 1050 Max-Q:
6 fps
Radeon Pro WX 3200:
26.3 fps
GeForce GTX 1050 Max-Q:
56.9 fps
Radeon Pro WX 3200:
9.7 fps
GeForce GTX 1050 Max-Q:
29.3 fps
Radeon Pro WX 3200:
6.3 fps
GeForce GTX 1050 Max-Q:
20.6 fps
GeForce GTX 1050 Max-Q:
7.9 fps
GeForce GTX 1050 Max-Q:
142.8 fps
GeForce GTX 1050 Max-Q:
111.8 fps
GeForce GTX 1050 Max-Q:
49.4 fps
GeForce GTX 1050 Max-Q:
36.5 fps
GeForce GTX 1050 Max-Q:
9.3 fps
GeForce GTX 1050 Max-Q:
82.5 fps
GeForce GTX 1050 Max-Q:
56.5 fps
GeForce GTX 1050 Max-Q:
48.8 fps
GeForce GTX 1050 Max-Q:
32.7 fps
GeForce GTX 1050 Max-Q:
7.4 fps
GeForce GTX 1050 Max-Q:
144.8 fps
GeForce GTX 1050 Max-Q:
99.6 fps
GeForce GTX 1050 Max-Q:
46.7 fps
GeForce GTX 1050 Max-Q:
36.7 fps
GeForce GTX 1050 Max-Q:
16.1 fps
GeForce GTX 1050 Max-Q:
59 fps
GeForce GTX 1050 Max-Q:
40 fps
GeForce GTX 1050 Max-Q:
35 fps
GeForce GTX 1050 Max-Q:
28 fps
GeForce GTX 1050 Max-Q:
11 fps
GeForce GTX 1050 Max-Q:
82.2 fps
GeForce GTX 1050 Max-Q:
57.4 fps
GeForce GTX 1050 Max-Q:
51.6 fps
GeForce GTX 1050 Max-Q:
38.1 fps
GeForce GTX 1050 Max-Q:
13.5 fps
GeForce GTX 1050 Max-Q:
97 fps
GeForce GTX 1050 Max-Q:
44 fps
GeForce GTX 1050 Max-Q:
31 fps
GeForce GTX 1050 Max-Q:
24 fps
GeForce GTX 1050 Max-Q:
10 fps
GeForce GTX 1050 Max-Q:
254.7 fps
GeForce GTX 1050 Max-Q:
153.2 fps
100%
GeForce GTX 1070 SLI (Laptop):
330 [X] Aorus X9 Intel Core i7-7820HK @4.1GHz
GeForce GTX 1070 SLI (Laptop)
fps
39%
GeForce GTX 1050 Max-Q:
127.5 fps
100%
GeForce GTX 1070 SLI (Laptop):
310 [X] Aorus X9 Intel Core i7-7820HK @4.1GHz
GeForce GTX 1070 SLI (Laptop)
fps
41%
GeForce GTX 1050 Max-Q:
127 fps
100%
GeForce GTX 1070 SLI (Laptop):
187 [X] Aorus X9 Intel Core i7-7820HK @4.1GHz
GeForce GTX 1070 SLI (Laptop)
fps
30%
GeForce GTX 1050 Max-Q:
55.5 fps
100%
GeForce GTX 1070 SLI (Laptop):
88.6 [X] Aorus X9 Intel Core i7-7820HK @4.1GHz
GeForce GTX 1070 SLI (Laptop)
fps
100%
GeForce GTX 1070 SLI (Laptop):
53 [X] Aorus X9 Intel Core i7-7820HK @4.1GHz
GeForce GTX 1070 SLI (Laptop)
fps
100%
GeForce GTX 1070 SLI (Laptop):
25.8 [X] Aorus X9 Intel Core i7-7820HK @4.1GHz
GeForce GTX 1070 SLI (Laptop)
fps
100%
GeForce GTX 1070 SLI (Laptop):
132 [X] Aorus X9 Intel Core i7-7820HK @4.1GHz
GeForce GTX 1070 SLI (Laptop)
fps
100%
GeForce GTX 1070 SLI (Laptop):
89 [X] Aorus X9 Intel Core i7-7820HK @4.1GHz
GeForce GTX 1070 SLI (Laptop)
fps
100%
GeForce GTX 1070 SLI (Laptop):
42 [X] Aorus X9 Intel Core i7-7820HK @4.1GHz
GeForce GTX 1070 SLI (Laptop)
fps
100%
GeForce GTX 1070 SLI (Laptop):
102 [X] Aorus X9 Intel Core i7-7820HK @4.1GHz
GeForce GTX 1070 SLI (Laptop)
fps
50%
GeForce GTX 1050 Max-Q:
51.4 fps
100%
GeForce GTX 1070 SLI (Laptop):
93.3 [X] Aorus X9 Intel Core i7-7820HK @4.1GHz
GeForce GTX 1070 SLI (Laptop)
fps
36%
GeForce GTX 1050 Max-Q:
33.6 fps
100%
GeForce GTX 1070 SLI (Laptop):
37.1 [X] Aorus X9 Intel Core i7-7820HK @4.1GHz
GeForce GTX 1070 SLI (Laptop)
fps
30%
GeForce GTX 1050 Max-Q:
11.3 fps
GeForce GTX 1050 Max-Q:
136 fps
GeForce GTX 1050 Max-Q:
128 fps
GeForce GTX 1050 Max-Q:
120 fps
GeForce GTX 1050 Max-Q:
118 fps
GeForce GTX 1050 Max-Q:
55 fps
GeForce GTX 1050 Max-Q:
191.1 fps
GeForce GTX 1050 Max-Q:
88 fps
100%
GeForce GTX 1070 SLI (Laptop):
115 [X] Aorus X9 Intel Core i7-7820HK @4.1GHz
GeForce GTX 1070 SLI (Laptop)
fps
41%
GeForce GTX 1050 Max-Q:
47.1 fps
100%
GeForce GTX 1070 SLI (Laptop):
70.4 [X] Aorus X9 Intel Core i7-7820HK @4.1GHz
GeForce GTX 1070 SLI (Laptop)
fps
37%
GeForce GTX 1050 Max-Q:
26.2 fps
GeForce GTX 1050 Max-Q:
15.4 fps
GeForce GTX 1050 Max-Q:
240.3 fps
GeForce GTX 1050 Max-Q:
155.4 fps
100%
GeForce GTX 1070 SLI (Laptop):
219 [X] Aorus X9 Intel Core i7-7820HK @4.1GHz
GeForce GTX 1070 SLI (Laptop)
fps
45%
GeForce GTX 1050 Max-Q:
98.8 fps
100%
GeForce GTX 1070 SLI (Laptop):
141 [X] Aorus X9 Intel Core i7-7820HK @4.1GHz
GeForce GTX 1070 SLI (Laptop)
fps
26%
GeForce GTX 1050 Max-Q:
36.7 fps
100%
GeForce GTX 1070 SLI (Laptop):
140 [X] Aorus X9 Intel Core i7-7820HK @4.1GHz
GeForce GTX 1070 SLI (Laptop)
fps
100%
GeForce GTX 1070 SLI (Laptop):
137 [X] Aorus X9 Intel Core i7-7820HK @4.1GHz
GeForce GTX 1070 SLI (Laptop)
fps
100%
GeForce GTX 1070 SLI (Laptop):
79.1 [X] Aorus X9 Intel Core i7-7820HK @4.1GHz
GeForce GTX 1070 SLI (Laptop)
fps
GeForce GTX 1050 Max-Q:
80.6 fps
GeForce GTX 1050 Max-Q:
35.7 fps
100%
GeForce GTX 1070 SLI (Laptop):
112 [X] Aorus X9 Intel Core i7-7820HK @4.1GHz
GeForce GTX 1070 SLI (Laptop)
fps
29%
GeForce GTX 1050 Max-Q:
32.5 fps
100%
GeForce GTX 1070 SLI (Laptop):
68.8 [X] Aorus X9 Intel Core i7-7820HK @4.1GHz
GeForce GTX 1070 SLI (Laptop)
fps
25%
GeForce GTX 1050 Max-Q:
17.1 fps
100%
GeForce GTX 1070 SLI (Laptop):
53.1 [X] Aorus X9 Intel Core i7-7820HK @4.1GHz
GeForce GTX 1070 SLI (Laptop)
fps
20%
GeForce GTX 1050 Max-Q:
10.5 fps
GeForce GTX 1050 Max-Q:
52.7 53.5 ~ 53 fps
100%
GeForce GTX 1070 SLI (Laptop):
177 [X] Aorus X9 Intel Core i7-7820HK @4.1GHz
GeForce GTX 1070 SLI (Laptop)
fps
28%
GeForce GTX 1050 Max-Q:
49.8 49.8 ~ 50 fps
100%
GeForce GTX 1070 SLI (Laptop):
163 [X] Aorus X9 Intel Core i7-7820HK @4.1GHz
GeForce GTX 1070 SLI (Laptop)
fps
23%
GeForce GTX 1050 Max-Q:
38.1 38.2 ~ 38 fps
100%
GeForce GTX 1070 SLI (Laptop):
83.9 [X] Aorus X9 Intel Core i7-7820HK @4.1GHz
GeForce GTX 1070 SLI (Laptop)
fps
18%
GeForce GTX 1050 Max-Q:
14.7 15 ~ 15 fps
100%
GeForce GTX 1070 SLI (Laptop):
146 [X] Aorus X9 Intel Core i7-7820HK @4.1GHz
GeForce GTX 1070 SLI (Laptop)
fps
100%
GeForce GTX 1070 SLI (Laptop):
123 [X] Aorus X9 Intel Core i7-7820HK @4.1GHz
GeForce GTX 1070 SLI (Laptop)
fps
100%
GeForce GTX 1070 SLI (Laptop):
42 [X] Aorus X9 Intel Core i7-7820HK @4.1GHz
GeForce GTX 1070 SLI (Laptop)
fps
100%
GeForce GTX 1070 SLI (Laptop):
111 [X] Aorus X9 Intel Core i7-7820HK @4.1GHz
GeForce GTX 1070 SLI (Laptop)
fps
100%
GeForce GTX 1070 SLI (Laptop):
90.9 [X] Aorus X9 Intel Core i7-7820HK @4.1GHz
GeForce GTX 1070 SLI (Laptop)
fps
100%
GeForce GTX 1070 SLI (Laptop):
59 [X] Aorus X9 Intel Core i7-7820HK @4.1GHz
GeForce GTX 1070 SLI (Laptop)
fps
100%
GeForce GTX 1070 SLI (Laptop):
92.4 [X] Aorus X9 Intel Core i7-7820HK @4.1GHz
GeForce GTX 1070 SLI (Laptop)
fps
100%
GeForce GTX 1070 SLI (Laptop):
78.6 [X] Aorus X9 Intel Core i7-7820HK @4.1GHz
GeForce GTX 1070 SLI (Laptop)
fps
100%
GeForce GTX 1070 SLI (Laptop):
60 [X] Aorus X9 Intel Core i7-7820HK @4.1GHz
GeForce GTX 1070 SLI (Laptop)
fps
100%
GeForce GTX 1070 SLI (Laptop):
122 [X] Aorus X9 Intel Core i7-7820HK @4.1GHz
GeForce GTX 1070 SLI (Laptop)
fps
100%
GeForce GTX 1070 SLI (Laptop):
111 [X] Aorus X9 Intel Core i7-7820HK @4.1GHz
GeForce GTX 1070 SLI (Laptop)
fps
100%
GeForce GTX 1070 SLI (Laptop):
58.6 [X] Aorus X9 Intel Core i7-7820HK @4.1GHz
GeForce GTX 1070 SLI (Laptop)
fps
100%
GeForce GTX 1070 SLI (Laptop):
143 [X] Aorus X9 Intel Core i7-7820HK @4.1GHz
GeForce GTX 1070 SLI (Laptop)
fps
100%
GeForce GTX 1070 SLI (Laptop):
141 [X] Aorus X9 Intel Core i7-7820HK @4.1GHz
GeForce GTX 1070 SLI (Laptop)
fps
100%
GeForce GTX 1070 SLI (Laptop):
68.4 [X] Aorus X9 Intel Core i7-7820HK @4.1GHz
GeForce GTX 1070 SLI (Laptop)
fps
GeForce GTX 1050 Max-Q:
144.7 fps
GeForce GTX 1050 Max-Q:
89.2 fps
100%
GeForce GTX 1070 SLI (Laptop):
143 [X] Aorus X9 Intel Core i7-7820HK @4.1GHz
GeForce GTX 1070 SLI (Laptop)
fps
31%
GeForce GTX 1050 Max-Q:
45 fps
100%
GeForce GTX 1070 SLI (Laptop):
129 [X] Aorus X9 Intel Core i7-7820HK @4.1GHz
GeForce GTX 1070 SLI (Laptop)
fps
32%
GeForce GTX 1050 Max-Q:
41.3 fps
100%
GeForce GTX 1070 SLI (Laptop):
74.1 [X] Aorus X9 Intel Core i7-7820HK @4.1GHz
GeForce GTX 1070 SLI (Laptop)
fps
21%
GeForce GTX 1050 Max-Q:
15.9 fps
GeForce GTX 1050 Max-Q:
141 fps
GeForce GTX 1050 Max-Q:
82.7 fps
GeForce GTX 1050 Max-Q:
35 fps
GeForce GTX 1050 Max-Q:
28.6 fps
GeForce GTX 1050 Max-Q:
23 fps
100%
GeForce GTX 1070 SLI (Laptop):
54 fps
100%
GeForce GTX 1070 SLI (Laptop):
21.3 fps
100%
GeForce GTX 1070 SLI (Laptop):
293 fps
100%
GeForce GTX 1070 SLI (Laptop):
286 fps
100%
GeForce GTX 1070 SLI (Laptop):
174 fps
GeForce GTX 1050 Max-Q:
70.5 71.5 ~ 71 fps
GeForce GTX 1050 Max-Q:
52.6 54.8 ~ 54 fps
100%
GeForce GTX 1070 SLI (Laptop):
73.9 fps
39%
GeForce GTX 1050 Max-Q:
28.3 30.1 ~ 29 fps
100%
GeForce GTX 1070 SLI (Laptop):
56.1 fps
37%
GeForce GTX 1050 Max-Q:
20.3 21.4 ~ 21 fps
GeForce GTX 1050 Max-Q:
9 9.6 ~ 9 fps
100%
GeForce GTX 1070 SLI (Laptop):
146 fps
100%
GeForce GTX 1070 SLI (Laptop):
77.4 fps
100%
GeForce GTX 1070 SLI (Laptop):
74.7 fps
100%
GeForce GTX 1070 SLI (Laptop):
102 fps
100%
GeForce GTX 1070 SLI (Laptop):
97.4 fps
100%
GeForce GTX 1070 SLI (Laptop):
53.9 fps
GeForce GTX 1050 Max-Q:
256.9 fps
GeForce GTX 1050 Max-Q:
160 fps
100%
GeForce GTX 1070 SLI (Laptop):
294 fps
27%
GeForce GTX 1050 Max-Q:
80.5 fps
100%
GeForce GTX 1070 SLI (Laptop):
293 fps
17%
GeForce GTX 1050 Max-Q:
48.9 fps
100%
GeForce GTX 1070 SLI (Laptop):
177 fps
15%
GeForce GTX 1050 Max-Q:
26 fps
100%
GeForce GTX 1070 SLI (Laptop):
158 fps
100%
GeForce GTX 1070 SLI (Laptop):
152 fps
100%
GeForce GTX 1070 SLI (Laptop):
74.1 fps
GeForce GTX 1050 Max-Q:
53.8 fps
GeForce GTX 1050 Max-Q:
33.5 fps
GeForce GTX 1050 Max-Q:
29.1 fps
GeForce GTX 1050 Max-Q:
18.9 fps
100%
GeForce GTX 1070 SLI (Laptop):
99.3 fps
100%
GeForce GTX 1070 SLI (Laptop):
85.7 fps
100%
GeForce GTX 1070 SLI (Laptop):
84 fps
GeForce GTX 1050 Max-Q:
109.9 fps
GeForce GTX 1050 Max-Q:
69.8 fps
100%
GeForce GTX 1070 SLI (Laptop):
128 fps
25%
GeForce GTX 1050 Max-Q:
32.3 fps
100%
GeForce GTX 1070 SLI (Laptop):
113 fps
22%
GeForce GTX 1050 Max-Q:
24.8 fps
100%
GeForce GTX 1070 SLI (Laptop):
67.4 fps
16%
GeForce GTX 1050 Max-Q:
10.9 fps
100%
GeForce GTX 1070 SLI (Laptop):
78 fps
100%
GeForce GTX 1070 SLI (Laptop):
72 fps
100%
GeForce GTX 1070 SLI (Laptop):
69 fps
100%
GeForce GTX 1070 SLI (Laptop):
103 fps
100%
GeForce GTX 1070 SLI (Laptop):
82.3 fps
100%
GeForce GTX 1070 SLI (Laptop):
53.1 fps
Radeon Pro WX 3200:
50.6 fps
GeForce GTX 1050 Max-Q:
98 105.5 ~ 102 fps
Radeon Pro WX 3200:
36.2 fps
GeForce GTX 1050 Max-Q:
41.4 56 62 ~ 53 fps
100%
GeForce GTX 1070 SLI (Laptop):
80.9 fps
23%
Radeon Pro WX 3200:
18.5 fps
100%
GeForce GTX 1070 SLI (Laptop):
79.8 fps
100%
GeForce GTX 1070 SLI (Laptop):
67.7 fps
19%
GeForce GTX 1050 Max-Q:
12.9 fps
GeForce GTX 1050 Max-Q:
108 170.3 ~ 139 fps
100%
GeForce GTX 1070 SLI (Laptop):
176 fps
42%
GeForce GTX 1050 Max-Q:
67.5 80.4 ~ 74 fps
100%
GeForce GTX 1070 SLI (Laptop):
160 fps
41%
GeForce GTX 1050 Max-Q:
62.8 67 ~ 65 fps
100%
GeForce GTX 1070 SLI (Laptop):
60.7 fps
40%
GeForce GTX 1050 Max-Q:
22.1 26.1 ~ 24 fps
100%
GeForce GTX 1070 SLI (Laptop):
129 fps
100%
GeForce GTX 1070 SLI (Laptop):
115 fps
100%
GeForce GTX 1070 SLI (Laptop):
198 fps
100%
GeForce GTX 1070 SLI (Laptop):
196 fps
100%
GeForce GTX 1070 SLI (Laptop):
106 fps
100%
GeForce GTX 1070 SLI (Laptop):
87.7 fps
100%
GeForce GTX 1070 SLI (Laptop):
75.3 fps
100%
GeForce GTX 1070 SLI (Laptop):
74.1 fps
100%
GeForce GTX 1070 SLI (Laptop):
141 fps
100%
GeForce GTX 1070 SLI (Laptop):
137 fps
100%
GeForce GTX 1070 SLI (Laptop):
82.3 fps
100%
GeForce GTX 1070 SLI (Laptop):
140 fps
100%
GeForce GTX 1070 SLI (Laptop):
121 fps
100%
GeForce GTX 1070 SLI (Laptop):
87.9 fps
100%
GeForce GTX 1070 SLI (Laptop):
111 fps
100%
GeForce GTX 1070 SLI (Laptop):
49.8 fps
100%
GeForce GTX 1070 SLI (Laptop):
54.8 fps
GeForce GTX 1050 Max-Q:
174.8 fps
GeForce GTX 1050 Max-Q:
140.9 fps
GeForce GTX 1050 Max-Q:
109.3 fps
GeForce GTX 1050 Max-Q:
83.3 fps
GeForce GTX 1050 Max-Q:
26.1 fps
100%
GeForce GTX 1070 SLI (Laptop):
265 fps
100%
GeForce GTX 1070 SLI (Laptop):
262 fps
Radeon Pro WX 3200:
98 103 ~ 101 fps
GeForce GTX 1050 Max-Q:
149.5 fps
Radeon Pro WX 3200:
86 87 ~ 87 fps
GeForce GTX 1050 Max-Q:
134.1 fps
Radeon Pro WX 3200:
48 49.1 ~ 49 fps
GeForce GTX 1050 Max-Q:
115.5 fps
Radeon Pro WX 3200:
24.7 45 ~ 35 fps
GeForce GTX 1050 Max-Q:
104.1 fps
Radeon Pro WX 3200:
9.4 fps
GeForce GTX 1050 Max-Q:
37.1 fps
100%
GeForce GTX 1070 SLI (Laptop):
134 fps
100%
GeForce GTX 1070 SLI (Laptop):
68 [X] Saelic Vici G781D Intel Core i7-6700K 4GHz
GeForce GTX 1070 SLI (Laptop)
89 ~ 79 fps
100%
GeForce GTX 1070 SLI (Laptop):
48 fps
Radeon Pro WX 3200:
58.1 fps
100%
GeForce GTX 1070 SLI (Laptop):
167 [X] Aorus X9 Intel Core i7-7820HK @4.1GHz
GeForce GTX 1070 SLI (Laptop)
169 ~ 168 fps
9%
Radeon Pro WX 3200:
12.3 18 ~ 15 fps
22%
GeForce GTX 1050 Max-Q:
34 34.5 41 ~ 37 fps
100%
GeForce GTX 1070 SLI (Laptop):
81.4 [X] Saelic Vici G781D Intel Core i7-6700K 4GHz
GeForce GTX 1070 SLI (Laptop)
99.9 [X] Aorus X9 Intel Core i7-7820HK @4.1GHz
GeForce GTX 1070 SLI (Laptop)
103 ~ 95 fps
11%
Radeon Pro WX 3200:
9.4 11.2 ~ 10 fps
100%
GeForce GTX 1070 SLI (Laptop):
69.3 [X] Aorus X9 Intel Core i7-7820HK @4.1GHz
GeForce GTX 1070 SLI (Laptop)
74.6 ~ 72 fps
7%
Radeon Pro WX 3200:
5.2 fps
18%
GeForce GTX 1050 Max-Q:
12 13.1 ~ 13 fps
100%
GeForce GTX 1070 SLI (Laptop):
170 fps
100%
GeForce GTX 1070 SLI (Laptop):
168 fps
100%
GeForce GTX 1070 SLI (Laptop):
163 fps
GeForce GTX 1050 Max-Q:
61.8 62.1 ~ 62 fps
GeForce GTX 1050 Max-Q:
27 27.7 ~ 27 fps
GeForce GTX 1050 Max-Q:
26.1 29.1 ~ 28 fps
100%
GeForce GTX 1070 SLI (Laptop):
159 fps
100%
GeForce GTX 1070 SLI (Laptop):
138 fps
100%
GeForce GTX 1070 SLI (Laptop):
199 fps
100%
GeForce GTX 1070 SLI (Laptop):
190 fps
GeForce GTX 1050 Max-Q:
106 fps
Radeon Pro WX 3200:
36.4 fps
GeForce GTX 1050 Max-Q:
56.5 76 ~ 66 fps
Radeon Pro WX 3200:
34.9 fps
GeForce GTX 1050 Max-Q:
57.2 66 ~ 62 fps
100%
GeForce GTX 1070 SLI (Laptop):
114.6 [X] Saelic Vici G781D Intel Core i7-6700K 4GHz
GeForce GTX 1070 SLI (Laptop)
fps
17%
Radeon Pro WX 3200:
19.9 fps
33%
GeForce GTX 1050 Max-Q:
38 38.8 ~ 38 fps
100%
GeForce GTX 1070 SLI (Laptop):
105.3 [X] Saelic Vici G781D Intel Core i7-6700K 4GHz
GeForce GTX 1070 SLI (Laptop)
fps
GeForce GTX 1050 Max-Q:
79.7 fps
GeForce GTX 1050 Max-Q:
71.8 fps
GeForce GTX 1050 Max-Q:
48.7 fps
GeForce GTX 1050 Max-Q:
21.9 fps
Radeon Pro WX 3200:
186.6 fps
Radeon Pro WX 3200:
90.4 fps
100%
GeForce GTX 1070 SLI (Laptop):
198.4 [X] Saelic Vici G781D Intel Core i7-6700K 4GHz
GeForce GTX 1070 SLI (Laptop)
fps
15%
Radeon Pro WX 3200:
29.2 30 ~ 30 fps
Radeon Pro WX 3200:
184.6 fps
GeForce GTX 1050 Max-Q:
333.8 fps
Radeon Pro WX 3200:
98.5 fps
GeForce GTX 1050 Max-Q:
216.6 fps
Radeon Pro WX 3200:
71.8 fps
GeForce GTX 1050 Max-Q:
157.8 fps
Radeon Pro WX 3200:
35 fps
GeForce GTX 1050 Max-Q:
73.8 fps
GeForce GTX 1050 Max-Q:
316 fps
GeForce GTX 1050 Max-Q:
296.3 fps
GeForce GTX 1050 Max-Q:
233.3 fps
GeForce GTX 1050 Max-Q:
143.8 fps
GeForce GTX 1050 Max-Q:
93.5 fps
GeForce GTX 1050 Max-Q:
53.4 fps
100%
GeForce GTX 1070 SLI (Laptop):
217.9 [X] Saelic Vici G781D Intel Core i7-6700K 4GHz
GeForce GTX 1070 SLI (Laptop)
fps
Average Gaming NVIDIA GeForce GTX 1070 SLI (Laptop) → 100% Average Gaming 30-70 fps → 100%
Average Gaming AMD Radeon Pro WX 3200 → 14% Average Gaming NVIDIA GeForce GTX 1050 Max-Q → 30% Average Gaming 30-70 fps → 32%
 Deutsch
 English
 Español
 Français
 Italiano
 Nederlands
 Polski
 Português
 Русский
 Türkçe
 Svenska
 Chinese
 Magyar