Notebookcheck Logo

NVIDIA GeForce GTX 1050 Ti Max-Q vs Nvidia RTX A2000

NVIDIA GeForce GTX 1050 Ti Max-Q

► remove from comparison NVIDIA GeForce GTX 1050 Ti Max-Q

Die Nvidia GeForce GTX 1050 Ti mit Max-Q Design ist eine Mittelklasse-GPU basierend auf der Pascal-Architektur und wurde im Januar 2018 vorgestellt. Anders als die schnelleren Modelle basiert die GTX 1050 Ti auf dem GP107-Chip, der im 14-nm-Verfahren bei Samsung hergestellt wird.

Im Vergleich zur normalen GTX 1050 Ti gibt es noch weitere Unterschiede als den Takt. Der Treiber wurde auf Effizienz (und nicht Leistung) optimiert (nur für die Max-Q Modelle), optimierte Spannungswandler für 1V Betreib, high-end Kühlungsmethoden und eine 40 dB Grenze für die Lüfterlautstärke (mit Taktanpasssungen um dies jederzeit zu gewährleisten) zeichnen die Max-Q Variante aus.

Features

Der GP107-Chip wird in einem 14-nm-FinFET-Prozess bei Samsung gefertigt und bietet eine Reihe neuer Features, unter anderem Support für DisplayPort 1.4 (ready), HDMI 2.0b, HDR, Simultaneous Multi-Projection (SMP) sowie verbessertes H.265 Video De- und Encoding (PlayReady 3.0). Eine genaue Auflistung der Verbesserungen und Features der neuen Pascal Desktop-GPUs finden Sie in unserem Pascal-Architektur-Artikel.

Performance

Die exakte Performance der GeForce GTX 1050 Ti Max-Q kann sich in Abhängigkeit von der Kühlung des jeweiligen Notebooks stark unterscheiden. Im Optimalfall ist die Leistung etwa 10 bis 15 % unterhalb der normalen GTX 1050 Ti angesiedelt. Dadurch eignet sich die Grafikkarte am besten für Full HD (1920 x 1080) bei hoher aber nicht maximaler Detailstufe.

Leistungsaufnahme

Die Leistungsaufnahme der GeForce GTX 1050 Ti Max-Q ist von Nvidia mit 40 - 46 Watt spezifiziert und damit deutlich unterhalb der normalen Notebook GTX 1050 Ti (64 Watt). Selbst die normale GTX 1050 ist mit 53 Watt höher spezifziert. Damit eignet sich die Grafikkarte auch für dünne und leichte 14-Zoll Notebooks.

Nvidia RTX A2000

► remove from comparison NVIDIA RTX A2000

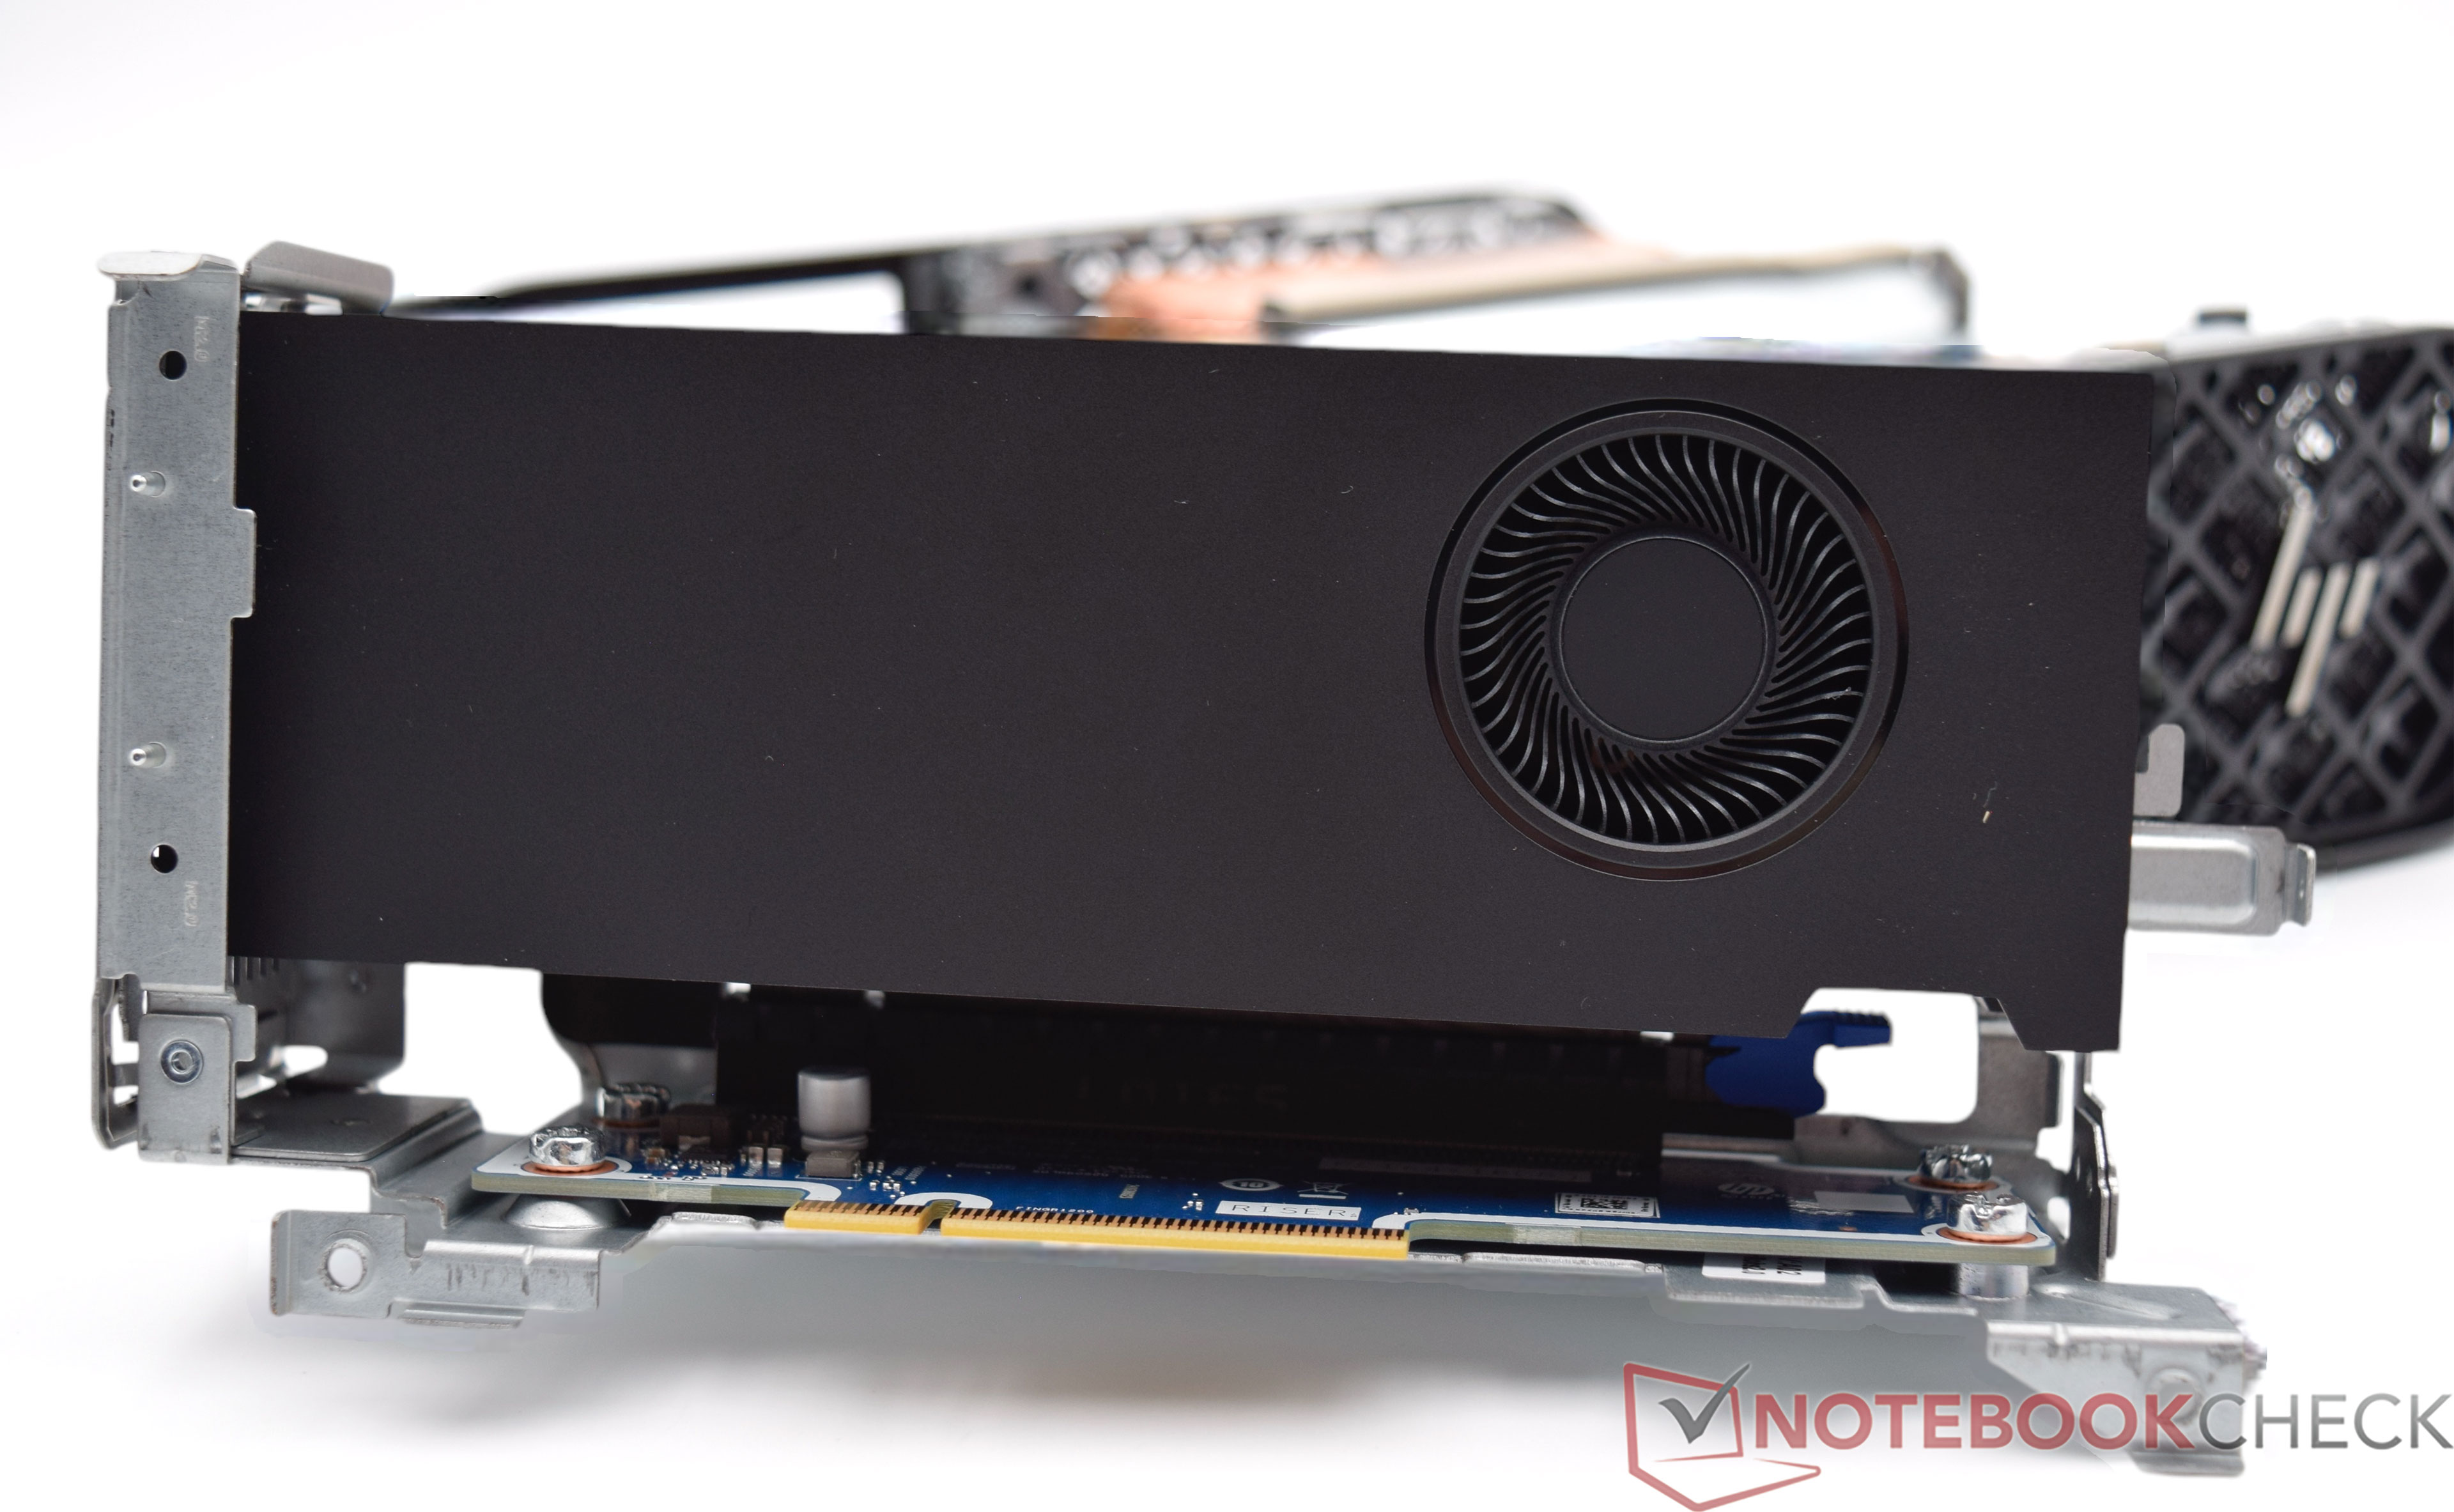
Die Nvidia RTX A2000 Desktop GPU ist eine professionelle Grafikkarte für kleine Workstation-PCs. Sie basiert auf dem GA106 Grafikchip, welcher unter anderem bei den Consumer-Grafikkarte GeForce RTX 3050 oder GeForce RTX 3060 zum Einsatz kommt. Der GA106 arbeitet jedoch nur mit 3.328 aktiven Shadereinheiten, sowie 26 RT-Kernen und 104 Tensor-Einheiten. Der VRAM umfasst 12-GB-GDDR6 und kommuniziert über ein 192-bit-Speicherinterface. Daraus ergibt sich eine Speicherbandbreite von 288 GB/s.

Die professionellen Grafikkarten von Nvidia bieten zertifizierte Treiber, welche auf Stabiltität und Performance bei professionellen Anwendungen (CAD-, DCC-, Medizin-, Prospektions-, Visualisierungsanwendungen) optimiert sind. Daraus ergeben sich viele Vorteile gegenüber den Consumer-Grafikkarten.

Kompaktes Design und Flexibilität:

Die RTX A2000 ist im Low-Profile-Formfaktor ausgeführt, was sie ideal für kleinere Workstations oder Systeme macht, bei denen Platz eine begrenzte Ressource ist. Trotz ihrer kompakten Größe bietet die Nvidia RTX A2000 eine beachtliche Rechenleistung.

Die Grafikkarte eignet sich hervorragend für 3D-Modelle, CAD-Anwendungen, Videobearbeitung und visuelle Effekte, bei denen hohe Präzision und Geschwindigkeit im Vordergrund stehen. Dank der Kombination aus CUDA-, Tensor- und Raytracing-Kernen bietet die Nvidia RTX A2000 erhebliche Leistungssteigerungen in den Bereichen Echtzeit-Rendering und KI-gestützte Bildverarbeitung.

Energieeffizienz und Leistungsaufnahme:

Mit einer TDP von nur 70 Watt ist die Nvidia RTX A2000 eine der energieeffizientesten Workstation-GPUs auf dem Markt. Diese Effizienz ermöglicht es, in Workflows, die intensive Grafikverarbeitung erfordern, produktiver zu arbeiten, ohne die Systemleistung zu beeinträchtigen oder übermäßig Energie zu benötigen.

Zusammenfassend ist die NVIDIA RTX A2000 eine kompakte, leistungsstarke und energieeffiziente Lösung für professionelle Anwender.

NVIDIA GeForce GTX 1050 Ti Max-QNvidia RTX A2000
RTX A Serie
GeForce GTX 1080 Ti compare 3584 @ 1.48 - 1.6 GHz352 Bit @ 11000 MHz
GeForce GTX 1080 SLI (Laptop) compare 5120 @ 1.56 - 1.73 GHz256 Bit @ 10000 MHz
GeForce GTX 1070 SLI (Desktop) compare 3840 @ 1.51 - 1.68 GHz256 Bit @ 8000 MHz
GeForce GTX 1070 SLI (Laptop) compare 4096 @ 1.44 - 1.65 GHz256 Bit @ 8000 MHz
GeForce GTX 1080 (Desktop) compare 2560 @ 1.61 - 1.73 GHz256 Bit @ 10000 MHz
GeForce GTX 1080 Mobile compare 2560 @ 1.57 - 1.73 GHz256 Bit @ 10000 MHz
GeForce GTX 1070 Ti (Desktop) compare 2432 @ 1.61 - 1.68 GHz256 Bit @ 8000 MHz
GeForce GTX 1070 (Desktop) compare 1920 @ 1.51 - 1.68 GHz256 Bit @ 8000 MHz
GeForce GTX 1080 Max-Q compare 2560 @ 1.1 - 1.28 GHz256 Bit @ 10000 MHz
GeForce GTX 1070 Mobile compare 2048 @ 1.44 - 1.65 GHz256 Bit @ 8000 MHz
GeForce GTX 1070 Max-Q compare 2048 @ 1.1 - 1.27 GHz256 Bit @ 8000 MHz
GeForce GTX 1060 (Desktop) compare 1280 @ 1.51 - 1.71 GHz192 Bit @ 8000 MHz
GeForce GTX 1060 Mobile compare 1280 @ 1.4 - 1.67 GHz192 Bit @ 8000 MHz
GeForce GTX 1060 Max-Q compare 1280 @ 1.06 - 1.34 GHz192 Bit @ 8000 MHz
GeForce GTX 1050 Ti Mobile compare 768 @ 1.49 - 1.62 GHz128 Bit @ 7000 MHz
GeForce GTX 1050 Ti (Desktop) compare 768 @ 1.29 - 1.39 GHz128 Bit @ 7008 MHz
GeForce GTX 1050 Ti Max-Q 768 @ 1.15 - 1.29 GHz128 Bit @ 7000 MHz
GeForce GTX 1050 (Desktop) compare 640 @ 1.35 - 1.46 GHz128 Bit @ 7008 MHz
GeForce GTX 1050 Mobile compare 640 @ 1.35 - 1.49 GHz128 Bit @ 7000 MHz
GeForce GTX 1050 Max-Q compare 640 @ 1 - 1.14 GHz128 Bit @ 7000 MHz
GeForce GT 1030 (Desktop) compare 384 @ 1.23 - 1.67 GHz64 Bit @ 6000 MHz
RTX A5500 Laptop GPU compare 7424 256 Bit @ 16000 MHz
RTX A4500 Laptop GPU compare 5888 @ 0.93 - 1.5 GHz256 Bit @ 16000 MHz
RTX A5000 Laptop GPU compare 6144 @ 1.22 - 1.77 GHz256 Bit @ 14000 MHz
RTX A4000 Laptop GPU compare 5120 @ 0.78 - 1.68 GHz256 Bit @ 12000 MHz
RTX A3000 Laptop GPU compare 4096 @ 1.08 - 1.56 GHz192 Bit @ 14000 MHz
RTX A2000 3328 @ 0.56 - 1.2 GHz192 Bit @ 12000 MHz
RTX A2000 Laptop GPU compare 2560 @ 0.89 - 1.69 GHz128 Bit @ 14000 MHz
RTX A1000 Laptop GPU compare 2048 128 Bit @ 14000 MHz
RTX A500 Laptop GPU compare 2048 64 Bit @ 14000 MHz
CodenameN17P-G1 Max-QGA106
ArchitekturPascalQuadro Ampere
Pipelines768 - unified3328 - unified
Kerntakt1151 – 1290 - 1290 – 1417 (Boost) MHz562 - 1200 (Boost) MHz
Speichertakt7000 MHz12000 effective = 1500 MHz
Speicherbandbreite128 Bit192 Bit
SpeichertypGDDR5GDDR6
Max. Speichergröße4 GB12 GB
Shared Memoryneinnein
APIDirectX 12_1, OpenGL 4.5DirectX 12 Ultimate (12_2), Shader 6.8, OpenGL 4.6, OpenCL 3.0, Vulkan 1.3
Stromverbrauch40 - 46 Watt70 Watt
Herstellungsprozess16 nm8 nm
FeaturesMulti-Projection, VR Ready, G-SYNC, Vulkan, Multi Monitor4x DisplayPort 1.4a, PCIe 4.0 x16
Notebookgrößemittel (15.4" z.B.)
Erscheinungsdatum03.01.2018 23.11.2021
Herstellerseitewww.nvidia.com
TMUs104
ROPs48
Raytracing Cores26
Tensor / AI Cores104
Theoretical Performance7987 TFLOPS FP16, 7987 TFLOPS FP32, 0.1248 TFLOPS FP64
Memory Bandwidth288 GB/s
Transistors12 Billion
Die Size 276 mm²
PCIe4.0 x16
Displays4 Displays (max.), DisplayPort 1.4a

Benchmarks

Performance Rating - 3DMark 11 + Fire Strike + Time Spy - GeForce GTX 1050 Ti Max-Q
3.2 pt (10%)
Performance Rating - 3DMark 11 + Fire Strike + Time Spy - RTX A2000
6.6 pt (20%)
3DMark - 3DMark Time Spy Score
min: 2361     avg: 2453     median: 2485 (7%)     max: 2513 Points
6282 Points (18%)
3DMark - 3DMark Time Spy Graphics
min: 2196     avg: 2245     median: 2261 (6%)     max: 2278 Points
5675 Points (15%)
3DMark - 3DMark Ice Storm Unlimited Graphics
324705 Points (33%)
561627 Points (57%)
3DMark - 3DMark Ice Storm Extreme Graphics
39641 Points (5%)
310737 Points (39%)
3DMark - 3DMark Cloud Gate Score
min: 20755     avg: 24100     median: 24021 (26%)     max: 28253 Points
56330 Points (60%)
3DMark - 3DMark Cloud Gate Graphics
min: 41871     avg: 46017     median: 46952 (12%)     max: 50801 Points
94407 Points (25%)
3DMark - 3DMark Fire Strike Standard Score
min: 6175     avg: 6548     median: 6688 (12%)     max: 6753 Points
14566 Points (26%)
3DMark - 3DMark Fire Strike Standard Graphics
min: 6957     avg: 7281     median: 7324 (8%)     max: 7428 Points
14934 Points (17%)
3DMark - 3DMark Ice Storm Graphics
min: 41029     avg: 73224     median: 60442 (7%)     max: 118202 Points
369883 Points (43%)
3DMark - 3DMark Night Raid
48115 Points (45%)
3DMark - 3DMark Night Raid Graphics Score
68223 Points (26%)
3DMark 11 - 3DM11 Performance Score
min: 8250     avg: 8936     median: 9106 (13%)     max: 9414 Points
20964 Points (29%)
3DMark 11 - 3DM11 Performance GPU
min: 8317     avg: 8781     median: 8752 (8%)     max: 9079 Points
19978 Points (17%)
3DMark Vantage
3DM Vant. Perf. total + NVIDIA GeForce GTX 1050 Ti Max-Q
3DMark Vantage - 3DM Vant. Perf. total
min: 24827     avg: 29504     median: 29503.5 (9%)     max: 34180 Points
3DM Vant. Perf. total + Nvidia RTX A2000
76281 Points (22%)
3DM Vant. Perf. GPU no PhysX + NVIDIA GeForce GTX 1050 Ti Max-Q
3DMark Vantage - 3DM Vant. Perf. GPU no PhysX
min: 25707     avg: 29448     median: 29448 (16%)     max: 33189 Points
3DM Vant. Perf. GPU no PhysX + Nvidia RTX A2000
71338 Points (39%)
3DMark 05 - 3DMark 05 - Standard
63697 Points (70%)
3DMark 06 3DMark 06 - Standard 1280x1024 + NVIDIA GeForce GTX 1050 Ti Max-Q
3DMark 06
min: 26796     avg: 28797     median: 28797 (38%)     max: 30798 Points
3DMark 06 - Standard 1280x1024 + Nvidia RTX A2000
43178 Points (56%)
3DMark 06 - Standard 1024x768 + NVIDIA GeForce GTX 1050 Ti Max-Q
3DMark 06
34786 Points (45%)
Unigine Valley 1.0 - Unigine Valley 1.0 DX
40.1 fps (12%)
72.1 fps (22%)
Unigine Heaven 2.1 - Heaven 2.1 high
86 fps (16%)
Blender - Blender 3.3 Classroom CUDA *
70 Seconds (10%)
Blender - Blender 3.3 Classroom OPTIX *
37 Seconds (14%)
SPECviewperf 12
specvp12 sw-03 + Nvidia RTX A2000
SPECviewperf 12 - specvp12 sw-03
135 fps (33%)
specvp12 snx-02 + Nvidia RTX A2000
SPECviewperf 12 - specvp12 snx-02
125 fps (18%)
specvp12 showcase-01 + Nvidia RTX A2000
SPECviewperf 12 - specvp12 showcase-01
79 fps (17%)
specvp12 mediacal-01 + Nvidia RTX A2000
SPECviewperf 12 - specvp12 mediacal-01
48 fps (12%)
specvp12 maya-04 + Nvidia RTX A2000
SPECviewperf 12 - specvp12 maya-04
137 fps (37%)
specvp12 energy-01 + Nvidia RTX A2000
SPECviewperf 12 - specvp12 energy-01
10.2 fps (9%)
specvp12 creo-01 + Nvidia RTX A2000
SPECviewperf 12 - specvp12 creo-01
117 fps (47%)
specvp12 catia-04 + Nvidia RTX A2000
SPECviewperf 12 - specvp12 catia-04
129 fps (21%)
specvp12 3dsmax-05 + Nvidia RTX A2000
SPECviewperf 12 - specvp12 3dsmax-05
162 fps (28%)
SPECviewperf 13 specvp13 sw-04 + Nvidia RTX A2000
SPECviewperf 13 - specvp13 sw-04
138 fps (37%)
specvp13 snx-03 + Nvidia RTX A2000
SPECviewperf 13 - specvp13 snx-03
239 fps (27%)
specvp13 showcase-02 + Nvidia RTX A2000
SPECviewperf 13 - specvp13 showcase-02
79.2 fps (17%)
specvp13 medical-02 + Nvidia RTX A2000
SPECviewperf 13 - specvp13 medical-02
119 fps (25%)
specvp13 maya-05 + Nvidia RTX A2000
SPECviewperf 13 - specvp13 maya-05
221 fps (25%)
specvp13 energy-02 + Nvidia RTX A2000
SPECviewperf 13 - specvp13 energy-02
32.9 fps (11%)
specvp13 creo-02 + Nvidia RTX A2000
SPECviewperf 13 - specvp13 creo-02
217 fps (32%)
specvp13 3dsmax-06 + Nvidia RTX A2000
SPECviewperf 13 - specvp13 3dsmax-06
162 fps (28%)
SPECviewperf 2020 specvp2020 medical-03 1080p + Nvidia RTX A2000
SPECviewperf 2020 - specvp2020 medical-03 1080p
68.8 fps (49%)
specvp2020 maya-06 1080p + Nvidia RTX A2000
SPECviewperf 2020 - specvp2020 maya-06 1080p
271 fps (30%)
specvp2020 energy-03 1080p + Nvidia RTX A2000
SPECviewperf 2020 - specvp2020 energy-03 1080p
33.6 fps (22%)
specvp2020 creo-03 1080p + Nvidia RTX A2000
SPECviewperf 2020 - specvp2020 creo-03 1080p
112 fps (55%)
specvp2020 catia-06 1080p + Nvidia RTX A2000
SPECviewperf 2020 - specvp2020 catia-06 1080p
64 fps (39%)
specvp2020 3dsmax-07 1080p + Nvidia RTX A2000
SPECviewperf 2020 - specvp2020 3dsmax-07 1080p
79.1 fps (25%)
specvp2020 snx-04 4k + Nvidia RTX A2000
SPECviewperf 2020 - specvp2020 snx-04 4k
159 fps (16%)
specvp2020 medical-03 4k + Nvidia RTX A2000
SPECviewperf 2020 - specvp2020 medical-03 4k
24.2 fps (23%)
specvp2020 maya-06 4k + Nvidia RTX A2000
SPECviewperf 2020 - specvp2020 maya-06 4k
126 fps (21%)
specvp2020 energy-03 4k + Nvidia RTX A2000
SPECviewperf 2020 - specvp2020 energy-03 4k
15.8 fps (3%)
specvp2020 creo-03 4k + Nvidia RTX A2000
SPECviewperf 2020 - specvp2020 creo-03 4k
75.1 fps (36%)
specvp2020 catia-06 4k + Nvidia RTX A2000
SPECviewperf 2020 - specvp2020 catia-06 4k
38.8 fps (25%)
specvp2020 3dsmax-07 4k + Nvidia RTX A2000
SPECviewperf 2020 - specvp2020 3dsmax-07 4k
49.8 fps (21%)
Cinebench R10 Cinebench R10 Shading (32bit) + NVIDIA GeForce GTX 1050 Ti Max-Q
Cinebench R10 - Cinebench R10 Shading (32bit)
min: 4597     avg: 5340     median: 4972 (4%)     max: 6451 Points
Cinebench R10 Shading (32bit) + Nvidia RTX A2000
6827 Points (5%)
Cinebench R11.5 Cinebench R11.5 OpenGL 64 Bit + NVIDIA GeForce GTX 1050 Ti Max-Q
Cinebench R11.5 - Cinebench R11.5 OpenGL 64 Bit
min: 66.9     avg: 71.7     median: 71.7 (24%)     max: 76.5 fps
Cinebench R11.5 OpenGL 64 Bit + Nvidia RTX A2000
303.9 fps (100%)
Cinebench R15
Cinebench R15 OpenGL 64 Bit + NVIDIA GeForce GTX 1050 Ti Max-Q
Cinebench R15 - Cinebench R15 OpenGL 64 Bit
min: 92.1     avg: 105.4     median: 102 (6%)     max: 120.7 fps
Cinebench R15 OpenGL 64 Bit + Nvidia RTX A2000
371.8 fps (22%)
Cinebench R15 OpenGL Ref. Match 64 Bit + NVIDIA GeForce GTX 1050 Ti Max-Q
Cinebench R15 - Cinebench R15 OpenGL Ref. Match 64 Bit
99.6 % (100%)
Cinebench R15 OpenGL Ref. Match 64 Bit + Nvidia RTX A2000
99.6 % (100%)
GFXBench - GFXBench 5.0 Aztec Ruins High Tier Offscreen
49.5 fps (9%)
GFXBench - GFXBench 5.0 Aztec Ruins Normal Tier Offscreen
119.1 fps (9%)
GFXBench - GFXBench Car Chase Offscreen
min: 108.8     avg: 124.2     median: 124.2 (14%)     max: 139.5 fps
GFXBench 3.1 - GFXBench Manhattan ES 3.1 Offscreen
min: 168     avg: 184.9     median: 184.9 (4%)     max: 201.7 fps
GFXBench 3.0 - GFXBench 3.0 Manhattan Offscreen
min: 229.8     avg: 253.2     median: 253.2 (15%)     max: 276.5 fps
GFXBench (DX / GLBenchmark) 2.7
GFXBench T-Rex HD Offscreen C24Z16 + NVIDIA GeForce GTX 1050 Ti Max-Q
GFXBench (DX / GLBenchmark) 2.7 - GFXBench T-Rex HD Offscreen C24Z16
min: 501     avg: 531     median: 531 (4%)     max: 561 fps
Basemark GPU 1.2 - Basemark GPU 1.2 Vulkan Official Medium Offscreen 1080
667 fps (4%)
Basemark GPU 1.2 - Basemark GPU 1.2 Vulkan Official High Offscreen 2160
61.5 fps (14%)
Geekbench 6.2 - Geekbench 6.2 GPU OpenCL
72935 Points (21%)
Geekbench 6.2 - Geekbench 6.2 GPU Vulkan
72741 Points (21%)
LuxMark v2.0 64Bit - LuxMark v2.0 Room GPU
min: 1167     avg: 1201     median: 1200.5 (5%)     max: 1234 Samples/s
3120 Samples/s (14%)
LuxMark v2.0 64Bit - LuxMark v2.0 Sala GPU
min: 2100     avg: 2222     median: 2221.5 (4%)     max: 2343 Samples/s
6758 Samples/s (12%)
ComputeMark v2.1 - ComputeMark v2.1 Result
min: 4515     avg: 4879     median: 4879 (5%)     max: 5243 Points
15520 Points (17%)
Power Consumption - Furmark Stress Test Power Consumption - external Monitor *
73.1 Watt (10%)
119.2 Watt (17%)
Power Consumption - The Witcher 3 Power Consumption - external Monitor *
75.8 Watt (11%)
Power Consumption - Witcher 3 Power Consumption *
min: 82     avg: 90     median: 85 (19%)     max: 103 Watt
Power Consumption - Witcher 3 ultra Power Efficiency
min: 0.2379     avg: 0.3     median: 0.3 (26%)     max: 0.3073 fps per Watt
Power Consumption - Witcher 3 ultra Power Efficiency - external Monitor
0.3 fps per Watt (27%)
Power Consumption - Cyberpunk 2077 Power Consumption - external Monitor *
244 Watt (31%)
Power Consumption - Cyberpunk 2077 ultra Power Efficiency
min: 0.1758     avg: 0.2     median: 0.2 (42%)     max: 0.4205 fps per Watt
Emissions Witcher 3 Fan Noise + NVIDIA GeForce GTX 1050 Ti Max-Q
Emissions - Witcher 3 Fan Noise
min: 36.4     avg: 40.2     median: 38.4 (61%)     max: 47.6 dB(A)
Clock Speed - GPU Clock Witcher 3 ultra
1392 MHz (55%)

Average Benchmarks NVIDIA GeForce GTX 1050 Ti Max-Q → 100% n=22

Average Benchmarks Nvidia RTX A2000 → 278% n=22

- Bereich der Benchmarkergebnisse für diese Grafikkarte
- Durchschnittliche Benchmarkergebnisse für diese Grafikkarte
* Smaller numbers mean a higher performance
1 This benchmark is not used for the average calculation

Spiele-Benchmarks

Die folgenden Benchmarks basieren auf unseren Spieletests mit Testnotebooks. Die Performance dieser Grafikkarte bei den gelisteten Spielen ist abhängig von der verwendeten CPU, Speicherausstattung, Treiber und auch Betriebssystem. Dadurch müssen die untenstehenden Werte nicht repräsentativ sein. Detaillierte Informationen über das verwendete System sehen Sie nach einem Klick auf den fps-Wert.

low 1920x1080
RTX A2000:
45  fps
med. 1920x1080
RTX A2000:
34  fps
high 1920x1080
RTX A2000:
26  fps
ultra 1920x1080
RTX A2000:
13  fps
QHD 2560x1440
RTX A2000:
10  fps
low 1920x1080
RTX A2000:
117.7  fps
med. 1920x1080
RTX A2000:
78.2  fps
high 1920x1080
RTX A2000:
64  fps
ultra 1920x1080
RTX A2000:
57.6  fps
QHD 2560x1440
RTX A2000:
36.6  fps
4K 3840x2160
RTX A2000:
18.3  fps
low 1920x1080
RTX A2000:
102.6  fps
med. 1920x1080
RTX A2000:
64.6  fps
high 1920x1080
RTX A2000:
49.6  fps
ultra 1920x1080
RTX A2000:
41.1  fps
QHD 2560x1440
RTX A2000:
25.6  fps
4K 3840x2160
RTX A2000:
13.3  fps
F1 24

F1 24

2024
low 1920x1080
RTX A2000:
173.3  fps
med. 1920x1080
RTX A2000:
144.7  fps
high 1920x1080
RTX A2000:
104.6  fps
ultra 1920x1080
RTX A2000:
32.5  fps
QHD 2560x1440
RTX A2000:
20.2  fps
4K 3840x2160
RTX A2000:
9.7  fps
4K DLSS 3840x2160
RTX A2000:
17.9  fps
low 1920x1080
RTX A2000:
90  fps
med. 1920x1080
RTX A2000:
84  fps
high 1920x1080
RTX A2000:
58  fps
ultra 1920x1080
RTX A2000:
39  fps
QHD 2560x1440
RTX A2000:
32  fps
4K 3840x2160
RTX A2000:
22  fps
4K DLSS 3840x2160
RTX A2000:
24  fps
low 1920x1080
RTX A2000:
44  fps
med. 1920x1080
RTX A2000:
39  fps
high 1920x1080
RTX A2000:
34  fps
ultra 1920x1080
RTX A2000:
25  fps
QHD 2560x1440
RTX A2000:
16  fps
4K 3840x2160
RTX A2000:
7  fps
4K DLSS 3840x2160
RTX A2000:
14  fps
low 1920x1080
RTX A2000:
85.4  fps
med. 1920x1080
RTX A2000:
60.2  fps
high 1920x1080
RTX A2000:
54.2  fps
ultra 1920x1080
RTX A2000:
49.7  fps
QHD 2560x1440
RTX A2000:
34.4  fps
4K 3840x2160
RTX A2000:
18.6  fps
4K DLSS 3840x2160
RTX A2000:
28.3  fps
low 1920x1080
RTX A2000:
244.4  fps
med. 1920x1080
RTX A2000:
155.3  fps
high 1920x1080
RTX A2000:
87.3  fps
ultra 1920x1080
RTX A2000:
69  fps
QHD 2560x1440
RTX A2000:
46.2  fps
4K 3840x2160
RTX A2000:
23.3  fps
low 1920x1080
RTX A2000:
83.9  fps
med. 1920x1080
RTX A2000:
61.9  fps
high 1920x1080
RTX A2000:
51.8  fps
ultra 1920x1080
RTX A2000:
44.7  fps
QHD 2560x1440
RTX A2000:
25.5  fps
4K 3840x2160
RTX A2000:
11  fps
Starfield

Starfield

2023
low 1920x1080
RTX A2000:
77.3  fps
med. 1920x1080
RTX A2000:
61.1  fps
high 1920x1080
RTX A2000:
40.5  fps
ultra 1920x1080
RTX A2000:
33  fps
QHD 2560x1440
RTX A2000:
26.6  fps
4K 3840x2160
RTX A2000:
17.1  fps
low 1920x1080
RTX A2000:
74.9  fps
med. 1920x1080
RTX A2000:
58.8  fps
high 1920x1080
RTX A2000:
50.8  fps
ultra 1920x1080
RTX A2000:
49.9  fps
QHD 2560x1440
RTX A2000:
34.4  fps
4K 3840x2160
RTX A2000:
18.2  fps
4K DLSS 3840x2160
RTX A2000:
30.2  fps
F1 23

F1 23

2023
low 1920x1080
RTX A2000:
185.1  fps
med. 1920x1080
RTX A2000:
165.1  fps
high 1920x1080
RTX A2000:
111.2  fps
ultra 1920x1080
RTX A2000:
32.2  fps
QHD 2560x1440
RTX A2000:
20  fps
4K 3840x2160
RTX A2000:
9.4  fps
4K DLSS 3840x2160
RTX A2000:
17.4  fps
low 1920x1080
RTX A2000:
110  fps
med. 1920x1080
RTX A2000:
92  fps
high 1920x1080
RTX A2000:
69  fps
ultra 1920x1080
RTX A2000:
68  fps
QHD 2560x1440
RTX A2000:
50  fps
4K 3840x2160
RTX A2000:
28  fps
Returnal

Returnal

2023
low 1920x1080
RTX A2000:
65  fps
med. 1920x1080
RTX A2000:
60  fps
high 1920x1080
RTX A2000:
53  fps
ultra 1920x1080
RTX A2000:
45  fps
QHD 2560x1440
RTX A2000:
32  fps
4K 3840x2160
RTX A2000:
18  fps
F1 22

F1 22

2022
low 1920x1080
RTX A2000:
197.4  fps
med. 1920x1080
RTX A2000:
181.5  fps
high 1920x1080
RTX A2000:
125.3  fps
ultra 1920x1080
RTX A2000:
37.5  fps
QHD 2560x1440
RTX A2000:
23  fps
4K 3840x2160
RTX A2000:
10.9  fps
low 1920x1080
RTX A2000:
124  fps
med. 1920x1080
RTX A2000:
99.4  fps
high 1920x1080
RTX A2000:
66  fps
ultra 1920x1080
RTX A2000:
51.2  fps
QHD 2560x1440
RTX A2000:
34.3  fps
4K 3840x2160
RTX A2000:
17.7  fps
low 1920x1080
RTX A2000:
198  fps
med. 1920x1080
RTX A2000:
142.1  fps
high 1920x1080
RTX A2000:
115.4  fps
ultra 1920x1080
RTX A2000:
81.7  fps
QHD 2560x1440
RTX A2000:
62  fps
4K 3840x2160
RTX A2000:
36.6  fps
low 1920x1080
RTX A2000:
86.1  fps
med. 1920x1080
RTX A2000:
72.9  fps
high 1920x1080
RTX A2000:
57.4  fps
ultra 1920x1080
RTX A2000:
38.9  fps
QHD 2560x1440
RTX A2000:
30.9  fps
4K 3840x2160
RTX A2000:
19.9  fps
low 1280x720
RTX A2000:
351  fps
med. 1920x1080
RTX A2000:
181.9  fps
high 1920x1080
RTX A2000:
131.5  fps
ultra 1920x1080
RTX A2000:
108.5  fps
QHD 2560x1440
RTX A2000:
78.7  fps
4K 3840x2160
RTX A2000:
45.2  fps
low 1280x720
RTX A2000:
231  fps
med. 1920x1080
RTX A2000:
121  fps
high 1920x1080
RTX A2000:
106  fps
ultra 1920x1080
RTX A2000:
59  fps
QHD 2560x1440
RTX A2000:
43  fps
4K 3840x2160
RTX A2000:
29  fps
low 1280x720
RTX A2000:
199  fps
med. 1920x1080
RTX A2000:
142  fps
high 1920x1080
RTX A2000:
143  fps
ultra 1920x1080
RTX A2000:
131  fps
QHD 2560x1440
RTX A2000:
98  fps
4K 3840x2160
RTX A2000:
55  fps
Far Cry 6

Far Cry 6

2021
low 1280x720
RTX A2000:
180.4  fps
med. 1920x1080
RTX A2000:
97.6  fps
high 1920x1080
RTX A2000:
83.2  fps
ultra 1920x1080
RTX A2000:
68.3  fps
QHD 2560x1440
RTX A2000:
48.8  fps
4K 3840x2160
RTX A2000:
25.7  fps
F1 2021

F1 2021

2021
low 1280x720
RTX A2000:
448  fps
med. 1920x1080
RTX A2000:
204  fps
high 1920x1080
RTX A2000:
157.3  fps
ultra 1920x1080
RTX A2000:
75.1  fps
QHD 2560x1440
RTX A2000:
53.4  fps
4K 3840x2160
RTX A2000:
28.4  fps
low 1280x720
RTX A2000:
184  fps
med. 1920x1080
RTX A2000:
104  fps
high 1920x1080
RTX A2000:
83  fps
ultra 1920x1080
RTX A2000:
68  fps
QHD 2560x1440
RTX A2000:
52  fps
4K 3840x2160
RTX A2000:
26  fps
4K DLSS 3840x2160
RTX A2000:
39  fps
F1 2020

F1 2020

2020
low 1280x720
RTX A2000:
405  fps
med. 1920x1080
RTX A2000:
197.2  fps
high 1920x1080
RTX A2000:
149.4  fps
ultra 1920x1080
RTX A2000:
101.2  fps
QHD 2560x1440
RTX A2000:
72  fps
4K 3840x2160
RTX A2000:
38.8  fps
low 1280x720
RTX A2000:
224  fps
med. 1920x1080
RTX A2000:
108.1  fps
high 1920x1080
RTX A2000:
68.6  fps
ultra 1920x1080
RTX A2000:
52  fps
QHD 2560x1440
RTX A2000:
35.2  fps
4K 3840x2160
RTX A2000:
18.7  fps
low 1280x720
RTX A2000:
370.4  fps
med. 1920x1080
RTX A2000:
116.2  fps
high 1920x1080
RTX A2000:
70.5  fps
ultra 1920x1080
RTX A2000:
48.4  fps
QHD 2560x1440
RTX A2000:
28.9  fps
4K 3840x2160
RTX A2000:
13.8  fps
low 1280x720
100%
GeForce GTX 1050 Ti Max-Q:
133.2  fps
med. 1920x1080
100%
GeForce GTX 1050 Ti Max-Q:
56.7  fps
high 1920x1080
100%
GeForce GTX 1050 Ti Max-Q:
44.3  fps
ultra 1920x1080
100%
GeForce GTX 1050 Ti Max-Q:
27.2  fps
4K 3840x2160
100%
GeForce GTX 1050 Ti Max-Q:
11.3  fps
Anthem

Anthem

2019
low 1280x720
100%
GeForce GTX 1050 Ti Max-Q:
67.1  fps
med. 1920x1080
100%
GeForce GTX 1050 Ti Max-Q:
40.5  fps
high 1920x1080
100%
GeForce GTX 1050 Ti Max-Q:
34  fps
ultra 1920x1080
100%
GeForce GTX 1050 Ti Max-Q:
30.4  fps
4K 3840x2160
100%
GeForce GTX 1050 Ti Max-Q:
9  fps
low 1280x720
100%
GeForce GTX 1050 Ti Max-Q:
83 89 ~ 86 fps
210%
RTX A2000:
181  fps
med. 1920x1080
100%
GeForce GTX 1050 Ti Max-Q:
47 50 ~ 49 fps
216%
RTX A2000:
106  fps
high 1920x1080
100%
GeForce GTX 1050 Ti Max-Q:
43 46 ~ 45 fps
216%
RTX A2000:
97  fps
ultra 1920x1080
100%
GeForce GTX 1050 Ti Max-Q:
40 43 ~ 42 fps
207%
RTX A2000:
87  fps
QHD 2560x1440
100%
GeForce GTX 1050 Ti Max-Q:
29  fps
214%
RTX A2000:
62  fps
4K 3840x2160
100%
GeForce GTX 1050 Ti Max-Q:
14 15 ~ 15 fps
220%
RTX A2000:
33  fps
low 1280x720
100%
GeForce GTX 1050 Ti Max-Q:
55.5 60.4 ~ 58 fps
292%
RTX A2000:
169.6  fps
med. 1920x1080
100%
GeForce GTX 1050 Ti Max-Q:
31.4 49.8 ~ 41 fps
193%
RTX A2000:
79  fps
high 1920x1080
100%
GeForce GTX 1050 Ti Max-Q:
23.5 36.5 ~ 30 fps
190%
RTX A2000:
56.9  fps
ultra 1920x1080
100%
GeForce GTX 1050 Ti Max-Q:
19.3 28.3 ~ 24 fps
187%
RTX A2000:
44.8  fps
QHD 2560x1440
RTX A2000:
34  fps
4K 3840x2160
100%
GeForce GTX 1050 Ti Max-Q:
4.7  fps
430%
RTX A2000:
20.2  fps
low 1280x720
100%
GeForce GTX 1050 Ti Max-Q:
73.2  fps
med. 1920x1080
100%
GeForce GTX 1050 Ti Max-Q:
47.9  fps
high 1920x1080
100%
GeForce GTX 1050 Ti Max-Q:
36.1  fps
ultra 1920x1080
100%
GeForce GTX 1050 Ti Max-Q:
35.3  fps
4K 3840x2160
100%
GeForce GTX 1050 Ti Max-Q:
12.9  fps
low 1280x720
100%
GeForce GTX 1050 Ti Max-Q:
134.5  fps
med. 1920x1080
100%
GeForce GTX 1050 Ti Max-Q:
87.4  fps
high 1920x1080
100%
GeForce GTX 1050 Ti Max-Q:
73.7  fps
ultra 1920x1080
100%
GeForce GTX 1050 Ti Max-Q:
65  fps
4K 3840x2160
100%
GeForce GTX 1050 Ti Max-Q:
13.2  fps
low 1280x720
100%
GeForce GTX 1050 Ti Max-Q:
100.1  fps
med. 1920x1080
100%
GeForce GTX 1050 Ti Max-Q:
57.3  fps
high 1920x1080
100%
GeForce GTX 1050 Ti Max-Q:
47.9  fps
ultra 1920x1080
100%
GeForce GTX 1050 Ti Max-Q:
44.8  fps
4K 3840x2160
100%
GeForce GTX 1050 Ti Max-Q:
17.3  fps
low 1280x720
100%
GeForce GTX 1050 Ti Max-Q:
193.6  fps
med. 1920x1080
100%
GeForce GTX 1050 Ti Max-Q:
128.7  fps
high 1920x1080
100%
GeForce GTX 1050 Ti Max-Q:
80.5  fps
ultra 1920x1080
100%
GeForce GTX 1050 Ti Max-Q:
61  fps
4K 3840x2160
100%
GeForce GTX 1050 Ti Max-Q:
22  fps
Hitman 2

Hitman 2

2018
low 1280x720
100%
GeForce GTX 1050 Ti Max-Q:
64.8  fps
med. 1920x1080
100%
GeForce GTX 1050 Ti Max-Q:
41  fps
high 1920x1080
100%
GeForce GTX 1050 Ti Max-Q:
37.5  fps
ultra 1920x1080
100%
GeForce GTX 1050 Ti Max-Q:
35.9  fps
4K 3840x2160
100%
GeForce GTX 1050 Ti Max-Q:
11.3  fps
low 1280x720
100%
GeForce GTX 1050 Ti Max-Q:
118.7  fps
med. 1920x1080
100%
GeForce GTX 1050 Ti Max-Q:
46.3  fps
high 1920x1080
100%
GeForce GTX 1050 Ti Max-Q:
45  fps
ultra 1920x1080
100%
GeForce GTX 1050 Ti Max-Q:
37.5  fps
4K 3840x2160
100%
GeForce GTX 1050 Ti Max-Q:
10.1  fps
low 1280x720
100%
GeForce GTX 1050 Ti Max-Q:
67  fps
med. 1920x1080
100%
GeForce GTX 1050 Ti Max-Q:
43  fps
high 1920x1080
100%
GeForce GTX 1050 Ti Max-Q:
34  fps
ultra 1920x1080
100%
GeForce GTX 1050 Ti Max-Q:
18  fps
4K 3840x2160
100%
GeForce GTX 1050 Ti Max-Q:
7  fps
low 1280x720
100%
GeForce GTX 1050 Ti Max-Q:
122  fps
med. 1920x1080
100%
GeForce GTX 1050 Ti Max-Q:
67  fps
high 1920x1080
100%
GeForce GTX 1050 Ti Max-Q:
61  fps
ultra 1920x1080
100%
GeForce GTX 1050 Ti Max-Q:
47  fps
4K 3840x2160
100%
GeForce GTX 1050 Ti Max-Q:
20  fps
low 1280x720
100%
GeForce GTX 1050 Ti Max-Q:
97  fps
236%
RTX A2000:
229  fps
med. 1920x1080
100%
GeForce GTX 1050 Ti Max-Q:
39  fps
248%
RTX A2000:
96.8  fps
high 1920x1080
100%
GeForce GTX 1050 Ti Max-Q:
35  fps
247%
RTX A2000:
86.5  fps
ultra 1920x1080
100%
GeForce GTX 1050 Ti Max-Q:
29  fps
267%
RTX A2000:
77.4  fps
QHD 2560x1440
RTX A2000:
51.5  fps
4K 3840x2160
100%
GeForce GTX 1050 Ti Max-Q:
11  fps
243%
RTX A2000:
26.7  fps
Strange Brigade

Strange Brigade

2018
low 1280x720
RTX A2000:
407  fps
med. 1920x1080
RTX A2000:
166.4  fps
high 1920x1080
RTX A2000:
130.1  fps
ultra 1920x1080
RTX A2000:
109.3  fps
QHD 2560x1440
RTX A2000:
79  fps
4K 3840x2160
RTX A2000:
45.2  fps
F1 2018

F1 2018

2018
low 1280x720
100%
GeForce GTX 1050 Ti Max-Q:
134  fps
med. 1920x1080
100%
GeForce GTX 1050 Ti Max-Q:
80  fps
high 1920x1080
100%
GeForce GTX 1050 Ti Max-Q:
62  fps
ultra 1920x1080
100%
GeForce GTX 1050 Ti Max-Q:
38  fps
4K 3840x2160
100%
GeForce GTX 1050 Ti Max-Q:
17  fps
low 1280x720
100%
GeForce GTX 1050 Ti Max-Q:
100.3  fps
med. 1920x1080
100%
GeForce GTX 1050 Ti Max-Q:
39.2  fps
high 1920x1080
100%
GeForce GTX 1050 Ti Max-Q:
34.9  fps
ultra 1920x1080
100%
GeForce GTX 1050 Ti Max-Q:
26.8  fps
4K 3840x2160
100%
GeForce GTX 1050 Ti Max-Q:
8.3  fps
low 1280x720
100%
GeForce GTX 1050 Ti Max-Q:
60  fps
med. 1920x1080
100%
GeForce GTX 1050 Ti Max-Q:
49.1  fps
high 1920x1080
100%
GeForce GTX 1050 Ti Max-Q:
45.3  fps
ultra 1920x1080
100%
GeForce GTX 1050 Ti Max-Q:
42  fps
4K 3840x2160
100%
GeForce GTX 1050 Ti Max-Q:
14  fps
Far Cry 5

Far Cry 5

2018
low 1280x720
100%
GeForce GTX 1050 Ti Max-Q:
76 91 91 ~ 86 fps
236%
RTX A2000:
203  fps
med. 1920x1080
100%
GeForce GTX 1050 Ti Max-Q:
45 48 48 ~ 47 fps
230%
RTX A2000:
108  fps
high 1920x1080
100%
GeForce GTX 1050 Ti Max-Q:
41 44 44 ~ 43 fps
228%
RTX A2000:
98  fps
ultra 1920x1080
100%
GeForce GTX 1050 Ti Max-Q:
38 38 41 ~ 39 fps
233%
RTX A2000:
91  fps
QHD 2560x1440
RTX A2000:
61  fps
4K 3840x2160
100%
GeForce GTX 1050 Ti Max-Q:
13 13 14 ~ 13 fps
231%
RTX A2000:
30  fps
low 1280x720
100%
GeForce GTX 1050 Ti Max-Q:
92.7  fps
219%
RTX A2000:
203  fps
med. 1920x1080
100%
GeForce GTX 1050 Ti Max-Q:
80.3  fps
220%
RTX A2000:
176.4  fps
high 1920x1080
100%
GeForce GTX 1050 Ti Max-Q:
69.4  fps
197%
RTX A2000:
136.4  fps
4K 3840x2160
100%
GeForce GTX 1050 Ti Max-Q:
39.5  fps
253%
RTX A2000:
99.8  fps
low 1280x720
100%
GeForce GTX 1050 Ti Max-Q:
61.5 75.1 ~ 68 fps
240%
RTX A2000:
163.1  fps
med. 1920x1080
100%
GeForce GTX 1050 Ti Max-Q:
36.6 37.7 ~ 37 fps
222%
RTX A2000:
82.3  fps
high 1920x1080
100%
GeForce GTX 1050 Ti Max-Q:
23.3 25 ~ 24 fps
255%
RTX A2000:
61.3  fps
QHD 2560x1440
RTX A2000:
43.9  fps
4K 3840x2160
100%
GeForce GTX 1050 Ti Max-Q:
9.2  fps
268%
RTX A2000:
24.7  fps
low 1280x720
100%
GeForce GTX 1050 Ti Max-Q:
92.3  fps
med. 1920x1080
100%
GeForce GTX 1050 Ti Max-Q:
42  fps
high 1920x1080
100%
GeForce GTX 1050 Ti Max-Q:
34.3  fps
ultra 1920x1080
100%
GeForce GTX 1050 Ti Max-Q:
30.4  fps
low 1280x720
100%
GeForce GTX 1050 Ti Max-Q:
58  fps
med. 1920x1080
100%
GeForce GTX 1050 Ti Max-Q:
41  fps
high 1920x1080
100%
GeForce GTX 1050 Ti Max-Q:
33  fps
ultra 1920x1080
100%
GeForce GTX 1050 Ti Max-Q:
27  fps
4K 3840x2160
100%
GeForce GTX 1050 Ti Max-Q:
13  fps
Destiny 2

Destiny 2

2017
low 1280x720
100%
GeForce GTX 1050 Ti Max-Q:
119.5  fps
med. 1920x1080
100%
GeForce GTX 1050 Ti Max-Q:
69.4  fps
high 1920x1080
100%
GeForce GTX 1050 Ti Max-Q:
64.3  fps
ultra 1920x1080
100%
GeForce GTX 1050 Ti Max-Q:
57.9  fps
4K 3840x2160
100%
GeForce GTX 1050 Ti Max-Q:
18.9  fps
low 1280x720
100%
GeForce GTX 1050 Ti Max-Q:
105  fps
med. 1920x1080
100%
GeForce GTX 1050 Ti Max-Q:
55  fps
high 1920x1080
100%
GeForce GTX 1050 Ti Max-Q:
41  fps
ultra 1920x1080
100%
GeForce GTX 1050 Ti Max-Q:
31  fps
4K 3840x2160
100%
GeForce GTX 1050 Ti Max-Q:
13  fps
low 1280x720
100%
GeForce GTX 1050 Ti Max-Q:
129.8  fps
med. 1366x768
100%
GeForce GTX 1050 Ti Max-Q:
123.6  fps
high 1920x1080
100%
GeForce GTX 1050 Ti Max-Q:
115.7  fps
ultra 1920x1080
100%
GeForce GTX 1050 Ti Max-Q:
112.6  fps
4K 3820x2160
100%
GeForce GTX 1050 Ti Max-Q:
65.2  fps
low 1280x720
100%
GeForce GTX 1050 Ti Max-Q:
249.1  fps
med. 1920x1080
100%
GeForce GTX 1050 Ti Max-Q:
169.1  fps
high 1920x1080
100%
GeForce GTX 1050 Ti Max-Q:
112.5  fps
4K 3840x2160
100%
GeForce GTX 1050 Ti Max-Q:
42.3  fps
Prey

Prey

2017
low 1280x720
100%
GeForce GTX 1050 Ti Max-Q:
142.4  fps
med. 1920x1080
100%
GeForce GTX 1050 Ti Max-Q:
85.6  fps
high 1920x1080
100%
GeForce GTX 1050 Ti Max-Q:
68.3  fps
ultra 1920x1080
100%
GeForce GTX 1050 Ti Max-Q:
58.9  fps
4K 3840x2160
100%
GeForce GTX 1050 Ti Max-Q:
21.7  fps
low 1280x720
100%
GeForce GTX 1050 Ti Max-Q:
68.6 96.7 ~ 83 fps
med. 1920x1080
100%
GeForce GTX 1050 Ti Max-Q:
39.3 42.7 45.9 ~ 43 fps
high 1920x1080
100%
GeForce GTX 1050 Ti Max-Q:
35.3 40 41.9 ~ 39 fps
ultra 1920x1080
100%
GeForce GTX 1050 Ti Max-Q:
19.1 22.4 23.4 ~ 22 fps
4K 3840x2160
100%
GeForce GTX 1050 Ti Max-Q:
13.9 14.5 ~ 14 fps
For Honor

For Honor

2017
low 1280x720
100%
GeForce GTX 1050 Ti Max-Q:
113.6 179.3 ~ 146 fps
med. 1920x1080
100%
GeForce GTX 1050 Ti Max-Q:
63.8 68.2 ~ 66 fps
high 1920x1080
100%
GeForce GTX 1050 Ti Max-Q:
64.9 65.5 ~ 65 fps
ultra 1920x1080
100%
GeForce GTX 1050 Ti Max-Q:
49.5 50.4 ~ 50 fps
4K 3840x2160
100%
GeForce GTX 1050 Ti Max-Q:
19.2 19.2 ~ 19 fps
high 1920x1080
100%
GeForce GTX 1050 Ti Max-Q:
137.3  fps
ultra 1920x1080
100%
GeForce GTX 1050 Ti Max-Q:
104.6  fps
low 1280x720
100%
GeForce GTX 1050 Ti Max-Q:
89.5 154.8 ~ 122 fps
med. 1366x768
100%
GeForce GTX 1050 Ti Max-Q:
85.2 120 ~ 103 fps
high 1920x1080
100%
GeForce GTX 1050 Ti Max-Q:
51.7 58.1 ~ 55 fps
ultra 1920x1080
100%
GeForce GTX 1050 Ti Max-Q:
49.8 53.1 ~ 51 fps
4K 3840x2160
100%
GeForce GTX 1050 Ti Max-Q:
20.7 21.1 ~ 21 fps
low 1024x768
100%
GeForce GTX 1050 Ti Max-Q:
112.5  fps
med. 1366x768
100%
GeForce GTX 1050 Ti Max-Q:
85.8  fps
high 1920x1080
100%
GeForce GTX 1050 Ti Max-Q:
51  fps
ultra 1920x1080
100%
GeForce GTX 1050 Ti Max-Q:
43  fps
Overwatch

Overwatch

2016
low 1280x720
100%
GeForce GTX 1050 Ti Max-Q:
285.4  fps
med. 1366x768
100%
GeForce GTX 1050 Ti Max-Q:
233.9  fps
high 1920x1080
100%
GeForce GTX 1050 Ti Max-Q:
117.7  fps
ultra 1920x1080
100%
GeForce GTX 1050 Ti Max-Q:
70.5  fps
4K 3840x2160
100%
GeForce GTX 1050 Ti Max-Q:
37  fps
low 1280x768
100%
GeForce GTX 1050 Ti Max-Q:
63  fps
med. 1920x1080
100%
GeForce GTX 1050 Ti Max-Q:
41.3  fps
high 1920x1080
100%
GeForce GTX 1050 Ti Max-Q:
35.8  fps
4K 3840x2160
100%
GeForce GTX 1050 Ti Max-Q:
15.7  fps
low 1280x720
100%
GeForce GTX 1050 Ti Max-Q:
114.2 137.2 ~ 126 fps
med. 1366x768
100%
GeForce GTX 1050 Ti Max-Q:
83.4 89.5 ~ 86 fps
high 1920x1080
100%
GeForce GTX 1050 Ti Max-Q:
41.9 42.5 ~ 42 fps
ultra 1920x1080
100%
GeForce GTX 1050 Ti Max-Q:
32.2 34.8 ~ 34 fps
4K 3840x2160
100%
GeForce GTX 1050 Ti Max-Q:
14.6 15.7 ~ 15 fps
low 1024x768
100%
GeForce GTX 1050 Ti Max-Q:
99.9 118.3 141.1 141.7 ~ 125 fps
med. 1366x768
100%
GeForce GTX 1050 Ti Max-Q:
67.6 73.6 82.9 85.7 ~ 77 fps
high 1920x1080
100%
GeForce GTX 1050 Ti Max-Q:
38.8 47.3 47.4 47.7 ~ 45 fps
ultra 1920x1080
100%
GeForce GTX 1050 Ti Max-Q:
31.7 39.5 39.9 40.5 ~ 38 fps
4K 3840x2160
100%
GeForce GTX 1050 Ti Max-Q:
16.8 17.1 ~ 17 fps
low 1024x768
100%
GeForce GTX 1050 Ti Max-Q:
236.6 263.6 ~ 250 fps
med. 1366x768
100%
GeForce GTX 1050 Ti Max-Q:
154.6 162.2 ~ 158 fps
high 1920x1080
100%
GeForce GTX 1050 Ti Max-Q:
90.2 92.7 ~ 91 fps
ultra 1920x1080
100%
GeForce GTX 1050 Ti Max-Q:
62.5 67.5 ~ 65 fps
4K 3840x2160
100%
GeForce GTX 1050 Ti Max-Q:
27.7 29.3 ~ 29 fps
low 1366x768
100%
GeForce GTX 1050 Ti Max-Q:
168.6  fps
med. 1366x768
100%
GeForce GTX 1050 Ti Max-Q:
143.9  fps
high 1920x1080
100%
GeForce GTX 1050 Ti Max-Q:
112.7  fps
ultra 1920x1080
100%
GeForce GTX 1050 Ti Max-Q:
101  fps
4K 3840 x 2160
100%
GeForce GTX 1050 Ti Max-Q:
34.4  fps
low 1280x720
100%
GeForce GTX 1050 Ti Max-Q:
111.9  fps
237%
RTX A2000:
265.4  fps
med. 1366x768
100%
GeForce GTX 1050 Ti Max-Q:
104.2  fps
225%
RTX A2000:
234.2  fps
high 1920x1080
100%
GeForce GTX 1050 Ti Max-Q:
98.1  fps
216%
RTX A2000:
212  fps
ultra 1920x1080
100%
GeForce GTX 1050 Ti Max-Q:
93.5  fps
203%
RTX A2000:
190.2  fps
4K 3840x2160
100%
GeForce GTX 1050 Ti Max-Q:
46  fps
188%
RTX A2000:
86.6  fps
low 1024x768
100%
GeForce GTX 1050 Ti Max-Q:
122 130.7 130.9 131.3 138.6 145 ~ 133 fps
259%
RTX A2000:
345  fps
med. 1366x768
100%
GeForce GTX 1050 Ti Max-Q:
73.2 76.6 80.9 82.6 87.2 99 ~ 83 fps
261%
RTX A2000:
217  fps
high 1920x1080
100%
GeForce GTX 1050 Ti Max-Q:
42.6 44.2 45.1 46 48.2 60 ~ 48 fps
244%
RTX A2000:
117  fps
ultra 1920x1080
100%
GeForce GTX 1050 Ti Max-Q:
23.5 24.5 24.9 25.2 25.4 26 43 ~ 28 fps
228%
RTX A2000:
63.9  fps
QHD 2560x1440
RTX A2000:
47.2  fps
4K 3840x2160
100%
GeForce GTX 1050 Ti Max-Q:
15.9 16.4 17.1 ~ 16 fps
251%
RTX A2000:
40.1  fps
GTA V

GTA V

2015
low 1024x768
100%
GeForce GTX 1050 Ti Max-Q:
150.4  fps
125%
RTX A2000:
187.7  fps
med. 1366x768
100%
GeForce GTX 1050 Ti Max-Q:
143.3  fps
131%
RTX A2000:
187.5  fps
high 1920x1080
100%
GeForce GTX 1050 Ti Max-Q:
78.9  fps
221%
RTX A2000:
174.1  fps
ultra 1920x1080
100%
GeForce GTX 1050 Ti Max-Q:
34.5  fps
240%
RTX A2000:
82.9  fps
QHD 2560x1440
RTX A2000:
57.8  fps
4K 3840x2160
100%
GeForce GTX 1050 Ti Max-Q:
35.5  fps
157%
RTX A2000:
55.6  fps
low 1280x720
100%
GeForce GTX 1050 Ti Max-Q:
244.3 262 297 298.2 299 ~ 280 fps
med. 1366x768
100%
GeForce GTX 1050 Ti Max-Q:
194.6 204 208.7 209.3 214 ~ 206 fps
high 1366x768
100%
GeForce GTX 1050 Ti Max-Q:
175.8 181.3 183.3 183.5 187.8 ~ 182 fps
ultra 1920x1080
100%
GeForce GTX 1050 Ti Max-Q:
71.3 71.8 72.2 73 74.6 ~ 73 fps
low 1024x768
100%
GeForce GTX 1050 Ti Max-Q:
228.2  fps
med. 1366x768
100%
GeForce GTX 1050 Ti Max-Q:
202.6  fps
high 1366x768
100%
GeForce GTX 1050 Ti Max-Q:
202.1  fps
ultra 1920x1080
100%
GeForce GTX 1050 Ti Max-Q:
170.1  fps
low 1024x768
100%
GeForce GTX 1050 Ti Max-Q:
433.4  fps
med. 1360x768
100%
GeForce GTX 1050 Ti Max-Q:
200.4  fps
high 1360x768
100%
GeForce GTX 1050 Ti Max-Q:
186.7  fps
ultra 1920x1080
100%
GeForce GTX 1050 Ti Max-Q:
126.7  fps

Average Gaming NVIDIA GeForce GTX 1050 Ti Max-Q → 100%

Average Gaming 30-70 fps → 100%

Average Gaming Nvidia RTX A2000 → 228%

Average Gaming 30-70 fps → 213%

Nvidia RTX A2000lowmed.highultraQHD4K
Black Myth: Wukong4534261310
Once Human117.778.26457.636.618.3
The First Descendant102.664.649.641.125.613.3
F1 24173.3144.7104.632.520.29.7
Skull & Bones908458393222
Avatar Frontiers of Pandora44393425167
EA Sports WRC85.460.254.249.734.418.6
Total War Pharaoh244.4155.387.36946.223.3
Cyberpunk 2077 2.1 Phantom Liberty83.961.951.844.725.511
Starfield77.361.140.53326.617.1
Baldur's Gate 374.958.850.849.934.418.2
F1 23185.1165.1111.232.2209.4
Company of Heroes 31109269685028
Returnal656053453218
F1 22197.4181.5125.337.52310.9
Tiny Tina's Wonderlands12499.46651.234.317.7
GRID Legends198142.1115.481.76236.6
God of War86.172.957.438.930.919.9
Farming Simulator 22351181.9131.5108.578.745.2
Forza Horizon 5231121106594329
Guardians of the Galaxy1991421431319855
Far Cry 6180.497.683.268.348.825.7
F1 2021448204157.375.153.428.4
Horizon Zero Dawn18410483685226
F1 2020405197.2149.4101.27238.8
Borderlands 3224108.168.65235.218.7
Total War: Three Kingdoms370.4116.270.548.428.913.8
Far Cry New Dawn18110697876233
Metro Exodus169.67956.944.83420.2
Shadow of the Tomb Raider22996.886.577.451.526.7
Strange Brigade407166.4130.1109.37945.2
Far Cry 520310898916130
X-Plane 11.11203176.4136.499.8
Final Fantasy XV Benchmark163.182.361.343.924.7
Dota 2 Reborn265.4234.2212190.286.6
The Witcher 334521711763.947.240.1
GTA V187.7187.5174.182.957.855.6
< 30 fps
< 60 fps
< 120 fps
≥ 120 fps

2
10
25

3
19
15
1
10
17
9
2
17
14
2
9
19
7
25
9
2
NVIDIA GeForce GTX 1050 Ti Max-Qlowmed.highultraQHD4K
Dirt Rally 2.0133.256.744.327.211.3
Anthem67.140.53430.49
Far Cry New Dawn864945422915
Metro Exodus584130244.7
Just Cause 473.247.936.135.312.9
Darksiders III134.587.473.76513.2
Battlefield V100.157.347.944.817.3
Farming Simulator 19193.6128.780.56122
Hitman 264.84137.535.911.3
Call of Duty Black Ops 4118.746.34537.510.1
Assassin´s Creed Odyssey674334187
Forza Horizon 412267614720
Shadow of the Tomb Raider9739352911
F1 201813480623817
Monster Hunter World100.339.234.926.88.3
The Crew 26049.145.34214
Far Cry 58647433913
X-Plane 11.1192.780.369.439.5
Final Fantasy XV Benchmark6837249.2
Star Wars Battlefront 292.34234.330.4
Assassin´s Creed Origins5841332713
Destiny 2119.569.464.357.918.9
Middle-earth: Shadow of War10555413113
Team Fortress 2129.8123.6115.7112.665.2
Rocket League249.1169.1112.542.3
Prey142.485.668.358.921.7
Ghost Recon Wildlands8343392214
For Honor14666655019
Farming Simulator 17137.3104.6
Battlefield 1122103555121
Civilization VI112.585.85143
Overwatch285.4233.9117.770.537
Ashes of the Singularity6341.335.815.7
The Division12686423415
Rise of the Tomb Raider12577453817
Rainbow Six Siege250158916529
World of Warships168.6143.9112.710134.4
Dota 2 Reborn111.9104.298.193.546
The Witcher 313383482816
GTA V150.4143.378.934.535.5
BioShock Infinite28020618273
Diablo III228.2202.6202.1170.1
StarCraft 2433.4200.4186.7126.7
< 30 fps
< 60 fps
< 120 fps
≥ 120 fps

2
20
20

19
13
10
1
23
15
4
8
20
9
2
1


30
6
1

Eine Liste mit weiteren Spielen und allen Grafikkarten finden Sie auf unserer Seite: Welches Spiel ist mit welcher Grafikkarte spielbar?

Add one or more devices and compare

In the following list you can select (and also search for) devices that should be added to the comparison. You can select more than one device.

restrict list:

show all (including archived), 2024, 2023
v1.28
log 20. 01:11:14

#0 ran 0s before starting gpusingle class +0s ... 0s

#1 checking url part for id 8480 +0s ... 0s

#2 checking url part for id 12778 +0s ... 0s

#3 redirected to Ajax server, took 1726787473s time from redirect:0 +0s ... 0s

#4 did not recreate cache, as it is less than 5 days old! Created at Thu, 19 Sep 2024 05:16:33 +0200 +0s ... 0s

#5 composed specs +0.025s ... 0.026s

#6 did output specs +0s ... 0.026s

#7 start showIntegratedCPUs +0s ... 0.026s

#8 getting avg benchmarks for device 8480 +0.022s ... 0.048s

#9 got single benchmarks 8480 +0.009s ... 0.057s

#10 getting avg benchmarks for device 12778 +0.004s ... 0.061s

#11 got single benchmarks 12778 +0.004s ... 0.065s

#12 got avg benchmarks for devices +0s ... 0.065s

#13 min, max, avg, median took s +0.044s ... 0.109s

#14 before gaming benchmark output +0s ... 0.109s

#15 Got 530 rows for game benchmarks. +0.022s ... 0.131s

#16 composed SQL query for gamebenchmarks +0s ... 0.131s

#17 got data and put it in $dataArray +0.003s ... 0.135s

#18 benchmarks composed for output. +0.023s ... 0.158s

#19 calculated avg scores. +0s ... 0.158s

#20 return log +0.002s ... 0.16s

Teilen Sie diesen Artikel, um uns zu unterstützen. Jeder Link hilft!
> Notebook Test, Laptop Test und News > Benchmarks / Technik > Benchmarks / Technik > Grafikkarten Vergleich - Head 2 Head
Autor: Klaus Hinum,  8.09.2017 (Update:  1.07.2023)