Notebookcheck Logo

NVIDIA GeForce GTX 1050 Ti Max-Q vs NVIDIA Quadro RTX 6000 (Laptop) vs NVIDIA T600

NVIDIA GeForce GTX 1050 Ti Max-Q

► remove from comparison NVIDIA GeForce GTX 1050 Ti Max-Q

Die Nvidia GeForce GTX 1050 Ti mit Max-Q Design ist eine Mittelklasse-GPU basierend auf der Pascal-Architektur und wurde im Januar 2018 vorgestellt. Anders als die schnelleren Modelle basiert die GTX 1050 Ti auf dem GP107-Chip, der im 14-nm-Verfahren bei Samsung hergestellt wird.

Im Vergleich zur normalen GTX 1050 Ti gibt es noch weitere Unterschiede als den Takt. Der Treiber wurde auf Effizienz (und nicht Leistung) optimiert (nur für die Max-Q Modelle), optimierte Spannungswandler für 1V Betreib, high-end Kühlungsmethoden und eine 40 dB Grenze für die Lüfterlautstärke (mit Taktanpasssungen um dies jederzeit zu gewährleisten) zeichnen die Max-Q Variante aus.

Features

Der GP107-Chip wird in einem 14-nm-FinFET-Prozess bei Samsung gefertigt und bietet eine Reihe neuer Features, unter anderem Support für DisplayPort 1.4 (ready), HDMI 2.0b, HDR, Simultaneous Multi-Projection (SMP) sowie verbessertes H.265 Video De- und Encoding (PlayReady 3.0). Eine genaue Auflistung der Verbesserungen und Features der neuen Pascal Desktop-GPUs finden Sie in unserem Pascal-Architektur-Artikel.

Performance

Die exakte Performance der GeForce GTX 1050 Ti Max-Q kann sich in Abhängigkeit von der Kühlung des jeweiligen Notebooks stark unterscheiden. Im Optimalfall ist die Leistung etwa 10 bis 15 % unterhalb der normalen GTX 1050 Ti angesiedelt. Dadurch eignet sich die Grafikkarte am besten für Full HD (1920 x 1080) bei hoher aber nicht maximaler Detailstufe.

Leistungsaufnahme

Die Leistungsaufnahme der GeForce GTX 1050 Ti Max-Q ist von Nvidia mit 40 - 46 Watt spezifiziert und damit deutlich unterhalb der normalen Notebook GTX 1050 Ti (64 Watt). Selbst die normale GTX 1050 ist mit 53 Watt höher spezifziert. Damit eignet sich die Grafikkarte auch für dünne und leichte 14-Zoll Notebooks.

NVIDIA Quadro RTX 6000 (Laptop)

► remove from comparison NVIDIA Quadro RTX 6000 (Laptop)

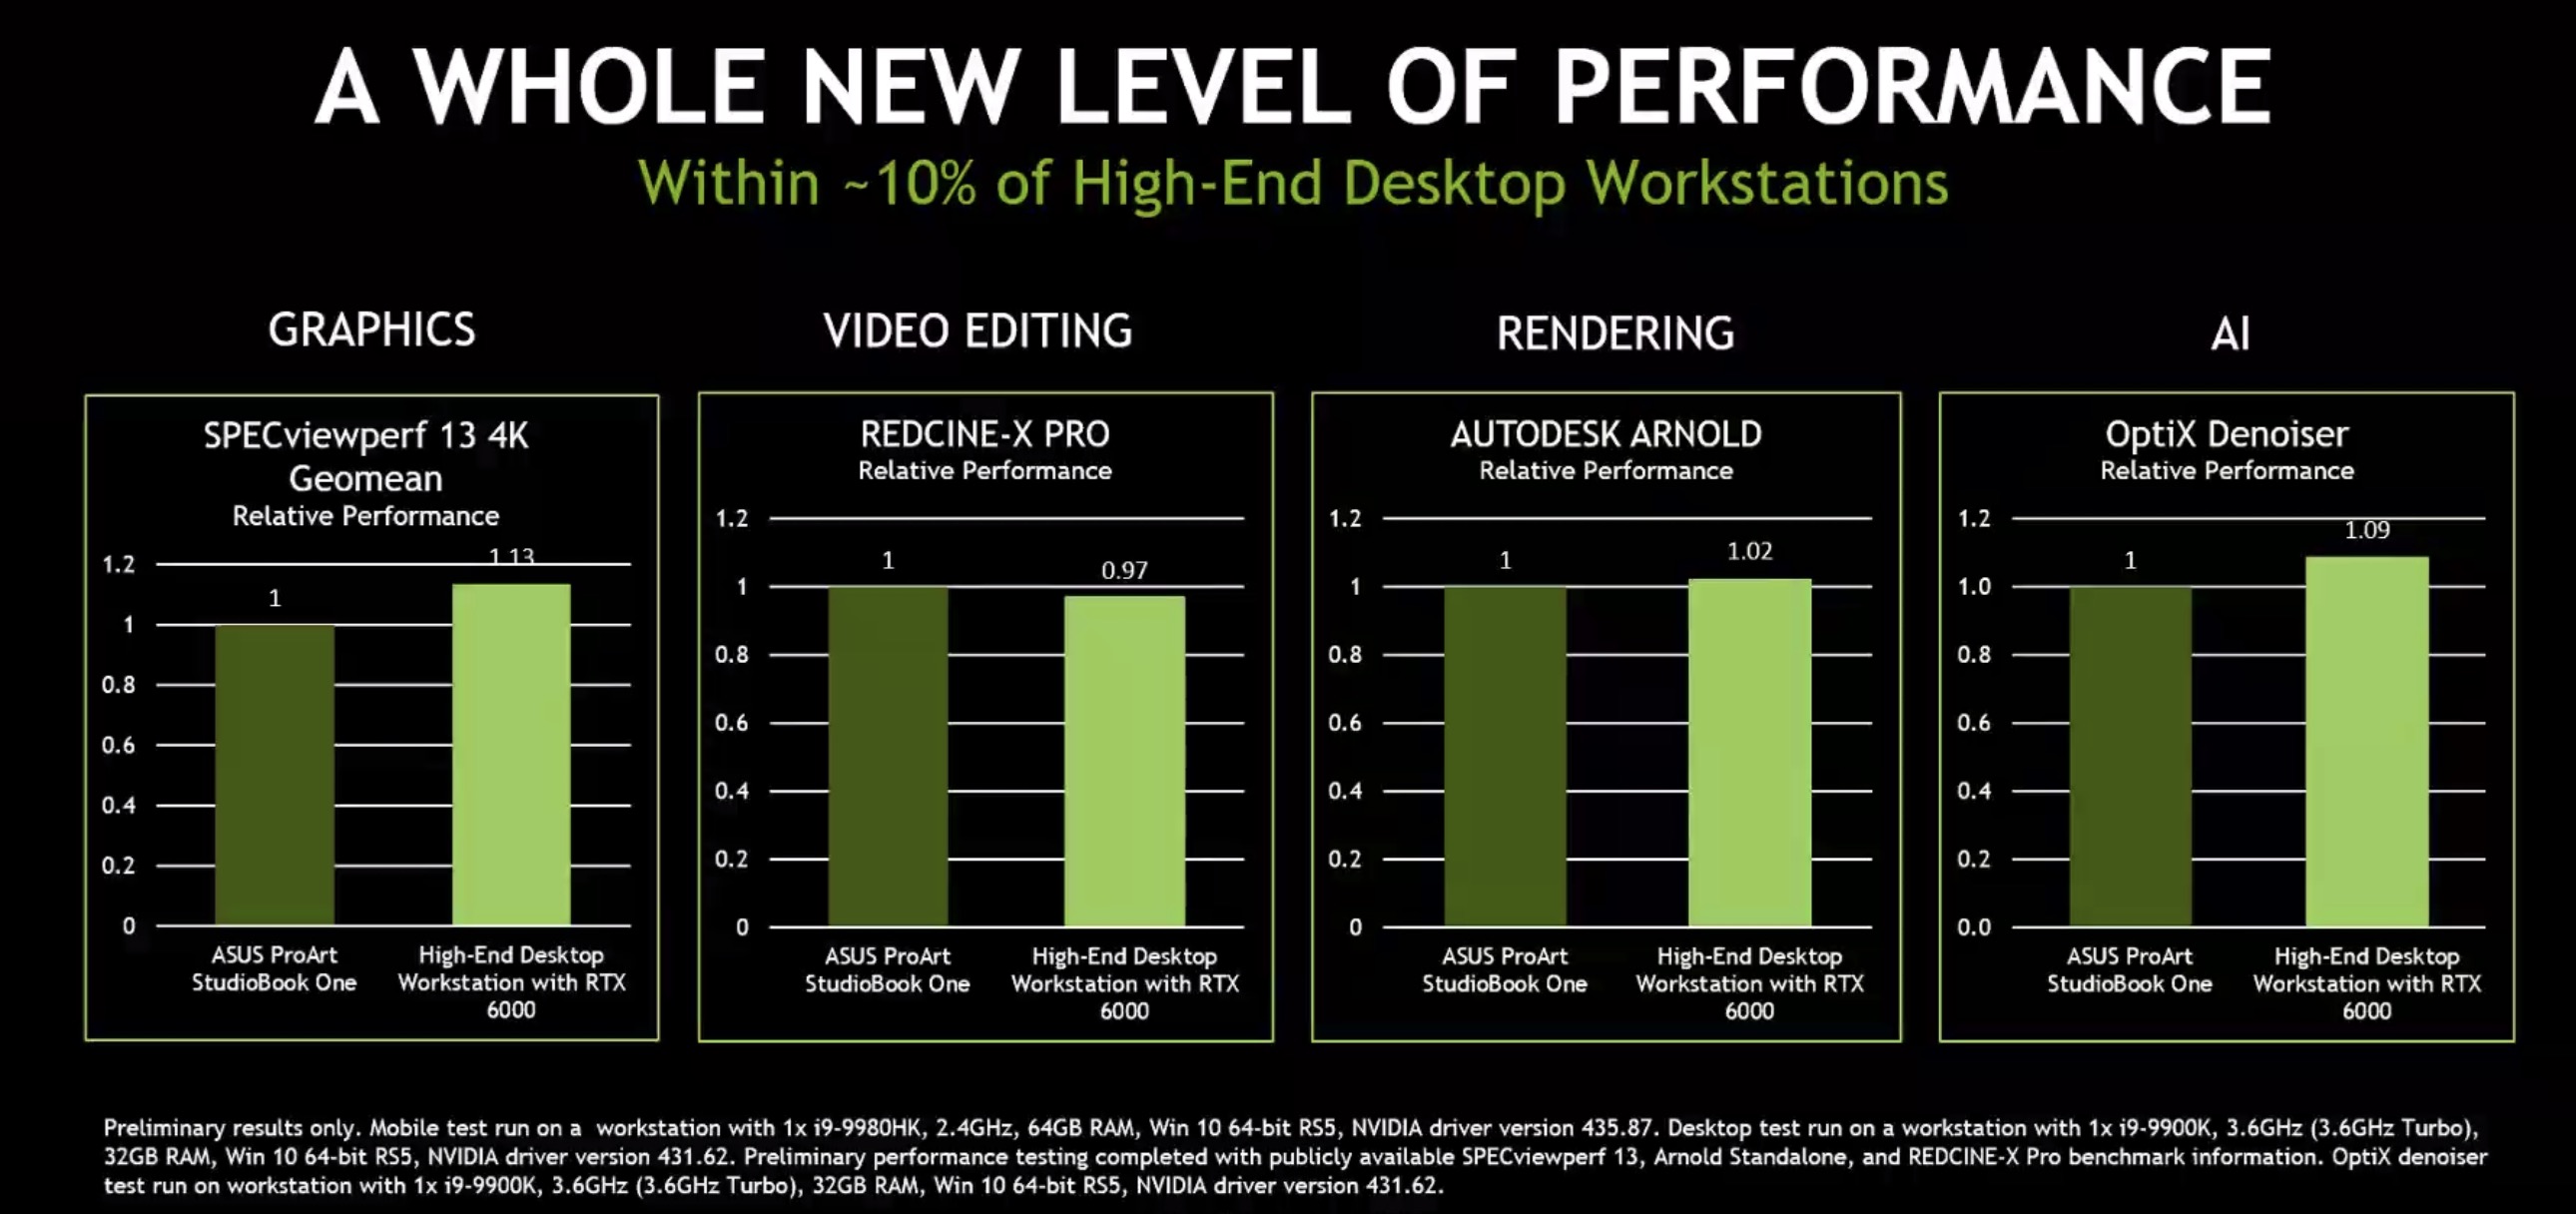
Die Nvidia Quadro RTX 6000 für Laptops ist eine professionelle Grafikkarte für große und schwere Notebooks. Sie basiert wie die Consumer GeForce RTX 2080 Ti auf den TU102 Chip, bietet jedoch mit 4.608 Shader und 24 GB GDDR6 Grafikspeicher. Im Vergleich zur Desktop RTX 6000, wird die mobile deutlich geringer getaktet.

Die Quadro-Grafikkarten bieten zertifizierte Treiber, welche auf Stabiltität und Performance bei professionellen Anwendungen (CAD-, DCC-, Medizin-, Prospektions-, Visualisierungsanwendungen) optimiert sind. Dadurch ist die Performance im Vergleich zu den Consumergrafikkarten mit gleichem Chip in diesen Bereichen deutlich besser.

Features

Der TU102-Chip wird in 12nm gefertigt und bietet eine Reihe neuer Features, wie DLSS (Deep Learning Super Sampling) und Real Time Ray Tracing. Dadurch lassen sich vor allem Beleuchtungseffekte sehr viel realistischer darstellen. Weiterhin gibt es Support für DisplayPort 1.4 (ready), HDMI 2.0b, HDR, Simultaneous Multi-Projection (SMP) sowie H.265 Video De- und Encoding (PlayReady 3.0).

Performance

Durch die verringerten Taktraten bleibt die RTX 6000 für Notebooks etwas hinter der gleichnamigen Desktop GPU zurück. Nvidia selbst gibt and das die Desktop Version 13% schneller ist im Durchschnittswert des SPECviewperf 13 4K.

Der extrem hohe TDP von 200 Watt ermöglicht die nutzung der mobilen Quadro RTX 6000 nur in großen Notebooks mit hervorragender Kühllösung.

NVIDIA T600

► remove from comparison NVIDIA T600

Die Nvidia T600 Desktop ist eine professionelle Grafikkarte für kleine Workstations der Einstiegsklasse. Sie basiert auf dem selben TU117 Turing-Chip wie die Consumer GeForce GTX1650. Jedoch kommt der TU 117 nur mit 640 Shadern und einem 128 Bit Speicherbus daher. Beim verbauten Speicher muss man sich mit den 4-GB-GDDR6 arrangieren  Die TDP ist 40 Watt spezifiziert.

Die professionellen Grafikkarten bieten zertifizierte Treiber, welche auf Stabiltität und Performance bei professionellen Anwendungen (CAD-, DCC-, Medizin-, Prospektions-, Visualisierungsanwendungen) optimiert sind. Dadurch ist die Performance im Vergleich zu den Consumergrafikkarten mit gleichem Chip in diesen Bereichen deutlich besser.

Die kleineren Chips der Turing Serie bietet im Unterschied zu den stärkeren RTX Karten (z.B. Quadro RTX 3000) keine Raytracing und Tensor Kerne. Bei der Turing Architektur gab es auch auf der Ebene der CUDA-Kerne deutliche Verbesserungen. Float und INT Operationen können nun gleichzeitig ausgeführt werden, der Cache wurde vereinheitlicht und verbessert und Adaptive Shading eingeführt. Nvidia spricht dadurch von einer bis zu 50% höheren Leistung pro Kern im Vergleich zu Pascal.

NVIDIA GeForce GTX 1050 Ti Max-QNVIDIA Quadro RTX 6000 (Laptop)NVIDIA T600
Quadro Turing Serie
GeForce GTX 1080 Ti 3584 @ 1.48 - 1.6 GHz352 Bit @ 11000 MHz
GeForce GTX 1080 SLI (Laptop) 5120 @ 1.56 - 1.73 GHz256 Bit @ 10000 MHz
GeForce GTX 1070 SLI (Desktop) 3840 @ 1.51 - 1.68 GHz256 Bit @ 8000 MHz
GeForce GTX 1070 SLI (Laptop) 4096 @ 1.44 - 1.65 GHz256 Bit @ 8000 MHz
GeForce GTX 1080 (Desktop) 2560 @ 1.61 - 1.73 GHz256 Bit @ 10000 MHz
GeForce GTX 1080 Mobile 2560 @ 1.57 - 1.73 GHz256 Bit @ 10000 MHz
GeForce GTX 1070 Ti (Desktop) 2432 @ 1.61 - 1.68 GHz256 Bit @ 8000 MHz
GeForce GTX 1070 (Desktop) 1920 @ 1.51 - 1.68 GHz256 Bit @ 8000 MHz
GeForce GTX 1080 Max-Q 2560 @ 1.1 - 1.28 GHz256 Bit @ 10000 MHz
GeForce GTX 1070 Mobile 2048 @ 1.44 - 1.65 GHz256 Bit @ 8000 MHz
GeForce GTX 1070 Max-Q 2048 @ 1.1 - 1.27 GHz256 Bit @ 8000 MHz
GeForce GTX 1060 (Desktop) 1280 @ 1.51 - 1.71 GHz192 Bit @ 8000 MHz
GeForce GTX 1060 Mobile 1280 @ 1.4 - 1.67 GHz192 Bit @ 8000 MHz
GeForce GTX 1060 Max-Q 1280 @ 1.06 - 1.34 GHz192 Bit @ 8000 MHz
GeForce GTX 1050 Ti Mobile 768 @ 1.49 - 1.62 GHz128 Bit @ 7000 MHz
GeForce GTX 1050 Ti (Desktop) 768 @ 1.29 - 1.39 GHz128 Bit @ 7008 MHz
GeForce GTX 1050 Ti Max-Q 768 @ 1.15 - 1.29 GHz128 Bit @ 7000 MHz
GeForce GTX 1050 (Desktop) 640 @ 1.35 - 1.46 GHz128 Bit @ 7008 MHz
GeForce GTX 1050 Mobile 640 @ 1.35 - 1.49 GHz128 Bit @ 7000 MHz
GeForce GTX 1050 Max-Q 640 @ 1 - 1.14 GHz128 Bit @ 7000 MHz
GeForce GT 1030 (Desktop) 384 @ 1.23 - 1.67 GHz64 Bit @ 6000 MHz
Quadro RTX 6000 (Laptop) 4608 @ 1.28 - 1.46 GHz384 Bit @ 14000 MHz
Quadro RTX 5000 (Laptop) 3072 @ 1.04 - 1.55 GHz256 Bit @ 14000 MHz
Quadro RTX 5000 Max-Q 3072 @ 0.6 - 1.35 GHz256 Bit @ 14000 MHz
Quadro RTX 4000 (Laptop) 2560 @ 1.11 - 1.56 GHz256 Bit @ 14000 MHz
Quadro RTX 4000 Max-Q 2560 @ 0.78 - 1.38 GHz256 Bit @ 14000 MHz
Quadro RTX 3000 (Laptop) 1920 @ 0.95 - 1.38 GHz192 Bit @ 14000 MHz
Quadro RTX 3000 Max-Q 1920 @ 0.6 - 1.22 GHz192 Bit @ 14000 MHz
Quadro T2000 (Laptop) 1024 @ 1.58 - 1.79 GHz128 Bit @ 8000 MHz
Quadro T2000 Max-Q 1024 @ 0.93 - 1.5 GHz128 Bit @ 8000 MHz
T1000 896 @ 1.07 - 1.4 GHz128 Bit @ 10000 MHz
T1200 Laptop GPU 1024 @ 0.86 - 1.43 GHz128 Bit @ 10000 MHz
Quadro T1000 (Laptop) 768 @ 1.4 - 1.46 GHz128 Bit @ 8000 MHz
Quadro T1000 Max-Q 768 @ 0.8 - 1.46 GHz128 Bit @ 8000 MHz
T600 Laptop GPU 896 @ 1.4 GHz128 Bit @ 10000 MHz
T550 Laptop GPU 1024 @ 1.07 - 1.67 GHz64 Bit @ 12000 MHz
T500 Laptop GPU 896 @ 1.37 - 1.7 GHz64 Bit @ 10000 MHz
T600 640 @ 0.74 - 1.34 GHz128 Bit @ 10000 MHz
CodenameN17P-G1 Max-QTU102
ArchitekturPascalTuringTuring
Pipelines768 - unified4608 - unified640 - unified
Kerntakt1151 – 1290 - 1290 – 1417 (Boost) MHz1275 - 1455 (Boost) MHz735 - 1335 (Boost) MHz
Speichertakt7000 MHz14000 MHz10000 effective = 1250 MHz
Speicherbandbreite128 Bit384 Bit128 Bit
SpeichertypGDDR5GDDR6GDDR6
Max. Speichergröße4 GB24 GB4 GB
Shared Memoryneinneinnein
APIDirectX 12_1, OpenGL 4.5DirectX 12_1, OpenGL 4.6DirectX 12_1, Shader 6.6, OpenGL 4.6, OpenCL 3.0, Vulkan 1.3
Stromverbrauch40 - 46 Watt200 Watt40 Watt
Herstellungsprozess16 nm12 nm12 nm
FeaturesMulti-Projection, VR Ready, G-SYNC, Vulkan, Multi MonitorNVLink, DLSS, Raytraycing, VR Ready, G-SYNC, Vulkan, Multi Monitor
Notebookgrößemittel (15.4" z.B.)groß (17" z.B.)
Erscheinungsdatum03.01.2018 04.09.2019 12.04.2021
Herstellerseitewww.nvidia.com
Transistors18.6 Billion4.7 Billion
TMUs40
ROPs32
Memory Bandwidth160 GB/s
Die Size 200 mm²
PCIe3.0 x16
Displays4 Displays (max.), DisplayPort 4x mini-DisplayPort 1.4a

Benchmarks

Performance Rating - 3DMark 11 + Fire Strike + Time Spy - GeForce GTX 1050 Ti Max-Q
3.3 pt (10%)
Performance Rating - 3DMark 11 + Fire Strike + Time Spy - T600
3 pt (9%)
3DMark - 3DMark Time Spy Score
min: 2361     avg: 2453     median: 2485 (7%)     max: 2513 Points
11084 Points (32%)
100%
T600 +
2496 Points (7%)
3DMark - 3DMark Time Spy Graphics
min: 2196     avg: 2245     median: 2261 (6%)     max: 2278 Points
97%
1 T600 +
2195 Points (6%)
3DMark - 3DMark Ice Storm Unlimited Graphics
324705 Points (33%)
94%
1 T600 +
304731 Points (31%)
3DMark - 3DMark Ice Storm Extreme Graphics
39641 Points (5%)
386%
1 T600 +
152912 Points (19%)
3DMark - 3DMark Cloud Gate Score
min: 20755     avg: 24100     median: 24021 (26%)     max: 28253 Points
133%
1 T600 +
31922 Points (34%)
3DMark - 3DMark Cloud Gate Graphics
min: 41871     avg: 46017     median: 46952 (12%)     max: 50801 Points
87%
1 T600 +
40917 Points (11%)
3DMark - 3DMark Fire Strike Standard Score
min: 6175     avg: 6548     median: 6688 (12%)     max: 6753 Points
94%
1 T600 +
6284 Points (11%)
3DMark - 3DMark Fire Strike Standard Graphics
min: 6957     avg: 7281     median: 7324 (8%)     max: 7428 Points
89%
1 T600 +
6552 Points (7%)
3DMark - 3DMark Ice Storm Graphics
min: 41029     avg: 73224     median: 60442 (7%)     max: 118202 Points
302%
1 T600 +
182459 Points (21%)
3DMark 11 - 3DM11 Performance Score
min: 8250     avg: 8936     median: 9106 (13%)     max: 9414 Points
104%
1 T600 +
9497 Points (13%)
3DMark 11 - 3DM11 Performance GPU
min: 8317     avg: 8781     median: 8752 (8%)     max: 9079 Points
99%
1 T600 +
8694 Points (7%)
3DMark Vantage
3DM Vant. Perf. total + NVIDIA GeForce GTX 1050 Ti Max-Q
3DMark Vantage - 3DM Vant. Perf. total
min: 24827     avg: 29504     median: 29503.5 (9%)     max: 34180 Points
3DM Vant. Perf. total + NVIDIA T600
1169%
1 T600 +
344838 Points (100%)
3DM Vant. Perf. GPU no PhysX + NVIDIA GeForce GTX 1050 Ti Max-Q
3DMark Vantage - 3DM Vant. Perf. GPU no PhysX
min: 25707     avg: 29448     median: 29448 (16%)     max: 33189 Points
3DM Vant. Perf. GPU no PhysX + NVIDIA T600
103%
1 T600 +
30400 Points (17%)
3DMark 05 - 3DMark 05 - Standard
100%
1 T600 +
46380 Points (51%)
3DMark 06 3DMark 06 - Standard 1280x1024 + NVIDIA GeForce GTX 1050 Ti Max-Q
3DMark 06
min: 26796     avg: 28797     median: 28797 (38%)     max: 30798 Points
3DMark 06 - Standard 1280x1024 + NVIDIA T600
153%
1 T600 +
43997 Points (57%)
3DMark 06 - Standard 1024x768 + NVIDIA GeForce GTX 1050 Ti Max-Q
3DMark 06
34786 Points (45%)
Unigine Valley 1.0 - Unigine Valley 1.0 DX
40.1 fps (12%)
82%
1 T600 +
32.7 fps (10%)
Unigine Heaven 2.1 - Heaven 2.1 high
86 fps (16%)
SPECviewperf 12
specvp12 sw-03 + NVIDIA T600
SPECviewperf 12 - specvp12 sw-03
100%
1 T600 +
115 fps (29%)
specvp12 snx-02 + NVIDIA T600
SPECviewperf 12 - specvp12 snx-02
100%
1 T600 +
68.6 fps (10%)
specvp12 showcase-01 + NVIDIA T600
SPECviewperf 12 - specvp12 showcase-01
100%
1 T600 +
35.3 fps (8%)
specvp12 mediacal-01 + NVIDIA T600
SPECviewperf 12 - specvp12 mediacal-01
100%
1 T600 +
19.5 fps (5%)
specvp12 maya-04 + NVIDIA T600
SPECviewperf 12 - specvp12 maya-04
100%
1 T600 +
67.4 fps (18%)
specvp12 energy-01 + NVIDIA T600
SPECviewperf 12 - specvp12 energy-01
100%
1 T600 +
5 fps (4%)
specvp12 creo-01 + NVIDIA T600
SPECviewperf 12 - specvp12 creo-01
100%
1 T600 +
78.5 fps (31%)
specvp12 catia-04 + NVIDIA T600
SPECviewperf 12 - specvp12 catia-04
100%
1 T600 +
76.9 fps (13%)
specvp12 3dsmax-05 + NVIDIA T600
SPECviewperf 12 - specvp12 3dsmax-05
100%
1 T600 +
80 fps (14%)
SPECviewperf 13 specvp13 sw-04 + NVIDIA Quadro RTX 6000 (Laptop)
SPECviewperf 13 - specvp13 sw-04
217 fps (58%)
specvp13 sw-04 + NVIDIA T600
53%
1 T600 +
114 fps (31%)
specvp13 3dsmax-06 + NVIDIA Quadro RTX 6000 (Laptop)
SPECviewperf 13 - specvp13 3dsmax-06
217 fps (38%)
specvp13 3dsmax-06 + NVIDIA T600
37%
1 T600 +
79.9 fps (14%)
specvp13 snx-03 + NVIDIA T600
SPECviewperf 13 - specvp13 snx-03
100%
1 T600 +
122 fps (14%)
specvp13 showcase-02 + NVIDIA T600
SPECviewperf 13 - specvp13 showcase-02
100%
1 T600 +
34.9 fps (8%)
specvp13 medical-02 + NVIDIA T600
SPECviewperf 13 - specvp13 medical-02
100%
1 T600 +
35.7 fps (7%)
specvp13 maya-05 + NVIDIA T600
SPECviewperf 13 - specvp13 maya-05
100%
1 T600 +
99.8 fps (11%)
specvp13 energy-02 + NVIDIA T600
SPECviewperf 13 - specvp13 energy-02
100%
1 T600 +
12.6 fps (4%)
specvp13 creo-02 + NVIDIA T600
SPECviewperf 13 - specvp13 creo-02
100%
1 T600 +
98 fps (14%)
SPECviewperf 2020 specvp2020 solidworks-05 4k + NVIDIA T600
SPECviewperf 2020 - specvp2020 solidworks-05 4k
100%
1 T600 +
16.9 fps (5%)
specvp2020 snx-04 4k + NVIDIA T600
SPECviewperf 2020 - specvp2020 snx-04 4k
100%
1 T600 +
75.6 fps (8%)
specvp2020 medical-03 4k + NVIDIA T600
SPECviewperf 2020 - specvp2020 medical-03 4k
100%
1 T600 +
4.5 fps (4%)
specvp2020 maya-06 4k + NVIDIA T600
SPECviewperf 2020 - specvp2020 maya-06 4k
100%
1 T600 +
46.1 fps (8%)
specvp2020 energy-03 4k + NVIDIA T600
SPECviewperf 2020 - specvp2020 energy-03 4k
100%
1 T600 +
6.7 fps (1%)
specvp2020 creo-03 4k + NVIDIA T600
SPECviewperf 2020 - specvp2020 creo-03 4k
100%
1 T600 +
32.3 fps (15%)
specvp2020 catia-06 4k + NVIDIA T600
SPECviewperf 2020 - specvp2020 catia-06 4k
100%
1 T600 +
13.8 fps (9%)
specvp2020 3dsmax-07 4k + NVIDIA T600
SPECviewperf 2020 - specvp2020 3dsmax-07 4k
100%
1 T600 +
19.4 fps (8%)
Cinebench R10 Cinebench R10 Shading (32bit) + NVIDIA GeForce GTX 1050 Ti Max-Q
Cinebench R10 - Cinebench R10 Shading (32bit)
min: 4597     avg: 5340     median: 4972 (4%)     max: 6451 Points
Cinebench R10 Shading (32bit) + NVIDIA T600
137%
1 T600 +
6830 Points (5%)
Cinebench R11.5 Cinebench R11.5 OpenGL 64 Bit + NVIDIA GeForce GTX 1050 Ti Max-Q
Cinebench R11.5 - Cinebench R11.5 OpenGL 64 Bit
min: 66.9     avg: 71.7     median: 71.7 (24%)     max: 76.5 fps
Cinebench R11.5 OpenGL 64 Bit + NVIDIA T600
145%
1 T600 +
104.1 fps (34%)
Cinebench R15
Cinebench R15 OpenGL 64 Bit + NVIDIA GeForce GTX 1050 Ti Max-Q
Cinebench R15 - Cinebench R15 OpenGL 64 Bit
min: 92.1     avg: 105.4     median: 102 (6%)     max: 120.7 fps
Cinebench R15 OpenGL 64 Bit + NVIDIA T600
223%
1 T600 +
227.1 fps (13%)
Cinebench R15 OpenGL Ref. Match 64 Bit + NVIDIA GeForce GTX 1050 Ti Max-Q
Cinebench R15 - Cinebench R15 OpenGL Ref. Match 64 Bit
99.6 % (100%)
Cinebench R15 OpenGL Ref. Match 64 Bit + NVIDIA T600
100%
1 T600 +
99.6 % (100%)
GFXBench - GFXBench 5.0 Aztec Ruins High Tier Offscreen
49.5 fps (9%)
GFXBench - GFXBench 5.0 Aztec Ruins Normal Tier Offscreen
119.1 fps (9%)
GFXBench - GFXBench Car Chase Offscreen
min: 108.8     avg: 124.2     median: 124.2 (14%)     max: 139.5 fps
GFXBench 3.1 - GFXBench Manhattan ES 3.1 Offscreen
min: 168     avg: 184.9     median: 184.9 (4%)     max: 201.7 fps
GFXBench 3.0 - GFXBench 3.0 Manhattan Offscreen
min: 229.8     avg: 253.2     median: 253.2 (15%)     max: 276.5 fps
GFXBench (DX / GLBenchmark) 2.7
GFXBench T-Rex HD Offscreen C24Z16 + NVIDIA GeForce GTX 1050 Ti Max-Q
GFXBench (DX / GLBenchmark) 2.7 - GFXBench T-Rex HD Offscreen C24Z16
min: 501     avg: 531     median: 531 (4%)     max: 561 fps
LuxMark v2.0 64Bit - LuxMark v2.0 Room GPU
min: 1167     avg: 1201     median: 1200.5 (5%)     max: 1234 Samples/s
93%
1 T600 +
1121 Samples/s (5%)
LuxMark v2.0 64Bit - LuxMark v2.0 Sala GPU
min: 2100     avg: 2222     median: 2221.5 (4%)     max: 2343 Samples/s
92%
1 T600 +
2049 Samples/s (4%)
ComputeMark v2.1 - ComputeMark v2.1 Result
min: 4515     avg: 4879     median: 4879 (5%)     max: 5243 Points
99%
1 T600 +
4825 Points (5%)
Power Consumption - Furmark Stress Test Power Consumption - external Monitor *
73.1 Watt (10%)
95%
1 T600 +
76.7 Watt (11%)
Power Consumption - The Witcher 3 Power Consumption - external Monitor *
75.8 Watt (11%)
91%
1 T600 +
83.5 Watt (12%)
Power Consumption - Witcher 3 Power Consumption *
min: 82     avg: 90     median: 85 (19%)     max: 103 Watt
Power Consumption - Witcher 3 ultra Power Efficiency
min: 0.2379     avg: 0.3     median: 0.3 (26%)     max: 0.3073 fps per Watt
Power Consumption - Witcher 3 ultra Power Efficiency - external Monitor
0.3 fps per Watt (27%)
99%
1 T600 +
0.3 fps per Watt (27%)
Emissions Witcher 3 Fan Noise + NVIDIA GeForce GTX 1050 Ti Max-Q
Emissions - Witcher 3 Fan Noise
min: 36.4     avg: 40.2     median: 38.4 (61%)     max: 47.6 dB(A)
Clock Speed - GPU Clock Witcher 3 ultra
1392 MHz (55%)

Average Benchmarks NVIDIA GeForce GTX 1050 Ti Max-Q → 100% n=1

Average Benchmarks NVIDIA Quadro RTX 6000 (Laptop) → 446% n=1

Average Benchmarks NVIDIA T600 → 100% n=1

- Bereich der Benchmarkergebnisse für diese Grafikkarte
- Durchschnittliche Benchmarkergebnisse für diese Grafikkarte
* Smaller numbers mean a higher performance
1 This benchmark is not used for the average calculation

Spiele-Benchmarks

Die folgenden Benchmarks basieren auf unseren Spieletests mit Testnotebooks. Die Performance dieser Grafikkarte bei den gelisteten Spielen ist abhängig von der verwendeten CPU, Speicherausstattung, Treiber und auch Betriebssystem. Dadurch müssen die untenstehenden Werte nicht repräsentativ sein. Detaillierte Informationen über das verwendete System sehen Sie nach einem Klick auf den fps-Wert.

Far Cry 6

Far Cry 6

2021
low 1280x720
T600:
93.5  fps
med. 1920x1080
T600:
44.6  fps
high 1920x1080
T600:
21.3  fps
ultra 1920x1080
T600:
6.3  fps
F1 2021

F1 2021

2021
low 1280x720
T600:
171.9  fps
med. 1920x1080
T600:
78.8  fps
high 1920x1080
T600:
63.7  fps
ultra 1920x1080
T600:
40.2  fps
QHD 2560x1440
T600:
29.1  fps
4K 3840x2160
T600:
15.7  fps
F1 2020

F1 2020

2020
low 1280x720
T600:
150.4  fps
med. 1920x1080
T600:
73.1  fps
high 1920x1080
T600:
55.5  fps
ultra 1920x1080
T600:
38.6  fps
QHD 2560x1440
T600:
27  fps
4K 3840x2160
T600:
14.5  fps
low 1280x720
T600:
107.6  fps
med. 1920x1080
T600:
42  fps
high 1920x1080
T600:
26.7  fps
ultra 1920x1080
T600:
19.9  fps
QHD 2560x1440
T600:
13.4  fps
4K 3840x2160
T600:
5.5  fps
low 1280x720
100%
GeForce GTX 1050 Ti Max-Q:
133.2  fps
med. 1920x1080
100%
GeForce GTX 1050 Ti Max-Q:
56.7  fps
high 1920x1080
100%
GeForce GTX 1050 Ti Max-Q:
44.3  fps
ultra 1920x1080
100%
GeForce GTX 1050 Ti Max-Q:
27.2  fps
4K 3840x2160
100%
GeForce GTX 1050 Ti Max-Q:
11.3  fps
Anthem

Anthem

2019
low 1280x720
100%
GeForce GTX 1050 Ti Max-Q:
67.1  fps
med. 1920x1080
100%
GeForce GTX 1050 Ti Max-Q:
40.5  fps
high 1920x1080
100%
GeForce GTX 1050 Ti Max-Q:
34  fps
ultra 1920x1080
100%
GeForce GTX 1050 Ti Max-Q:
30.4  fps
4K 3840x2160
100%
GeForce GTX 1050 Ti Max-Q:
9  fps
low 1280x720
100%
GeForce GTX 1050 Ti Max-Q:
83 89 ~ 86 fps
med. 1920x1080
100%
GeForce GTX 1050 Ti Max-Q:
47 50 ~ 49 fps
high 1920x1080
100%
GeForce GTX 1050 Ti Max-Q:
43 46 ~ 45 fps
ultra 1920x1080
100%
GeForce GTX 1050 Ti Max-Q:
40 43 ~ 42 fps
QHD 2560x1440
100%
GeForce GTX 1050 Ti Max-Q:
29  fps
4K 3840x2160
100%
GeForce GTX 1050 Ti Max-Q:
14 15 ~ 15 fps
low 1280x720
100%
GeForce GTX 1050 Ti Max-Q:
55.5 60.4 ~ 58 fps
129%
T600:
74.6  fps
med. 1920x1080
100%
GeForce GTX 1050 Ti Max-Q:
31.4 49.8 ~ 41 fps
83%
T600:
34  fps
high 1920x1080
100%
GeForce GTX 1050 Ti Max-Q:
23.5 36.5 ~ 30 fps
80%
T600:
24  fps
ultra 1920x1080
100%
GeForce GTX 1050 Ti Max-Q:
19.3 28.3 ~ 24 fps
81%
T600:
19.4  fps
QHD 2560x1440
T600:
14.8  fps
4K 3840x2160
100%
GeForce GTX 1050 Ti Max-Q:
4.7  fps
180%
T600:
8.5  fps
low 1280x720
100%
GeForce GTX 1050 Ti Max-Q:
73.2  fps
med. 1920x1080
100%
GeForce GTX 1050 Ti Max-Q:
47.9  fps
high 1920x1080
100%
GeForce GTX 1050 Ti Max-Q:
36.1  fps
ultra 1920x1080
100%
GeForce GTX 1050 Ti Max-Q:
35.3  fps
4K 3840x2160
100%
GeForce GTX 1050 Ti Max-Q:
12.9  fps
low 1280x720
100%
GeForce GTX 1050 Ti Max-Q:
134.5  fps
med. 1920x1080
100%
GeForce GTX 1050 Ti Max-Q:
87.4  fps
high 1920x1080
100%
GeForce GTX 1050 Ti Max-Q:
73.7  fps
ultra 1920x1080
100%
GeForce GTX 1050 Ti Max-Q:
65  fps
4K 3840x2160
100%
GeForce GTX 1050 Ti Max-Q:
13.2  fps
low 1280x720
100%
GeForce GTX 1050 Ti Max-Q:
100.1  fps
med. 1920x1080
100%
GeForce GTX 1050 Ti Max-Q:
57.3  fps
high 1920x1080
100%
GeForce GTX 1050 Ti Max-Q:
47.9  fps
ultra 1920x1080
100%
GeForce GTX 1050 Ti Max-Q:
44.8  fps
4K 3840x2160
100%
GeForce GTX 1050 Ti Max-Q:
17.3  fps
low 1280x720
100%
GeForce GTX 1050 Ti Max-Q:
193.6  fps
med. 1920x1080
100%
GeForce GTX 1050 Ti Max-Q:
128.7  fps
high 1920x1080
100%
GeForce GTX 1050 Ti Max-Q:
80.5  fps
ultra 1920x1080
100%
GeForce GTX 1050 Ti Max-Q:
61  fps
4K 3840x2160
100%
GeForce GTX 1050 Ti Max-Q:
22  fps
Hitman 2

Hitman 2

2018
low 1280x720
100%
GeForce GTX 1050 Ti Max-Q:
64.8  fps
med. 1920x1080
100%
GeForce GTX 1050 Ti Max-Q:
41  fps
high 1920x1080
100%
GeForce GTX 1050 Ti Max-Q:
37.5  fps
ultra 1920x1080
100%
GeForce GTX 1050 Ti Max-Q:
35.9  fps
4K 3840x2160
100%
GeForce GTX 1050 Ti Max-Q:
11.3  fps
low 1280x720
100%
GeForce GTX 1050 Ti Max-Q:
118.7  fps
med. 1920x1080
100%
GeForce GTX 1050 Ti Max-Q:
46.3  fps
high 1920x1080
100%
GeForce GTX 1050 Ti Max-Q:
45  fps
ultra 1920x1080
100%
GeForce GTX 1050 Ti Max-Q:
37.5  fps
4K 3840x2160
100%
GeForce GTX 1050 Ti Max-Q:
10.1  fps
low 1280x720
100%
GeForce GTX 1050 Ti Max-Q:
67  fps
med. 1920x1080
100%
GeForce GTX 1050 Ti Max-Q:
43  fps
high 1920x1080
100%
GeForce GTX 1050 Ti Max-Q:
34  fps
ultra 1920x1080
100%
GeForce GTX 1050 Ti Max-Q:
18  fps
4K 3840x2160
100%
GeForce GTX 1050 Ti Max-Q:
7  fps
low 1280x720
100%
GeForce GTX 1050 Ti Max-Q:
122  fps
med. 1920x1080
100%
GeForce GTX 1050 Ti Max-Q:
67  fps
high 1920x1080
100%
GeForce GTX 1050 Ti Max-Q:
61  fps
ultra 1920x1080
100%
GeForce GTX 1050 Ti Max-Q:
47  fps
4K 3840x2160
100%
GeForce GTX 1050 Ti Max-Q:
20  fps
low 1280x720
100%
GeForce GTX 1050 Ti Max-Q:
97  fps
med. 1920x1080
100%
GeForce GTX 1050 Ti Max-Q:
39  fps
high 1920x1080
100%
GeForce GTX 1050 Ti Max-Q:
35  fps
ultra 1920x1080
100%
GeForce GTX 1050 Ti Max-Q:
29  fps
4K 3840x2160
100%
GeForce GTX 1050 Ti Max-Q:
11  fps
Strange Brigade

Strange Brigade

2018
low 1280x720
T600:
174.4  fps
med. 1920x1080
T600:
64.9  fps
high 1920x1080
T600:
51.4  fps
ultra 1920x1080
T600:
44.8  fps
QHD 2560x1440
T600:
31.9  fps
4K 3840x2160
T600:
17.9  fps
F1 2018

F1 2018

2018
low 1280x720
100%
GeForce GTX 1050 Ti Max-Q:
134  fps
med. 1920x1080
100%
GeForce GTX 1050 Ti Max-Q:
80  fps
high 1920x1080
100%
GeForce GTX 1050 Ti Max-Q:
62  fps
ultra 1920x1080
100%
GeForce GTX 1050 Ti Max-Q:
38  fps
4K 3840x2160
100%
GeForce GTX 1050 Ti Max-Q:
17  fps
low 1280x720
100%
GeForce GTX 1050 Ti Max-Q:
100.3  fps
med. 1920x1080
100%
GeForce GTX 1050 Ti Max-Q:
39.2  fps
high 1920x1080
100%
GeForce GTX 1050 Ti Max-Q:
34.9  fps
ultra 1920x1080
100%
GeForce GTX 1050 Ti Max-Q:
26.8  fps
4K 3840x2160
100%
GeForce GTX 1050 Ti Max-Q:
8.3  fps
low 1280x720
100%
GeForce GTX 1050 Ti Max-Q:
60  fps
med. 1920x1080
100%
GeForce GTX 1050 Ti Max-Q:
49.1  fps
high 1920x1080
100%
GeForce GTX 1050 Ti Max-Q:
45.3  fps
ultra 1920x1080
100%
GeForce GTX 1050 Ti Max-Q:
42  fps
4K 3840x2160
100%
GeForce GTX 1050 Ti Max-Q:
14  fps
Far Cry 5

Far Cry 5

2018
low 1280x720
100%
GeForce GTX 1050 Ti Max-Q:
76 91 91 ~ 86 fps
110%
T600:
95  fps
med. 1920x1080
100%
GeForce GTX 1050 Ti Max-Q:
45 48 48 ~ 47 fps
98%
T600:
46  fps
high 1920x1080
100%
GeForce GTX 1050 Ti Max-Q:
41 44 44 ~ 43 fps
98%
T600:
42  fps
ultra 1920x1080
100%
GeForce GTX 1050 Ti Max-Q:
38 38 41 ~ 39 fps
100%
T600:
39  fps
QHD 2560x1440
T600:
26  fps
4K 3840x2160
100%
GeForce GTX 1050 Ti Max-Q:
13 13 14 ~ 13 fps
92%
T600:
12  fps
low 1280x720
100%
GeForce GTX 1050 Ti Max-Q:
92.7  fps
143%
T600:
132.8  fps
med. 1920x1080
100%
GeForce GTX 1050 Ti Max-Q:
80.3  fps
133%
T600:
107  fps
high 1920x1080
100%
GeForce GTX 1050 Ti Max-Q:
69.4  fps
138%
T600:
95.9  fps
4K 3840x2160
100%
GeForce GTX 1050 Ti Max-Q:
39.5  fps
103%
T600:
40.8  fps
low 1280x720
100%
GeForce GTX 1050 Ti Max-Q:
61.5 75.1 ~ 68 fps
104%
T600:
70.7  fps
med. 1920x1080
100%
GeForce GTX 1050 Ti Max-Q:
36.6 37.7 ~ 37 fps
94%
T600:
34.9  fps
high 1920x1080
100%
GeForce GTX 1050 Ti Max-Q:
23.3 25 ~ 24 fps
105%
T600:
25.1  fps
QHD 2560x1440
T600:
17.8  fps
4K 3840x2160
100%
GeForce GTX 1050 Ti Max-Q:
9.2  fps
108%
T600:
10  fps
low 1280x720
100%
GeForce GTX 1050 Ti Max-Q:
92.3  fps
med. 1920x1080
100%
GeForce GTX 1050 Ti Max-Q:
42  fps
high 1920x1080
100%
GeForce GTX 1050 Ti Max-Q:
34.3  fps
ultra 1920x1080
100%
GeForce GTX 1050 Ti Max-Q:
30.4  fps
low 1280x720
100%
GeForce GTX 1050 Ti Max-Q:
58  fps
med. 1920x1080
100%
GeForce GTX 1050 Ti Max-Q:
41  fps
high 1920x1080
100%
GeForce GTX 1050 Ti Max-Q:
33  fps
ultra 1920x1080
100%
GeForce GTX 1050 Ti Max-Q:
27  fps
4K 3840x2160
100%
GeForce GTX 1050 Ti Max-Q:
13  fps
Destiny 2

Destiny 2

2017
low 1280x720
100%
GeForce GTX 1050 Ti Max-Q:
119.5  fps
med. 1920x1080
100%
GeForce GTX 1050 Ti Max-Q:
69.4  fps
high 1920x1080
100%
GeForce GTX 1050 Ti Max-Q:
64.3  fps
ultra 1920x1080
100%
GeForce GTX 1050 Ti Max-Q:
57.9  fps
4K 3840x2160
100%
GeForce GTX 1050 Ti Max-Q:
18.9  fps
low 1280x720
100%
GeForce GTX 1050 Ti Max-Q:
105  fps
med. 1920x1080
100%
GeForce GTX 1050 Ti Max-Q:
55  fps
high 1920x1080
100%
GeForce GTX 1050 Ti Max-Q:
41  fps
ultra 1920x1080
100%
GeForce GTX 1050 Ti Max-Q:
31  fps
4K 3840x2160
100%
GeForce GTX 1050 Ti Max-Q:
13  fps
low 1280x720
100%
GeForce GTX 1050 Ti Max-Q:
129.8  fps
med. 1366x768
100%
GeForce GTX 1050 Ti Max-Q:
123.6  fps
high 1920x1080
100%
GeForce GTX 1050 Ti Max-Q:
115.7  fps
ultra 1920x1080
100%
GeForce GTX 1050 Ti Max-Q:
112.6  fps
4K 3820x2160
100%
GeForce GTX 1050 Ti Max-Q:
65.2  fps
low 1280x720
100%
GeForce GTX 1050 Ti Max-Q:
249.1  fps
med. 1920x1080
100%
GeForce GTX 1050 Ti Max-Q:
169.1  fps
high 1920x1080
100%
GeForce GTX 1050 Ti Max-Q:
112.5  fps
4K 3840x2160
100%
GeForce GTX 1050 Ti Max-Q:
42.3  fps
Prey

Prey

2017
low 1280x720
100%
GeForce GTX 1050 Ti Max-Q:
142.4  fps
med. 1920x1080
100%
GeForce GTX 1050 Ti Max-Q:
85.6  fps
high 1920x1080
100%
GeForce GTX 1050 Ti Max-Q:
68.3  fps
ultra 1920x1080
100%
GeForce GTX 1050 Ti Max-Q:
58.9  fps
4K 3840x2160
100%
GeForce GTX 1050 Ti Max-Q:
21.7  fps
low 1280x720
100%
GeForce GTX 1050 Ti Max-Q:
68.6 96.7 ~ 83 fps
med. 1920x1080
100%
GeForce GTX 1050 Ti Max-Q:
39.3 42.7 45.9 ~ 43 fps
high 1920x1080
100%
GeForce GTX 1050 Ti Max-Q:
35.3 40 41.9 ~ 39 fps
ultra 1920x1080
100%
GeForce GTX 1050 Ti Max-Q:
19.1 22.4 23.4 ~ 22 fps
4K 3840x2160
100%
GeForce GTX 1050 Ti Max-Q:
13.9 14.5 ~ 14 fps
For Honor

For Honor

2017
low 1280x720
100%
GeForce GTX 1050 Ti Max-Q:
113.6 179.3 ~ 146 fps
med. 1920x1080
100%
GeForce GTX 1050 Ti Max-Q:
63.8 68.2 ~ 66 fps
high 1920x1080
100%
GeForce GTX 1050 Ti Max-Q:
64.9 65.5 ~ 65 fps
ultra 1920x1080
100%
GeForce GTX 1050 Ti Max-Q:
49.5 50.4 ~ 50 fps
4K 3840x2160
100%
GeForce GTX 1050 Ti Max-Q:
19.2 19.2 ~ 19 fps
high 1920x1080
100%
GeForce GTX 1050 Ti Max-Q:
137.3  fps
ultra 1920x1080
100%
GeForce GTX 1050 Ti Max-Q:
104.6  fps
low 1280x720
100%
GeForce GTX 1050 Ti Max-Q:
89.5 154.8 ~ 122 fps
med. 1366x768
100%
GeForce GTX 1050 Ti Max-Q:
85.2 120 ~ 103 fps
high 1920x1080
100%
GeForce GTX 1050 Ti Max-Q:
51.7 58.1 ~ 55 fps
ultra 1920x1080
100%
GeForce GTX 1050 Ti Max-Q:
49.8 53.1 ~ 51 fps
4K 3840x2160
100%
GeForce GTX 1050 Ti Max-Q:
20.7 21.1 ~ 21 fps
low 1024x768
100%
GeForce GTX 1050 Ti Max-Q:
112.5  fps
med. 1366x768
100%
GeForce GTX 1050 Ti Max-Q:
85.8  fps
high 1920x1080
100%
GeForce GTX 1050 Ti Max-Q:
51  fps
ultra 1920x1080
100%
GeForce GTX 1050 Ti Max-Q:
43  fps
Overwatch

Overwatch

2016
low 1280x720
100%
GeForce GTX 1050 Ti Max-Q:
285.4  fps
med. 1366x768
100%
GeForce GTX 1050 Ti Max-Q:
233.9  fps
high 1920x1080
100%
GeForce GTX 1050 Ti Max-Q:
117.7  fps
ultra 1920x1080
100%
GeForce GTX 1050 Ti Max-Q:
70.5  fps
4K 3840x2160
100%
GeForce GTX 1050 Ti Max-Q:
37  fps
low 1280x768
100%
GeForce GTX 1050 Ti Max-Q:
63  fps
med. 1920x1080
100%
GeForce GTX 1050 Ti Max-Q:
41.3  fps
high 1920x1080
100%
GeForce GTX 1050 Ti Max-Q:
35.8  fps
4K 3840x2160
100%
GeForce GTX 1050 Ti Max-Q:
15.7  fps
low 1280x720
100%
GeForce GTX 1050 Ti Max-Q:
114.2 137.2 ~ 126 fps
med. 1366x768
100%
GeForce GTX 1050 Ti Max-Q:
83.4 89.5 ~ 86 fps
high 1920x1080
100%
GeForce GTX 1050 Ti Max-Q:
41.9 42.5 ~ 42 fps
ultra 1920x1080
100%
GeForce GTX 1050 Ti Max-Q:
32.2 34.8 ~ 34 fps
4K 3840x2160
100%
GeForce GTX 1050 Ti Max-Q:
14.6 15.7 ~ 15 fps
low 1024x768
100%
GeForce GTX 1050 Ti Max-Q:
99.9 118.3 141.1 141.7 ~ 125 fps
med. 1366x768
100%
GeForce GTX 1050 Ti Max-Q:
67.6 73.6 82.9 85.7 ~ 77 fps
high 1920x1080
100%
GeForce GTX 1050 Ti Max-Q:
38.8 47.3 47.4 47.7 ~ 45 fps
ultra 1920x1080
100%
GeForce GTX 1050 Ti Max-Q:
31.7 39.5 39.9 40.5 ~ 38 fps
4K 3840x2160
100%
GeForce GTX 1050 Ti Max-Q:
16.8 17.1 ~ 17 fps
low 1024x768
100%
GeForce GTX 1050 Ti Max-Q:
236.6 263.6 ~ 250 fps
med. 1366x768
100%
GeForce GTX 1050 Ti Max-Q:
154.6 162.2 ~ 158 fps
high 1920x1080
100%
GeForce GTX 1050 Ti Max-Q:
90.2 92.7 ~ 91 fps
ultra 1920x1080
100%
GeForce GTX 1050 Ti Max-Q:
62.5 67.5 ~ 65 fps
4K 3840x2160
100%
GeForce GTX 1050 Ti Max-Q:
27.7 29.3 ~ 29 fps
low 1366x768
100%
GeForce GTX 1050 Ti Max-Q:
168.6  fps
med. 1366x768
100%
GeForce GTX 1050 Ti Max-Q:
143.9  fps
high 1920x1080
100%
GeForce GTX 1050 Ti Max-Q:
112.7  fps
ultra 1920x1080
100%
GeForce GTX 1050 Ti Max-Q:
101  fps
4K 3840 x 2160
100%
GeForce GTX 1050 Ti Max-Q:
34.4  fps
low 1280x720
100%
GeForce GTX 1050 Ti Max-Q:
111.9  fps
145%
T600:
162.8  fps
med. 1366x768
100%
GeForce GTX 1050 Ti Max-Q:
104.2  fps
143%
T600:
148.6  fps
high 1920x1080
100%
GeForce GTX 1050 Ti Max-Q:
98.1  fps
123%
T600:
120.7  fps
ultra 1920x1080
100%
GeForce GTX 1050 Ti Max-Q:
93.5  fps
118%
T600:
110.5  fps
4K 3840x2160
100%
GeForce GTX 1050 Ti Max-Q:
46  fps
86%
T600:
39.6  fps
low 1024x768
100%
GeForce GTX 1050 Ti Max-Q:
122 130.7 130.9 131.3 138.6 145 ~ 133 fps
105%
T600:
139.1  fps
med. 1366x768
100%
GeForce GTX 1050 Ti Max-Q:
73.2 76.6 80.9 82.6 87.2 99 ~ 83 fps
100%
T600:
82.8  fps
high 1920x1080
100%
GeForce GTX 1050 Ti Max-Q:
42.6 44.2 45.1 46 48.2 60 ~ 48 fps
99%
T600:
47.5  fps
ultra 1920x1080
100%
GeForce GTX 1050 Ti Max-Q:
23.5 24.5 24.9 25.2 25.4 26 43 ~ 28 fps
97%
T600:
27.2  fps
4K 3840x2160
100%
GeForce GTX 1050 Ti Max-Q:
15.9 16.4 17.1 ~ 16 fps
101%
T600:
16.1  fps
GTA V

GTA V

2015
low 1024x768
100%
GeForce GTX 1050 Ti Max-Q:
150.4  fps
121%
T600:
181.5  fps
med. 1366x768
100%
GeForce GTX 1050 Ti Max-Q:
143.3  fps
123%
T600:
175.6  fps
high 1920x1080
100%
GeForce GTX 1050 Ti Max-Q:
78.9  fps
102%
T600:
80.3  fps
ultra 1920x1080
100%
GeForce GTX 1050 Ti Max-Q:
34.5  fps
111%
T600:
38.2  fps
QHD 2560x1440
T600:
26.6  fps
4K 3840x2160
100%
GeForce GTX 1050 Ti Max-Q:
35.5  fps
70%
T600:
25  fps
low 1280x720
100%
GeForce GTX 1050 Ti Max-Q:
244.3 262 297 298.2 299 ~ 280 fps
med. 1366x768
100%
GeForce GTX 1050 Ti Max-Q:
194.6 204 208.7 209.3 214 ~ 206 fps
high 1366x768
100%
GeForce GTX 1050 Ti Max-Q:
175.8 181.3 183.3 183.5 187.8 ~ 182 fps
ultra 1920x1080
100%
GeForce GTX 1050 Ti Max-Q:
71.3 71.8 72.2 73 74.6 ~ 73 fps
low 1024x768
100%
GeForce GTX 1050 Ti Max-Q:
228.2  fps
med. 1366x768
100%
GeForce GTX 1050 Ti Max-Q:
202.6  fps
high 1366x768
100%
GeForce GTX 1050 Ti Max-Q:
202.1  fps
ultra 1920x1080
100%
GeForce GTX 1050 Ti Max-Q:
170.1  fps
low 1024x768
100%
GeForce GTX 1050 Ti Max-Q:
433.4  fps
med. 1360x768
100%
GeForce GTX 1050 Ti Max-Q:
200.4  fps
high 1360x768
100%
GeForce GTX 1050 Ti Max-Q:
186.7  fps
ultra 1920x1080
100%
GeForce GTX 1050 Ti Max-Q:
126.7  fps

Average Gaming NVIDIA GeForce GTX 1050 Ti Max-Q → 100%

Average Gaming 30-70 fps → 100%

Average Gaming NVIDIA T600 → 110%

Average Gaming 30-70 fps → 97%

NVIDIA T600lowmed.highultraQHD4K
Far Cry 693.544.621.36.33
F1 2021171.978.863.740.229.115.7
F1 2020150.473.155.538.62714.5
Borderlands 3107.64226.719.913.45.54
Metro Exodus74.6342419.414.88.47
Strange Brigade174.464.951.444.831.917.9
Far Cry 5954642392612
X-Plane 11.11132.810795.940.8
Final Fantasy XV Benchmark70.734.925.117.89.98
Dota 2 Reborn162.8148.6120.7110.539.6
The Witcher 3139.182.847.527.216.1
GTA V181.5175.680.338.226.625
< 30 fps
< 60 fps
< 120 fps
≥ 120 fps


5
7

5
5
2
4
4
3
1
4
5
1
7
1

9
2

NVIDIA GeForce GTX 1050 Ti Max-Qlowmed.highultraQHD4K
Dirt Rally 2.0133.256.744.327.211.3
Anthem67.140.53430.49
Far Cry New Dawn864945422915
Metro Exodus584130244.7
Just Cause 473.247.936.135.312.9
Darksiders III134.587.473.76513.2
Battlefield V100.157.347.944.817.3
Farming Simulator 19193.6128.780.56122
Hitman 264.84137.535.911.3
Call of Duty Black Ops 4118.746.34537.510.1
Assassin´s Creed Odyssey674334187
Forza Horizon 412267614720
Shadow of the Tomb Raider9739352911
F1 201813480623817
Monster Hunter World100.339.234.926.88.3
The Crew 26049.145.34214
Far Cry 58647433913
X-Plane 11.1192.780.369.439.5
Final Fantasy XV Benchmark6837249.2
Star Wars Battlefront 292.34234.330.4
Assassin´s Creed Origins5841332713
Destiny 2119.569.464.357.918.9
Middle-earth: Shadow of War10555413113
Team Fortress 2129.8123.6115.7112.665.2
Rocket League249.1169.1112.542.3
Prey142.485.668.358.921.7
Ghost Recon Wildlands8343392214
For Honor14666655019
Farming Simulator 17137.3104.6
Battlefield 1122103555121
Civilization VI112.585.85143
Overwatch285.4233.9117.770.537
Ashes of the Singularity6341.335.815.7
The Division12686423415
Rise of the Tomb Raider12577453817
Rainbow Six Siege250158916529
World of Warships168.6143.9112.710134.4
Dota 2 Reborn111.9104.298.193.546
The Witcher 313383482816
GTA V150.4143.378.934.535.5
BioShock Infinite28020618273
Diablo III228.2202.6202.1170.1
StarCraft 2433.4200.4186.7126.7
< 30 fps
< 60 fps
< 120 fps
≥ 120 fps

2
20
20

19
13
10
1
23
15
4
8
20
9
2
1


30
6
1

Eine Liste mit weiteren Spielen und allen Grafikkarten finden Sie auf unserer Seite: Welches Spiel ist mit welcher Grafikkarte spielbar?

v1.28
log 06. 00:35:48

#0 ran 0s before starting gpusingle class +0s ... 0s

#1 checking url part for id 8480 +0s ... 0s

#2 checking url part for id 9923 +0s ... 0s

#3 checking url part for id 11373 +0s ... 0s

#4 redirected to Ajax server, took 1728167748s time from redirect:0 +0s ... 0s

#5 did not recreate cache, as it is less than 5 days old! Created at Fri, 04 Oct 2024 05:16:46 +0200 +0s ... 0s

#6 composed specs +0.004s ... 0.004s

#7 did output specs +0s ... 0.004s

#8 start showIntegratedCPUs +0s ... 0.004s

#9 getting avg benchmarks for device 8480 +0.001s ... 0.006s

#10 got single benchmarks 8480 +0.001s ... 0.007s

#11 getting avg benchmarks for device 9923 +0s ... 0.007s

#12 got single benchmarks 9923 +0s ... 0.007s

#13 getting avg benchmarks for device 11373 +0.003s ... 0.011s

#14 got single benchmarks 11373 +0s ... 0.011s

#15 got avg benchmarks for devices +0s ... 0.011s

#16 min, max, avg, median took s +0.023s ... 0.034s

#17 before gaming benchmark output +0s ... 0.034s

#18 Got 371 rows for game benchmarks. +0.016s ... 0.05s

#19 composed SQL query for gamebenchmarks +0s ... 0.05s

#20 got data and put it in $dataArray +0.003s ... 0.053s

#21 benchmarks composed for output. +0.016s ... 0.069s

#22 calculated avg scores. +0s ... 0.069s

#23 return log +0.001s ... 0.069s

Teilen Sie diesen Artikel, um uns zu unterstützen. Jeder Link hilft!
> Notebook Test, Laptop Test und News > Benchmarks / Technik > Benchmarks / Technik > Grafikkarten Vergleich - Head 2 Head
Autor: Klaus Hinum,  8.09.2017 (Update:  1.07.2023)