Notebookcheck Logo

NVIDIA GeForce GTX 1050 Ti Max-Q vs NVIDIA Quadro FX 1700M

NVIDIA GeForce GTX 1050 Ti Max-Q

► remove from comparison NVIDIA GeForce GTX 1050 Ti Max-Q

Die Nvidia GeForce GTX 1050 Ti mit Max-Q Design ist eine Mittelklasse-GPU basierend auf der Pascal-Architektur und wurde im Januar 2018 vorgestellt. Anders als die schnelleren Modelle basiert die GTX 1050 Ti auf dem GP107-Chip, der im 14-nm-Verfahren bei Samsung hergestellt wird.

Im Vergleich zur normalen GTX 1050 Ti gibt es noch weitere Unterschiede als den Takt. Der Treiber wurde auf Effizienz (und nicht Leistung) optimiert (nur für die Max-Q Modelle), optimierte Spannungswandler für 1V Betreib, high-end Kühlungsmethoden und eine 40 dB Grenze für die Lüfterlautstärke (mit Taktanpasssungen um dies jederzeit zu gewährleisten) zeichnen die Max-Q Variante aus.

Features

Der GP107-Chip wird in einem 14-nm-FinFET-Prozess bei Samsung gefertigt und bietet eine Reihe neuer Features, unter anderem Support für DisplayPort 1.4 (ready), HDMI 2.0b, HDR, Simultaneous Multi-Projection (SMP) sowie verbessertes H.265 Video De- und Encoding (PlayReady 3.0). Eine genaue Auflistung der Verbesserungen und Features der neuen Pascal Desktop-GPUs finden Sie in unserem Pascal-Architektur-Artikel.

Performance

Die exakte Performance der GeForce GTX 1050 Ti Max-Q kann sich in Abhängigkeit von der Kühlung des jeweiligen Notebooks stark unterscheiden. Im Optimalfall ist die Leistung etwa 10 bis 15 % unterhalb der normalen GTX 1050 Ti angesiedelt. Dadurch eignet sich die Grafikkarte am besten für Full HD (1920 x 1080) bei hoher aber nicht maximaler Detailstufe.

Leistungsaufnahme

Die Leistungsaufnahme der GeForce GTX 1050 Ti Max-Q ist von Nvidia mit 40 - 46 Watt spezifiziert und damit deutlich unterhalb der normalen Notebook GTX 1050 Ti (64 Watt). Selbst die normale GTX 1050 ist mit 53 Watt höher spezifziert. Damit eignet sich die Grafikkarte auch für dünne und leichte 14-Zoll Notebooks.

NVIDIA Quadro FX 1700M

► remove from comparison NVIDIA Quadro FX 1700M

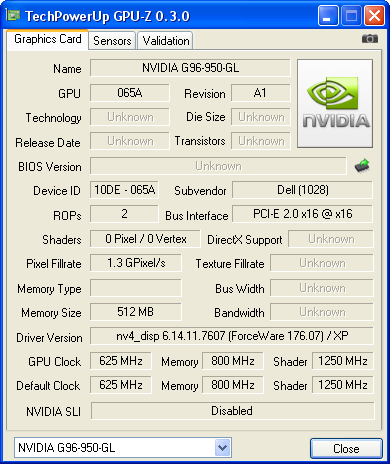
Professionelle Grafikkarte mit zertifizierten Treiber besonders für OpenGL geeignet. Technisch ähnlich wie die Quadro FX 1600M (8700M) basiert die FX 1700M auf den 96x0M Kern (G96), jedoch mit höheren Taktraten. Im Vergleich zur 1600M wird bereits Powermizer 8.0 unterstützt.

Gedacht für Digital Content Creators, Ingenieure, Geowissenschaftler und andere professionelle 3D Anwendungen.

Zertifizierte Treiber garantieren die fehlerfreie und schnellere (im Vergleich zu 8700M) Darstellung von professionellen Programmen (CAD, CCD, Visualisierungssoftware).

NVIDIA GeForce GTX 1050 Ti Max-QNVIDIA Quadro FX 1700M
Quadro FX Serie
GeForce GTX 1080 Ti compare 3584 @ 1.48 - 1.6 GHz352 Bit @ 11000 MHz
GeForce GTX 1080 SLI (Laptop) compare 5120 @ 1.56 - 1.73 GHz256 Bit @ 10000 MHz
GeForce GTX 1070 SLI (Desktop) compare 3840 @ 1.51 - 1.68 GHz256 Bit @ 8000 MHz
GeForce GTX 1070 SLI (Laptop) compare 4096 @ 1.44 - 1.65 GHz256 Bit @ 8000 MHz
GeForce GTX 1080 (Desktop) compare 2560 @ 1.61 - 1.73 GHz256 Bit @ 10000 MHz
GeForce GTX 1080 Mobile compare 2560 @ 1.57 - 1.73 GHz256 Bit @ 10000 MHz
GeForce GTX 1070 Ti (Desktop) compare 2432 @ 1.61 - 1.68 GHz256 Bit @ 8000 MHz
GeForce GTX 1070 (Desktop) compare 1920 @ 1.51 - 1.68 GHz256 Bit @ 8000 MHz
GeForce GTX 1080 Max-Q compare 2560 @ 1.1 - 1.28 GHz256 Bit @ 10000 MHz
GeForce GTX 1070 Mobile compare 2048 @ 1.44 - 1.65 GHz256 Bit @ 8000 MHz
GeForce GTX 1070 Max-Q compare 2048 @ 1.1 - 1.27 GHz256 Bit @ 8000 MHz
GeForce GTX 1060 (Desktop) compare 1280 @ 1.51 - 1.71 GHz192 Bit @ 8000 MHz
GeForce GTX 1060 Mobile compare 1280 @ 1.4 - 1.67 GHz192 Bit @ 8000 MHz
GeForce GTX 1060 Max-Q compare 1280 @ 1.06 - 1.34 GHz192 Bit @ 8000 MHz
GeForce GTX 1050 Ti Mobile compare 768 @ 1.49 - 1.62 GHz128 Bit @ 7000 MHz
GeForce GTX 1050 Ti (Desktop) compare 768 @ 1.29 - 1.39 GHz128 Bit @ 7008 MHz
GeForce GTX 1050 Ti Max-Q 768 @ 1.15 - 1.29 GHz128 Bit @ 7000 MHz
GeForce GTX 1050 (Desktop) compare 640 @ 1.35 - 1.46 GHz128 Bit @ 7008 MHz
GeForce GTX 1050 Mobile compare 640 @ 1.35 - 1.49 GHz128 Bit @ 7000 MHz
GeForce GTX 1050 Max-Q compare 640 @ 1 - 1.14 GHz128 Bit @ 7000 MHz
GeForce GT 1030 (Desktop) compare 384 @ 1.23 - 1.67 GHz64 Bit @ 6000 MHz
Quadro FX 3800M compare 128 @ 0.68 GHz256 Bit @ 1000 MHz
Quadro FX 3700M compare 128 @ 0.55 GHz256 Bit @ 800 MHz
Quadro FX 2800M compare 96 @ 0.6 GHz256 Bit @ 1000 MHz
Quadro FX 3600M compare 96 @ 0.5 GHz256 Bit @ 800 MHz
Quadro FX 1800M compare 72 @ 0.56 GHz128 Bit @ 1100 MHz
Quadro FX 2700M compare 48 @ 0.53 GHz256 Bit @ 800 MHz
Quadro FX 880M compare 48 @ 0.55 GHz128 Bit @ 790 MHz
Quadro FX 3500M compare 24/8 cores @ 0.58 GHz256 Bit @ 700 MHz
Quadro FX 2500M compare 24/8 cores @ 0.5 GHz256 Bit @ 600 MHz
Quadro FX 1700M 32 @ 0.63 GHz128 Bit @ 800 MHz
Quadro FX 1600M compare 32 @ 0.63 GHz128 Bit @ 800 MHz
Quadro FX 1500M compare 20/7 cores @ 0.38 GHz256 Bit @ 500 MHz
Quadro FX 770M compare 32 @ 0.5 GHz128 Bit @ 800 MHz
Quadro FX 570M compare 32 @ 0.48 GHz128 Bit @ 700 MHz
Quadro FX 380M compare 16 @ 0.63 GHz64 Bit @ 800 MHz
Quadro FX 370M compare 8 @ 0.58 GHz64 Bit @ 700 MHz
Quadro FX 360M compare 16 @ 0.4 GHz64 Bit @ 600 MHz
Quadro FX 350M compare 4/3 cores @ 0.45 GHz64 Bit @ 350 MHz
CodenameN17P-G1 Max-QNB9P-GLM
ArchitekturPascalG9x
Pipelines768 - unified32 - unified
Kerntakt1151 – 1290 - 1290 – 1417 (Boost) MHz625 MHz
Speichertakt7000 MHz800 MHz
Speicherbandbreite128 Bit128 Bit
SpeichertypGDDR5GDDR3
Max. Speichergröße4 GB256 MB
Shared Memoryneinnein
APIDirectX 12_1, OpenGL 4.5DirectX 10, Shader 4.0
Stromverbrauch40 - 46 Watt50 Watt
Herstellungsprozess16 nm65 nm
FeaturesMulti-Projection, VR Ready, G-SYNC, Vulkan, Multi MonitorOpenGL 2.1, PureVideo HD, Powermizer 8.0, mögliche Schnittstellen: LVDS, DVI, VGA, HDTV, HDCP, HDMI
Notebookgrößemittel (15.4" z.B.)groß (17" z.B.)
Erscheinungsdatum03.01.2018 01.10.2008
Herstellerseitewww.nvidia.comwww.nvidia.com
Shadertakt1250 MHz
Transistors289 Million
InformationenCG Shading Hochsprache, 32 Bit Gleitkommapräzision, 12 Bit Subpixel Präzision, 128 Bit Genauigkeit der Grafikpipeline, Vertex und Pixelshader Programmierbarkeit, PCI-E Interface, FSAA mit gedrehtem Raster, nView Multidisplay Support, High-Precision Dynamic-Range (HPDR) Technologie, Hardware 3D Clipping nach Fensterkennung, Vollbild Antialiasing

Benchmarks

Performance Rating - 3DMark 11 + Fire Strike + Time Spy - GeForce GTX 1050 Ti Max-Q
3.2 pt (10%)
3DMark - 3DMark Time Spy Score
min: 2361     avg: 2453     median: 2485 (7%)     max: 2513 Points
3DMark - 3DMark Time Spy Graphics
min: 2196     avg: 2245     median: 2261 (6%)     max: 2278 Points
3DMark - 3DMark Ice Storm Unlimited Graphics
324705 Points (33%)
3DMark - 3DMark Ice Storm Extreme Graphics
39641 Points (5%)
3DMark - 3DMark Cloud Gate Score
min: 20755     avg: 24100     median: 24021 (26%)     max: 28253 Points
3DMark - 3DMark Cloud Gate Graphics
min: 41871     avg: 46017     median: 46952 (12%)     max: 50801 Points
3DMark - 3DMark Fire Strike Standard Score
min: 6175     avg: 6548     median: 6688 (12%)     max: 6753 Points
3DMark - 3DMark Fire Strike Standard Graphics
min: 6957     avg: 7281     median: 7324 (8%)     max: 7428 Points
3DMark - 3DMark Ice Storm Graphics
min: 41029     avg: 73224     median: 60442 (7%)     max: 118202 Points
3DMark 11 - 3DM11 Performance Score
min: 8250     avg: 8936     median: 9106 (13%)     max: 9414 Points
3DMark 11 - 3DM11 Performance GPU
min: 8317     avg: 8781     median: 8752 (8%)     max: 9079 Points
3DMark Vantage
3DM Vant. Perf. total + NVIDIA GeForce GTX 1050 Ti Max-Q
3DMark Vantage - 3DM Vant. Perf. total
min: 24827     avg: 29504     median: 29503.5 (9%)     max: 34180 Points
3DM Vant. Perf. GPU no PhysX + NVIDIA GeForce GTX 1050 Ti Max-Q
3DMark Vantage - 3DM Vant. Perf. GPU no PhysX
min: 25707     avg: 29448     median: 29448 (16%)     max: 33189 Points
3DMark 2001SE - 3DMark 2001 - Standard
35734 Points (37%)
3DMark 03 - 3DMark 03 - Standard
18212 Points (10%)
3DMark 05 - 3DMark 05 - Standard
11550 Points (13%)
3DMark 06 3DMark 06 - Standard 1280x1024 + NVIDIA GeForce GTX 1050 Ti Max-Q
3DMark 06
min: 26796     avg: 28797     median: 28797 (38%)     max: 30798 Points
3DMark 06 - Standard 1024x768 + NVIDIA GeForce GTX 1050 Ti Max-Q
3DMark 06
34786 Points (45%)
3DMark 06 - Standard 1280x800 + NVIDIA Quadro FX 1700M
3DMark 06
6302 Points (8%)
Unigine Valley 1.0 - Unigine Valley 1.0 DX
40.1 fps (12%)
Unigine Heaven 2.1 - Heaven 2.1 high
86 fps (16%)
Cinebench R10 Cinebench R10 Shading (32bit) + NVIDIA GeForce GTX 1050 Ti Max-Q
Cinebench R10 - Cinebench R10 Shading (32bit)
min: 4597     avg: 5340     median: 4972 (4%)     max: 6451 Points
Cinebench R10 Shading (32bit) + NVIDIA Quadro FX 1700M
6159 Points (4%)
Cinebench R11.5 Cinebench R11.5 OpenGL 64 Bit + NVIDIA GeForce GTX 1050 Ti Max-Q
Cinebench R11.5 - Cinebench R11.5 OpenGL 64 Bit
min: 66.9     avg: 71.7     median: 71.7 (24%)     max: 76.5 fps
Cinebench R15
Cinebench R15 OpenGL 64 Bit + NVIDIA GeForce GTX 1050 Ti Max-Q
Cinebench R15 - Cinebench R15 OpenGL 64 Bit
min: 92.1     avg: 105.4     median: 102 (6%)     max: 120.7 fps
Cinebench R15 OpenGL Ref. Match 64 Bit + NVIDIA GeForce GTX 1050 Ti Max-Q
Cinebench R15 - Cinebench R15 OpenGL Ref. Match 64 Bit
99.6 % (100%)
GFXBench - GFXBench 5.0 Aztec Ruins High Tier Offscreen
49.5 fps (9%)
GFXBench - GFXBench 5.0 Aztec Ruins Normal Tier Offscreen
119.1 fps (9%)
GFXBench - GFXBench Car Chase Offscreen
min: 108.8     avg: 124.2     median: 124.2 (14%)     max: 139.5 fps
GFXBench 3.1 - GFXBench Manhattan ES 3.1 Offscreen
min: 168     avg: 184.9     median: 184.9 (4%)     max: 201.7 fps
GFXBench 3.0 - GFXBench 3.0 Manhattan Offscreen
min: 229.8     avg: 253.2     median: 253.2 (15%)     max: 276.5 fps
GFXBench (DX / GLBenchmark) 2.7
GFXBench T-Rex HD Offscreen C24Z16 + NVIDIA GeForce GTX 1050 Ti Max-Q
GFXBench (DX / GLBenchmark) 2.7 - GFXBench T-Rex HD Offscreen C24Z16
min: 501     avg: 531     median: 531 (4%)     max: 561 fps
LuxMark v2.0 64Bit - LuxMark v2.0 Room GPU
min: 1167     avg: 1201     median: 1200.5 (5%)     max: 1234 Samples/s
LuxMark v2.0 64Bit - LuxMark v2.0 Sala GPU
min: 2100     avg: 2222     median: 2221.5 (4%)     max: 2343 Samples/s
ComputeMark v2.1 - ComputeMark v2.1 Result
min: 4515     avg: 4879     median: 4879 (5%)     max: 5243 Points
Power Consumption - Furmark Stress Test Power Consumption - external Monitor *
73.1 Watt (10%)
Power Consumption - The Witcher 3 Power Consumption - external Monitor *
75.8 Watt (11%)
Power Consumption - Witcher 3 Power Consumption *
min: 82     avg: 90     median: 85 (19%)     max: 103 Watt
Power Consumption - Witcher 3 ultra Power Efficiency
min: 0.2379     avg: 0.3     median: 0.3 (26%)     max: 0.3073 fps per Watt
Power Consumption - Witcher 3 ultra Power Efficiency - external Monitor
0.3 fps per Watt (27%)
Emissions Witcher 3 Fan Noise + NVIDIA GeForce GTX 1050 Ti Max-Q
Emissions - Witcher 3 Fan Noise
min: 36.4     avg: 40.2     median: 38.4 (61%)     max: 47.6 dB(A)
Clock Speed - GPU Clock Witcher 3 ultra
1392 MHz (55%)

Average Benchmarks NVIDIA GeForce GTX 1050 Ti Max-Q → 100% n=1

Average Benchmarks NVIDIA Quadro FX 1700M → 124% n=1

- Bereich der Benchmarkergebnisse für diese Grafikkarte
- Durchschnittliche Benchmarkergebnisse für diese Grafikkarte
* Smaller numbers mean a higher performance
1 This benchmark is not used for the average calculation

Spiele-Benchmarks

Die folgenden Benchmarks basieren auf unseren Spieletests mit Testnotebooks. Die Performance dieser Grafikkarte bei den gelisteten Spielen ist abhängig von der verwendeten CPU, Speicherausstattung, Treiber und auch Betriebssystem. Dadurch müssen die untenstehenden Werte nicht repräsentativ sein. Detaillierte Informationen über das verwendete System sehen Sie nach einem Klick auf den fps-Wert.

low 1280x720
100%
GeForce GTX 1050 Ti Max-Q:
133.2  fps
med. 1920x1080
100%
GeForce GTX 1050 Ti Max-Q:
56.7  fps
high 1920x1080
100%
GeForce GTX 1050 Ti Max-Q:
44.3  fps
ultra 1920x1080
100%
GeForce GTX 1050 Ti Max-Q:
27.2  fps
4K 3840x2160
100%
GeForce GTX 1050 Ti Max-Q:
11.3  fps
Anthem

Anthem

2019
low 1280x720
100%
GeForce GTX 1050 Ti Max-Q:
67.1  fps
med. 1920x1080
100%
GeForce GTX 1050 Ti Max-Q:
40.5  fps
high 1920x1080
100%
GeForce GTX 1050 Ti Max-Q:
34  fps
ultra 1920x1080
100%
GeForce GTX 1050 Ti Max-Q:
30.4  fps
4K 3840x2160
100%
GeForce GTX 1050 Ti Max-Q:
9  fps
low 1280x720
100%
GeForce GTX 1050 Ti Max-Q:
83 89 ~ 86 fps
med. 1920x1080
100%
GeForce GTX 1050 Ti Max-Q:
47 50 ~ 49 fps
high 1920x1080
100%
GeForce GTX 1050 Ti Max-Q:
43 46 ~ 45 fps
ultra 1920x1080
100%
GeForce GTX 1050 Ti Max-Q:
40 43 ~ 42 fps
QHD 2560x1440
100%
GeForce GTX 1050 Ti Max-Q:
29  fps
4K 3840x2160
100%
GeForce GTX 1050 Ti Max-Q:
14 15 ~ 15 fps
low 1280x720
100%
GeForce GTX 1050 Ti Max-Q:
55.5 60.4 ~ 58 fps
med. 1920x1080
100%
GeForce GTX 1050 Ti Max-Q:
31.4 49.8 ~ 41 fps
high 1920x1080
100%
GeForce GTX 1050 Ti Max-Q:
23.5 36.5 ~ 30 fps
ultra 1920x1080
100%
GeForce GTX 1050 Ti Max-Q:
19.3 28.3 ~ 24 fps
4K 3840x2160
100%
GeForce GTX 1050 Ti Max-Q:
4.7  fps
low 1280x720
100%
GeForce GTX 1050 Ti Max-Q:
73.2  fps
med. 1920x1080
100%
GeForce GTX 1050 Ti Max-Q:
47.9  fps
high 1920x1080
100%
GeForce GTX 1050 Ti Max-Q:
36.1  fps
ultra 1920x1080
100%
GeForce GTX 1050 Ti Max-Q:
35.3  fps
4K 3840x2160
100%
GeForce GTX 1050 Ti Max-Q:
12.9  fps
low 1280x720
100%
GeForce GTX 1050 Ti Max-Q:
134.5  fps
med. 1920x1080
100%
GeForce GTX 1050 Ti Max-Q:
87.4  fps
high 1920x1080
100%
GeForce GTX 1050 Ti Max-Q:
73.7  fps
ultra 1920x1080
100%
GeForce GTX 1050 Ti Max-Q:
65  fps
4K 3840x2160
100%
GeForce GTX 1050 Ti Max-Q:
13.2  fps
low 1280x720
100%
GeForce GTX 1050 Ti Max-Q:
100.1  fps
med. 1920x1080
100%
GeForce GTX 1050 Ti Max-Q:
57.3  fps
high 1920x1080
100%
GeForce GTX 1050 Ti Max-Q:
47.9  fps
ultra 1920x1080
100%
GeForce GTX 1050 Ti Max-Q:
44.8  fps
4K 3840x2160
100%
GeForce GTX 1050 Ti Max-Q:
17.3  fps
low 1280x720
100%
GeForce GTX 1050 Ti Max-Q:
193.6  fps
med. 1920x1080
100%
GeForce GTX 1050 Ti Max-Q:
128.7  fps
high 1920x1080
100%
GeForce GTX 1050 Ti Max-Q:
80.5  fps
ultra 1920x1080
100%
GeForce GTX 1050 Ti Max-Q:
61  fps
4K 3840x2160
100%
GeForce GTX 1050 Ti Max-Q:
22  fps
Hitman 2

Hitman 2

2018
low 1280x720
100%
GeForce GTX 1050 Ti Max-Q:
64.8  fps
med. 1920x1080
100%
GeForce GTX 1050 Ti Max-Q:
41  fps
high 1920x1080
100%
GeForce GTX 1050 Ti Max-Q:
37.5  fps
ultra 1920x1080
100%
GeForce GTX 1050 Ti Max-Q:
35.9  fps
4K 3840x2160
100%
GeForce GTX 1050 Ti Max-Q:
11.3  fps
low 1280x720
100%
GeForce GTX 1050 Ti Max-Q:
118.7  fps
med. 1920x1080
100%
GeForce GTX 1050 Ti Max-Q:
46.3  fps
high 1920x1080
100%
GeForce GTX 1050 Ti Max-Q:
45  fps
ultra 1920x1080
100%
GeForce GTX 1050 Ti Max-Q:
37.5  fps
4K 3840x2160
100%
GeForce GTX 1050 Ti Max-Q:
10.1  fps
low 1280x720
100%
GeForce GTX 1050 Ti Max-Q:
67  fps
med. 1920x1080
100%
GeForce GTX 1050 Ti Max-Q:
43  fps
high 1920x1080
100%
GeForce GTX 1050 Ti Max-Q:
34  fps
ultra 1920x1080
100%
GeForce GTX 1050 Ti Max-Q:
18  fps
4K 3840x2160
100%
GeForce GTX 1050 Ti Max-Q:
7  fps
low 1280x720
100%
GeForce GTX 1050 Ti Max-Q:
122  fps
med. 1920x1080
100%
GeForce GTX 1050 Ti Max-Q:
67  fps
high 1920x1080
100%
GeForce GTX 1050 Ti Max-Q:
61  fps
ultra 1920x1080
100%
GeForce GTX 1050 Ti Max-Q:
47  fps
4K 3840x2160
100%
GeForce GTX 1050 Ti Max-Q:
20  fps
low 1280x720
100%
GeForce GTX 1050 Ti Max-Q:
97  fps
med. 1920x1080
100%
GeForce GTX 1050 Ti Max-Q:
39  fps
high 1920x1080
100%
GeForce GTX 1050 Ti Max-Q:
35  fps
ultra 1920x1080
100%
GeForce GTX 1050 Ti Max-Q:
29  fps
4K 3840x2160
100%
GeForce GTX 1050 Ti Max-Q:
11  fps
F1 2018

F1 2018

2018
low 1280x720
100%
GeForce GTX 1050 Ti Max-Q:
134  fps
med. 1920x1080
100%
GeForce GTX 1050 Ti Max-Q:
80  fps
high 1920x1080
100%
GeForce GTX 1050 Ti Max-Q:
62  fps
ultra 1920x1080
100%
GeForce GTX 1050 Ti Max-Q:
38  fps
4K 3840x2160
100%
GeForce GTX 1050 Ti Max-Q:
17  fps
low 1280x720
100%
GeForce GTX 1050 Ti Max-Q:
100.3  fps
med. 1920x1080
100%
GeForce GTX 1050 Ti Max-Q:
39.2  fps
high 1920x1080
100%
GeForce GTX 1050 Ti Max-Q:
34.9  fps
ultra 1920x1080
100%
GeForce GTX 1050 Ti Max-Q:
26.8  fps
4K 3840x2160
100%
GeForce GTX 1050 Ti Max-Q:
8.3  fps
low 1280x720
100%
GeForce GTX 1050 Ti Max-Q:
60  fps
med. 1920x1080
100%
GeForce GTX 1050 Ti Max-Q:
49.1  fps
high 1920x1080
100%
GeForce GTX 1050 Ti Max-Q:
45.3  fps
ultra 1920x1080
100%
GeForce GTX 1050 Ti Max-Q:
42  fps
4K 3840x2160
100%
GeForce GTX 1050 Ti Max-Q:
14  fps
Far Cry 5

Far Cry 5

2018
low 1280x720
100%
GeForce GTX 1050 Ti Max-Q:
76 91 91 ~ 86 fps
med. 1920x1080
100%
GeForce GTX 1050 Ti Max-Q:
45 48 48 ~ 47 fps
high 1920x1080
100%
GeForce GTX 1050 Ti Max-Q:
41 44 44 ~ 43 fps
ultra 1920x1080
100%
GeForce GTX 1050 Ti Max-Q:
38 38 41 ~ 39 fps
4K 3840x2160
100%
GeForce GTX 1050 Ti Max-Q:
13 13 14 ~ 13 fps
low 1280x720
100%
GeForce GTX 1050 Ti Max-Q:
92.7  fps
med. 1920x1080
100%
GeForce GTX 1050 Ti Max-Q:
80.3  fps
high 1920x1080
100%
GeForce GTX 1050 Ti Max-Q:
69.4  fps
4K 3840x2160
100%
GeForce GTX 1050 Ti Max-Q:
39.5  fps
low 1280x720
100%
GeForce GTX 1050 Ti Max-Q:
61.5 75.1 ~ 68 fps
med. 1920x1080
100%
GeForce GTX 1050 Ti Max-Q:
36.6 37.7 ~ 37 fps
high 1920x1080
100%
GeForce GTX 1050 Ti Max-Q:
23.3 25 ~ 24 fps
4K 3840x2160
100%
GeForce GTX 1050 Ti Max-Q:
9.2  fps
low 1280x720
100%
GeForce GTX 1050 Ti Max-Q:
92.3  fps
med. 1920x1080
100%
GeForce GTX 1050 Ti Max-Q:
42  fps
high 1920x1080
100%
GeForce GTX 1050 Ti Max-Q:
34.3  fps
ultra 1920x1080
100%
GeForce GTX 1050 Ti Max-Q:
30.4  fps
low 1280x720
100%
GeForce GTX 1050 Ti Max-Q:
58  fps
med. 1920x1080
100%
GeForce GTX 1050 Ti Max-Q:
41  fps
high 1920x1080
100%
GeForce GTX 1050 Ti Max-Q:
33  fps
ultra 1920x1080
100%
GeForce GTX 1050 Ti Max-Q:
27  fps
4K 3840x2160
100%
GeForce GTX 1050 Ti Max-Q:
13  fps
Destiny 2

Destiny 2

2017
low 1280x720
100%
GeForce GTX 1050 Ti Max-Q:
119.5  fps
med. 1920x1080
100%
GeForce GTX 1050 Ti Max-Q:
69.4  fps
high 1920x1080
100%
GeForce GTX 1050 Ti Max-Q:
64.3  fps
ultra 1920x1080
100%
GeForce GTX 1050 Ti Max-Q:
57.9  fps
4K 3840x2160
100%
GeForce GTX 1050 Ti Max-Q:
18.9  fps
low 1280x720
100%
GeForce GTX 1050 Ti Max-Q:
105  fps
med. 1920x1080
100%
GeForce GTX 1050 Ti Max-Q:
55  fps
high 1920x1080
100%
GeForce GTX 1050 Ti Max-Q:
41  fps
ultra 1920x1080
100%
GeForce GTX 1050 Ti Max-Q:
31  fps
4K 3840x2160
100%
GeForce GTX 1050 Ti Max-Q:
13  fps
low 1280x720
100%
GeForce GTX 1050 Ti Max-Q:
129.8  fps
med. 1366x768
100%
GeForce GTX 1050 Ti Max-Q:
123.6  fps
high 1920x1080
100%
GeForce GTX 1050 Ti Max-Q:
115.7  fps
ultra 1920x1080
100%
GeForce GTX 1050 Ti Max-Q:
112.6  fps
4K 3820x2160
100%
GeForce GTX 1050 Ti Max-Q:
65.2  fps
low 1280x720
100%
GeForce GTX 1050 Ti Max-Q:
249.1  fps
med. 1920x1080
100%
GeForce GTX 1050 Ti Max-Q:
169.1  fps
high 1920x1080
100%
GeForce GTX 1050 Ti Max-Q:
112.5  fps
4K 3840x2160
100%
GeForce GTX 1050 Ti Max-Q:
42.3  fps
Prey

Prey

2017
low 1280x720
100%
GeForce GTX 1050 Ti Max-Q:
142.4  fps
med. 1920x1080
100%
GeForce GTX 1050 Ti Max-Q:
85.6  fps
high 1920x1080
100%
GeForce GTX 1050 Ti Max-Q:
68.3  fps
ultra 1920x1080
100%
GeForce GTX 1050 Ti Max-Q:
58.9  fps
4K 3840x2160
100%
GeForce GTX 1050 Ti Max-Q:
21.7  fps
low 1280x720
100%
GeForce GTX 1050 Ti Max-Q:
68.6 96.7 ~ 83 fps
med. 1920x1080
100%
GeForce GTX 1050 Ti Max-Q:
39.3 42.7 45.9 ~ 43 fps
high 1920x1080
100%
GeForce GTX 1050 Ti Max-Q:
35.3 40 41.9 ~ 39 fps
ultra 1920x1080
100%
GeForce GTX 1050 Ti Max-Q:
19.1 22.4 23.4 ~ 22 fps
4K 3840x2160
100%
GeForce GTX 1050 Ti Max-Q:
13.9 14.5 ~ 14 fps
For Honor

For Honor

2017
low 1280x720
100%
GeForce GTX 1050 Ti Max-Q:
113.6 179.3 ~ 146 fps
med. 1920x1080
100%
GeForce GTX 1050 Ti Max-Q:
63.8 68.2 ~ 66 fps
high 1920x1080
100%
GeForce GTX 1050 Ti Max-Q:
64.9 65.5 ~ 65 fps
ultra 1920x1080
100%
GeForce GTX 1050 Ti Max-Q:
49.5 50.4 ~ 50 fps
4K 3840x2160
100%
GeForce GTX 1050 Ti Max-Q:
19.2 19.2 ~ 19 fps
high 1920x1080
100%
GeForce GTX 1050 Ti Max-Q:
137.3  fps
ultra 1920x1080
100%
GeForce GTX 1050 Ti Max-Q:
104.6  fps
low 1280x720
100%
GeForce GTX 1050 Ti Max-Q:
89.5 154.8 ~ 122 fps
med. 1366x768
100%
GeForce GTX 1050 Ti Max-Q:
85.2 120 ~ 103 fps
high 1920x1080
100%
GeForce GTX 1050 Ti Max-Q:
51.7 58.1 ~ 55 fps
ultra 1920x1080
100%
GeForce GTX 1050 Ti Max-Q:
49.8 53.1 ~ 51 fps
4K 3840x2160
100%
GeForce GTX 1050 Ti Max-Q:
20.7 21.1 ~ 21 fps
low 1024x768
100%
GeForce GTX 1050 Ti Max-Q:
112.5  fps
med. 1366x768
100%
GeForce GTX 1050 Ti Max-Q:
85.8  fps
high 1920x1080
100%
GeForce GTX 1050 Ti Max-Q:
51  fps
ultra 1920x1080
100%
GeForce GTX 1050 Ti Max-Q:
43  fps
Overwatch

Overwatch

2016
low 1280x720
100%
GeForce GTX 1050 Ti Max-Q:
285.4  fps
med. 1366x768
100%
GeForce GTX 1050 Ti Max-Q:
233.9  fps
high 1920x1080
100%
GeForce GTX 1050 Ti Max-Q:
117.7  fps
ultra 1920x1080
100%
GeForce GTX 1050 Ti Max-Q:
70.5  fps
4K 3840x2160
100%
GeForce GTX 1050 Ti Max-Q:
37  fps
low 1280x768
100%
GeForce GTX 1050 Ti Max-Q:
63  fps
med. 1920x1080
100%
GeForce GTX 1050 Ti Max-Q:
41.3  fps
high 1920x1080
100%
GeForce GTX 1050 Ti Max-Q:
35.8  fps
4K 3840x2160
100%
GeForce GTX 1050 Ti Max-Q:
15.7  fps
low 1280x720
100%
GeForce GTX 1050 Ti Max-Q:
114.2 137.2 ~ 126 fps
med. 1366x768
100%
GeForce GTX 1050 Ti Max-Q:
83.4 89.5 ~ 86 fps
high 1920x1080
100%
GeForce GTX 1050 Ti Max-Q:
41.9 42.5 ~ 42 fps
ultra 1920x1080
100%
GeForce GTX 1050 Ti Max-Q:
32.2 34.8 ~ 34 fps
4K 3840x2160
100%
GeForce GTX 1050 Ti Max-Q:
14.6 15.7 ~ 15 fps
low 1024x768
100%
GeForce GTX 1050 Ti Max-Q:
99.9 118.3 141.1 141.7 ~ 125 fps
med. 1366x768
100%
GeForce GTX 1050 Ti Max-Q:
67.6 73.6 82.9 85.7 ~ 77 fps
high 1920x1080
100%
GeForce GTX 1050 Ti Max-Q:
38.8 47.3 47.4 47.7 ~ 45 fps
ultra 1920x1080
100%
GeForce GTX 1050 Ti Max-Q:
31.7 39.5 39.9 40.5 ~ 38 fps
4K 3840x2160
100%
GeForce GTX 1050 Ti Max-Q:
16.8 17.1 ~ 17 fps
low 1024x768
100%
GeForce GTX 1050 Ti Max-Q:
236.6 263.6 ~ 250 fps
med. 1366x768
100%
GeForce GTX 1050 Ti Max-Q:
154.6 162.2 ~ 158 fps
high 1920x1080
100%
GeForce GTX 1050 Ti Max-Q:
90.2 92.7 ~ 91 fps
ultra 1920x1080
100%
GeForce GTX 1050 Ti Max-Q:
62.5 67.5 ~ 65 fps
4K 3840x2160
100%
GeForce GTX 1050 Ti Max-Q:
27.7 29.3 ~ 29 fps
low 1366x768
100%
GeForce GTX 1050 Ti Max-Q:
168.6  fps
med. 1366x768
100%
GeForce GTX 1050 Ti Max-Q:
143.9  fps
high 1920x1080
100%
GeForce GTX 1050 Ti Max-Q:
112.7  fps
ultra 1920x1080
100%
GeForce GTX 1050 Ti Max-Q:
101  fps
4K 3840 x 2160
100%
GeForce GTX 1050 Ti Max-Q:
34.4  fps
low 1280x720
100%
GeForce GTX 1050 Ti Max-Q:
111.9  fps
med. 1366x768
100%
GeForce GTX 1050 Ti Max-Q:
104.2  fps
high 1920x1080
100%
GeForce GTX 1050 Ti Max-Q:
98.1  fps
ultra 1920x1080
100%
GeForce GTX 1050 Ti Max-Q:
93.5  fps
4K 3840x2160
100%
GeForce GTX 1050 Ti Max-Q:
46  fps
low 1024x768
100%
GeForce GTX 1050 Ti Max-Q:
122 130.7 130.9 131.3 138.6 145 ~ 133 fps
med. 1366x768
100%
GeForce GTX 1050 Ti Max-Q:
73.2 76.6 80.9 82.6 87.2 99 ~ 83 fps
high 1920x1080
100%
GeForce GTX 1050 Ti Max-Q:
42.6 44.2 45.1 46 48.2 60 ~ 48 fps
ultra 1920x1080
100%
GeForce GTX 1050 Ti Max-Q:
23.5 24.5 24.9 25.2 25.4 26 43 ~ 28 fps
4K 3840x2160
100%
GeForce GTX 1050 Ti Max-Q:
15.9 16.4 17.1 ~ 16 fps
GTA V

GTA V

2015
low 1024x768
100%
GeForce GTX 1050 Ti Max-Q:
150.4  fps
med. 1366x768
100%
GeForce GTX 1050 Ti Max-Q:
143.3  fps
high 1920x1080
100%
GeForce GTX 1050 Ti Max-Q:
78.9  fps
ultra 1920x1080
100%
GeForce GTX 1050 Ti Max-Q:
34.5  fps
4K 3840x2160
100%
GeForce GTX 1050 Ti Max-Q:
35.5  fps
low 1280x720
100%
GeForce GTX 1050 Ti Max-Q:
244.3 262 297 298.2 299 ~ 280 fps
med. 1366x768
100%
GeForce GTX 1050 Ti Max-Q:
194.6 204 208.7 209.3 214 ~ 206 fps
high 1366x768
100%
GeForce GTX 1050 Ti Max-Q:
175.8 181.3 183.3 183.5 187.8 ~ 182 fps
ultra 1920x1080
100%
GeForce GTX 1050 Ti Max-Q:
71.3 71.8 72.2 73 74.6 ~ 73 fps
low 1024x768
100%
GeForce GTX 1050 Ti Max-Q:
228.2  fps
med. 1366x768
100%
GeForce GTX 1050 Ti Max-Q:
202.6  fps
high 1366x768
100%
GeForce GTX 1050 Ti Max-Q:
202.1  fps
ultra 1920x1080
100%
GeForce GTX 1050 Ti Max-Q:
170.1  fps
low 1024x768
100%
GeForce GTX 1050 Ti Max-Q:
433.4  fps
med. 1360x768
100%
GeForce GTX 1050 Ti Max-Q:
200.4  fps
high 1360x768
100%
GeForce GTX 1050 Ti Max-Q:
186.7  fps
ultra 1920x1080
100%
GeForce GTX 1050 Ti Max-Q:
126.7  fps
Crysis - GPU Benchmark

Crysis - GPU Benchmark

2007
med. 1024x768
Quadro FX 1700M:
33.3  fps
high 1024x768
Quadro FX 1700M:
19.1  fps
Crysis - CPU Benchmark

Crysis - CPU Benchmark

2007
med. 1024x768
Quadro FX 1700M:
29.3  fps
high 1024x768
Quadro FX 1700M:
17.1  fps
F.E.A.R.

F.E.A.R.

2005
low 640x480
Quadro FX 1700M:
378  fps
med. 800x600
Quadro FX 1700M:
152  fps
high 1024x768
Quadro FX 1700M:
59  fps
Quake 3 Arena - Timedemo

Quake 3 Arena - Timedemo

1999
high 1024x768
Quadro FX 1700M:
610  fps

Average Gaming NVIDIA GeForce GTX 1050 Ti Max-Q → 100%

Average Gaming 30-70 fps → 100%

NVIDIA GeForce GTX 1050 Ti Max-Qlowmed.highultraQHD4K
Dirt Rally 2.0133.256.744.327.211.3
Anthem67.140.53430.49
Far Cry New Dawn864945422915
Metro Exodus584130244.7
Just Cause 473.247.936.135.312.9
Darksiders III134.587.473.76513.2
Battlefield V100.157.347.944.817.3
Farming Simulator 19193.6128.780.56122
Hitman 264.84137.535.911.3
Call of Duty Black Ops 4118.746.34537.510.1
Assassin´s Creed Odyssey674334187
Forza Horizon 412267614720
Shadow of the Tomb Raider9739352911
F1 201813480623817
Monster Hunter World100.339.234.926.88.3
The Crew 26049.145.34214
Far Cry 58647433913
X-Plane 11.1192.780.369.439.5
Final Fantasy XV Benchmark6837249.2
Star Wars Battlefront 292.34234.330.4
Assassin´s Creed Origins5841332713
Destiny 2119.569.464.357.918.9
Middle-earth: Shadow of War10555413113
Team Fortress 2129.8123.6115.7112.665.2
Rocket League249.1169.1112.542.3
Prey142.485.668.358.921.7
Ghost Recon Wildlands8343392214
For Honor14666655019
Farming Simulator 17137.3104.6
Battlefield 1122103555121
Civilization VI112.585.85143
Overwatch285.4233.9117.770.537
Ashes of the Singularity6341.335.815.7
The Division12686423415
Rise of the Tomb Raider12577453817
Rainbow Six Siege250158916529
World of Warships168.6143.9112.710134.4
Dota 2 Reborn111.9104.298.193.546
The Witcher 313383482816
GTA V150.4143.378.934.535.5
BioShock Infinite28020618273
Diablo III228.2202.6202.1170.1
StarCraft 2433.4200.4186.7126.7
< 30 fps
< 60 fps
< 120 fps
≥ 120 fps

2
20
20

19
13
10
1
23
15
4
8
20
9
2
1


30
6
1
NVIDIA Quadro FX 1700Mlowmed.highultraQHD4K
Crysis - GPU Benchmark33.3119.06
Crysis - CPU Benchmark29.317.07
F.E.A.R.37815259
Quake 3 Arena - Timedemo610
< 30 fps
< 60 fps
< 120 fps
≥ 120 fps


1
1
1

1
2
1

1


Eine Liste mit weiteren Spielen und allen Grafikkarten finden Sie auf unserer Seite: Welches Spiel ist mit welcher Grafikkarte spielbar?

Add one or more devices and compare

In the following list you can select (and also search for) devices that should be added to the comparison. You can select more than one device.

restrict list:

show all (including archived), 2024, 2023
v1.28
log 20. 03:31:27

#0 ran 0s before starting gpusingle class +0s ... 0s

#1 checking url part for id 8480 +0s ... 0s

#2 checking url part for id 1087 +0s ... 0s

#3 redirected to Ajax server, took 1726795887s time from redirect:0 +0s ... 0s

#4 did not recreate cache, as it is less than 5 days old! Created at Thu, 19 Sep 2024 05:16:33 +0200 +0s ... 0s

#5 composed specs +0.002s ... 0.003s

#6 did output specs +0s ... 0.003s

#7 start showIntegratedCPUs +0s ... 0.003s

#8 getting avg benchmarks for device 8480 +0.012s ... 0.014s

#9 got single benchmarks 8480 +0.001s ... 0.015s

#10 getting avg benchmarks for device 1087 +0s ... 0.016s

#11 got single benchmarks 1087 +0.004s ... 0.02s

#12 got avg benchmarks for devices +0s ... 0.02s

#13 min, max, avg, median took s +0.014s ... 0.034s

#14 before gaming benchmark output +0s ... 0.034s

#15 Got 314 rows for game benchmarks. +0.014s ... 0.049s

#16 composed SQL query for gamebenchmarks +0s ... 0.049s

#17 got data and put it in $dataArray +0.002s ... 0.051s

#18 benchmarks composed for output. +0.015s ... 0.066s

#19 calculated avg scores. +0s ... 0.066s

#20 return log +0.002s ... 0.068s

Teilen Sie diesen Artikel, um uns zu unterstützen. Jeder Link hilft!
> Notebook Test, Laptop Test und News > Benchmarks / Technik > Benchmarks / Technik > Grafikkarten Vergleich - Head 2 Head
Autor: Klaus Hinum,  8.09.2017 (Update:  1.07.2023)