NVIDIA GeForce GTX 1050 Ti Max-Q vs Intel HD Graphics P630 vs Intel Iris Plus Graphics 655
NVIDIA GeForce GTX 1050 Ti Max-Q ► remove from comparison
Die Nvidia GeForce GTX 1050 Ti mit Max-Q Design ist eine Mittelklasse-GPU basierend auf der Pascal-Architektur und wurde im Januar 2018 vorgestellt. Anders als die schnelleren Modelle basiert die GTX 1050 Ti auf dem GP107-Chip, der im 14-nm-Verfahren bei Samsung hergestellt wird.
Im Vergleich zur normalen GTX 1050 Ti gibt es noch weitere Unterschiede als den Takt. Der Treiber wurde auf Effizienz (und nicht Leistung) optimiert (nur für die Max-Q Modelle), optimierte Spannungswandler für 1V Betreib, high-end Kühlungsmethoden und eine 40 dB Grenze für die Lüfterlautstärke (mit Taktanpasssungen um dies jederzeit zu gewährleisten) zeichnen die Max-Q Variante aus.
Features
Der GP107-Chip wird in einem 14-nm-FinFET-Prozess bei Samsung gefertigt und bietet eine Reihe neuer Features, unter anderem Support für DisplayPort 1.4 (ready), HDMI 2.0b, HDR, Simultaneous Multi-Projection (SMP) sowie verbessertes H.265 Video De- und Encoding (PlayReady 3.0). Eine genaue Auflistung der Verbesserungen und Features der neuen Pascal Desktop-GPUs finden Sie in unserem Pascal-Architektur-Artikel .
Performance
Die exakte Performance der GeForce GTX 1050 Ti Max-Q kann sich in Abhängigkeit von der Kühlung des jeweiligen Notebooks stark unterscheiden. Im Optimalfall ist die Leistung etwa 10 bis 15 % unterhalb der normalen GTX 1050 Ti angesiedelt. Dadurch eignet sich die Grafikkarte am besten für Full HD (1920 x 1080) bei hoher aber nicht maximaler Detailstufe.
Leistungsaufnahme
Die Leistungsaufnahme der GeForce GTX 1050 Ti Max-Q ist von Nvidia mit 40 - 46 Watt spezifiziert und damit deutlich unterhalb der normalen Notebook GTX 1050 Ti (64 Watt). Selbst die normale GTX 1050 ist mit 53 Watt höher spezifziert. Damit eignet sich die Grafikkarte auch für dünne und leichte 14-Zoll Notebooks.
Intel HD Graphics P630 ► remove from comparison
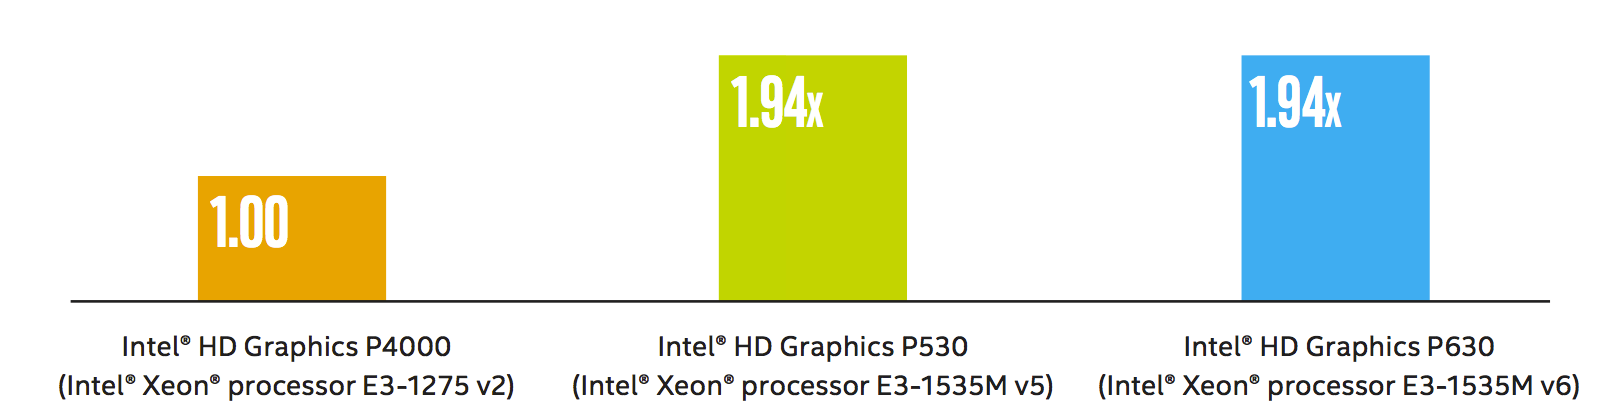
Die Intel HD Graphics P630 (GT2) ist eine integrierte Workstation-Grafikeinheit, die in verschiedenen Desktop- und Notebook-Prozessoren der 2017 vorgestellten Kaby-Lake-Generation zu finden ist (Xeon E3-1200 v6 und e3-1500M v6 Serien). Sie ist identisch mit der Intel HD Graphics 630, jedoch sind die Treiber für professionelle Software optimiert. Daher unterscheidet sie sich auch nicht von der Intel HD Graphics P530 und erreicht laut Intel auch die selbe Leistung im SPEC Viewperf12 (1.94x der alten Intel HD Graphics P4000). Die Grafikkarte ist derzeit für 15 CAD- und Workstation-Anwendungen zertifiziert .
Features
Neu bei der Kaby-Lake Generation ist die verbesserte Videoengine, welche nun auch H.265/HEVC im Main10-profil mit 10 Bit Farbtiefe sowie Googles VP9-Codec in Hardware dekodieren kann. Die Chips mit HD Graphics 530 sollten auch bereits HDCP 2.2 unterstützen und somit z.B. Netflix-Videos unter Windows 10 in 4K ausgeben können (im Gegensatz zu den ersten Kaby-Lake Dual-Core Chips mit Intel HD Graphics 620 ).
Leistungsaufnahme
Die HD Graphics P630 ist in Desktop- und Notebook-Prozessoren verschiedener TDP-Klassen zu finden. Die Quad-Core CPUs sind jedoch meistens in größeren und schwereren Notebooks verbaut. Der verbesserte 14nm+ Prozess verspricht jedoch eine etwas geringere Leistungsaufnahme im Vergleich zur Intel HD Graphics P530.
Quelle : http://www.intel.com/content/dam/www/public/us/en/documents/guides/hd-graphics-performance-guide.pdf
Intel Iris Plus Graphics 655 ► remove from comparison
Die Intel Iris Plus Graphics 655 (GT3e) ist eine Prozessorgrafikkarte, die im September 2017 vorgestellt wurde. Es handelt sich um den Nachfolger der Iris Plus 650 Graphics und wird in Coffee-Lake-U-CPUs der 28-Watt-Klasse verbaut. Der größte Unterschied zum Vorgänger ist der doppelt so große eDRAM-Cache mit 128 MB. Ansonsten dürfte es aber keine großen Unterschiede geben.
Die sogenannte GT3e-Ausbaustufe der Kaby-Lake-GPU verfügt weiterhin über 48 Execution Units (EUs), die je nach Modell nun mit bis zu 1.200 MHz takten (vorher max. 1.100 MHz). Neben dem eDRAM-Cache kann die Iris 655 auch über das Interface des Prozessors auf den Hauptspeicher zugreifen (2x 64 Bit LPDDR3-2133/DDR4-2400).
Von der Iris Plus 640 der 15-Watt-Modelle unterscheidet sich die Iris 655 lediglich durch ihren etwas höheren Maximaltakt sowie die annähernd verdoppelte TDP, die eine bessere Ausnutzung des Turbo-Boost-Spielraumes erlaubt.
Performance
Die exakte Leistung der Iris Plus Graphics 655 hängt vom jeweiligen CPU-Modell ab, da sich die Maximaltaktrate sowie die Größe des Caches leicht unterscheiden können. Zum anderen beeinflusst auch der verwendete Speicher (DDR3/DDR4) die Performance.
Die höchste Leistung erreichen hochtaktende Core-i7-Ableger wie der Core i7-8559U. Je nach Spiel ordnet sich die Iris Plus 655 vermutlich im Bereich einer dedizierten GeForce 930M oder GeForce 940MX ein und kann aktuelle Titel in niedrigen bis mittleren Einstellungen flüssig darstellen.
Features
Die überarbeitete Videoeinheit dekodiert H.265-/HEVC-Videos vollständig in Hardware. Anders als Skylake kann Kaby Lake nun auch H.265/HEVC im Main10-Profil mit 10 Bit Farbtiefe sowie Googles VP9-Codec in Hardware dekodieren. Die Bildausgabe erfolgt über DP 1.2/eDP 1.3 (max. 3.840 x 2.160 @ 60 Hz), wohingegen HDMI nur in der älteren Version 1.4a angeboten wird. Ein HDMI-2.0-Anschluss kann aber mittels Konverter von DisplayPort ergänzt werden. Maximal lassen sich drei Displays parallel angesteuern.
Leistungsaufnahme
Die Iris Plus Graphics 655 ist in den Prozessoren der 28-Watt-Klasse zu finden und damit für kleine/mittelgroße Laptops geeignet.
NVIDIA GeForce GTX 1050 Ti Max-Q Intel HD Graphics P630 Intel Iris Plus Graphics 655 Gen. 9.5 Serie Codename N17P-G1 Max-Q Kaby-Lake-H-GT2 Kaby Lake GT3e Architektur Pascal Gen. 9.5 Kaby Lake Gen. 9.5 Kaby Lake Pipelines 768 - unified 24 - unified 48 - unified Kerntakt 1151 – 1290 - 1290 – 1417 (Boost) MHz 300 - 1200 (Boost) MHz Speichertakt 7000 MHz Speicherbandbreite 128 Bit 64/128 Bit Speichertyp GDDR5 DDR3/DDR4 Max. Speichergröße 4 GB Shared Memory nein ja ja API DirectX 12_1, OpenGL 4.5 DirectX 12_1, OpenGL 4.4 DirectX 12_1, OpenGL 4.5 Stromverbrauch 40 - 46 Watt Herstellungsprozess 16 nm 14 nm 14 nm Features Multi-Projection, VR Ready, G-SYNC, Vulkan, Multi Monitor QuickSync QuickSync Notebookgröße mittel (15.4" z.B.) Erscheinungsdatum 03.01.2018 05.08.2015 01.09.2017 Herstellerseite www.nvidia.com
Benchmarks Performance Rating - 3DMark 11 + Fire Strike + Time Spy - GeForce GTX 1050 Ti Max-Q
3.2 pt (10%)
...
NVIDIA GeForce GTX 1050 Ti Max-Q
...
max:
Performance Rating - 3DMark 11 + Fire Strike + Time Spy - Iris Plus Graphics 655
0.9 pt (3%)
...
Intel Iris Plus Graphics 655
...
max:
3DMark - 3DMark Time Spy Score
min: 2361 avg: 2453 median: 2485 (7%) max: 2513 Points
400 Points (1%)
min: 348 avg: 647 median: 684 (2%) max: 722 Points
3DMark - 3DMark Time Spy Graphics
min: 2196 avg: 2245 median: 2261 (6%) max: 2278 Points
min: 301 avg: 570 median: 604.5 (2%) max: 633 Points
3DMark - 3DMark Ice Storm Unlimited Graphics
324705 Points (33%)
min: 131607 avg: 139716 median: 137266 (14%) max: 152727 Points
3DMark - 3DMark Ice Storm Extreme Graphics
39641 Points (5%)
min: 57033 avg: 72655 median: 71073 (9%) max: 89859 Points
3DMark - 3DMark Cloud Gate Score
min: 20755 avg: 24100 median: 24021 (26%) max: 28253 Points
8280 Points (9%)
min: 6769 avg: 10798 median: 11622 (12%) max: 13037 Points
3DMark - 3DMark Cloud Gate Graphics
min: 41871 avg: 46017 median: 46952 (12%) max: 50801 Points
min: 6498 avg: 13736 median: 14343 (4%) max: 16698 Points
3DMark - 3DMark Fire Strike Standard Score
min: 6175 avg: 6548 median: 6688 (12%) max: 6753 Points
1040 Points (2%)
min: 852 avg: 1703 median: 1850 (3%) max: 2040 Points
3DMark - 3DMark Fire Strike Standard Graphics
min: 6957 avg: 7281 median: 7324 (8%) max: 7428 Points
min: 920 avg: 1836 median: 1983 (2%) max: 2260 Points
3DMark - 3DMark Ice Storm Graphics
min: 41029 avg: 73224 median: 60442 (7%) max: 118202 Points
min: 85405 avg: 107151 median: 110302 (13%) max: 122594 Points
3DMark 11 - 3DM11 Performance Score
min: 8250 avg: 8936 median: 9106 (13%) max: 9414 Points
min: 1548 avg: 2942 median: 3180.5 (4%) max: 3349 Points
3DMark 11 - 3DM11 Performance GPU
min: 8317 avg: 8781 median: 8752 (8%) max: 9079 Points
min: 1365 avg: 2707 median: 2894 (2%) max: 3081 Points
3DMark Vantage 3DM Vant. Perf. total + NVIDIA GeForce GTX 1050 Ti Max-Q 3DMark Vantage - 3DM Vant. Perf. total
min: 24827 avg: 29504 median: 29503.5 (9%) max: 34180 Points
3DM Vant. Perf. total + Intel Iris Plus Graphics 655
min: 12093 avg: 12287 median: 12287 (4%) max: 12481 Points
3DM Vant. Perf. GPU no PhysX + NVIDIA GeForce GTX 1050 Ti Max-Q 3DMark Vantage - 3DM Vant. Perf. GPU no PhysX
min: 25707 avg: 29448 median: 29448 (16%) max: 33189 Points
3DM Vant. Perf. GPU no PhysX + Intel Iris Plus Graphics 655
min: 10337 avg: 10514 median: 10513.5 (6%) max: 10690 Points
3DMark 05 - 3DMark 05 - Standard
22740 Points (25%)
3DMark 06 3DMark 06 - Standard 1280x1024 + NVIDIA GeForce GTX 1050 Ti Max-Q
min: 26796 avg: 28797 median: 28797 (38%) max: 30798 Points
3DMark 06 - Standard 1280x1024 + Intel Iris Plus Graphics 655
min: 17176 avg: 17885 median: 17885 (23%) max: 18594 Points
3DMark 06 - Standard 1024x768 + NVIDIA GeForce GTX 1050 Ti Max-Q
34786 Points (45%)
Unigine Valley 1.0 - Unigine Valley 1.0 DX
40.1 fps (12%)
8.2 fps (3%)
Unigine Heaven 2.1 - Heaven 2.1 high
86 fps (16%)
SPECviewperf 12 specvp12 sw-03 + Intel Iris Plus Graphics 655 SPECviewperf 12 - specvp12 sw-03
28.2 fps (7%)
specvp12 snx-02 + Intel Iris Plus Graphics 655 SPECviewperf 12 - specvp12 snx-02
2.1 fps (0%)
specvp12 showcase-01 + Intel Iris Plus Graphics 655 SPECviewperf 12 - specvp12 showcase-01
10.3 fps (2%)
specvp12 mediacal-01 + Intel Iris Plus Graphics 655 SPECviewperf 12 - specvp12 mediacal-01
4.6 fps (1%)
specvp12 maya-04 + Intel Iris Plus Graphics 655 SPECviewperf 12 - specvp12 maya-04
20.4 fps (6%)
specvp12 energy-01 + Intel Iris Plus Graphics 655 SPECviewperf 12 - specvp12 energy-01
0.3 fps (0%)
specvp12 creo-01 + Intel Iris Plus Graphics 655 SPECviewperf 12 - specvp12 creo-01
14.9 fps (6%)
specvp12 catia-04 + Intel Iris Plus Graphics 655 SPECviewperf 12 - specvp12 catia-04
18.8 fps (3%)
specvp12 3dsmax-05 + Intel Iris Plus Graphics 655 SPECviewperf 12 - specvp12 3dsmax-05
18.1 fps (3%)
SPECviewperf 13 specvp13 sw-04 + Intel Iris Plus Graphics 655 SPECviewperf 13 - specvp13 sw-04
34.6 fps (9%)
specvp13 snx-03 + Intel Iris Plus Graphics 655 SPECviewperf 13 - specvp13 snx-03
3.8 fps (0%)
specvp13 showcase-02 + Intel Iris Plus Graphics 655 SPECviewperf 13 - specvp13 showcase-02
10.3 fps (2%)
specvp13 medical-02 + Intel Iris Plus Graphics 655 SPECviewperf 13 - specvp13 medical-02
3.8 fps (1%)
specvp13 maya-05 + Intel Iris Plus Graphics 655 SPECviewperf 13 - specvp13 maya-05
25.9 fps (3%)
specvp13 energy-02 + Intel Iris Plus Graphics 655 SPECviewperf 13 - specvp13 energy-02
1.1 fps (0%)
specvp13 creo-02 + Intel Iris Plus Graphics 655 SPECviewperf 13 - specvp13 creo-02
19.6 fps (3%)
specvp13 catia-05 + Intel Iris Plus Graphics 655 SPECviewperf 13 - specvp13 catia-05
26.4 fps (3%)
specvp13 3dsmax-06 + Intel Iris Plus Graphics 655 SPECviewperf 13 - specvp13 3dsmax-06
18.2 fps (3%)
SPECviewperf 2020 specvp2020 solidworks-05 4k + Intel Iris Plus Graphics 655 SPECviewperf 2020 - specvp2020 solidworks-05 4k
21.2 fps (6%)
specvp2020 snx-04 4k + Intel Iris Plus Graphics 655 SPECviewperf 2020 - specvp2020 snx-04 4k
3.8 fps (0%)
specvp2020 medical-03 4k + Intel Iris Plus Graphics 655 SPECviewperf 2020 - specvp2020 medical-03 4k
1.8 fps (2%)
specvp2020 maya-06 4k + Intel Iris Plus Graphics 655 SPECviewperf 2020 - specvp2020 maya-06 4k
32.7 fps (5%)
specvp2020 energy-03 4k + Intel Iris Plus Graphics 655 SPECviewperf 2020 - specvp2020 energy-03 4k
1.1 fps (0%)
specvp2020 creo-03 4k + Intel Iris Plus Graphics 655 SPECviewperf 2020 - specvp2020 creo-03 4k
12.1 fps (6%)
specvp2020 catia-06 4k + Intel Iris Plus Graphics 655 SPECviewperf 2020 - specvp2020 catia-06 4k
6.3 fps (4%)
specvp2020 3dsmax-07 4k + Intel Iris Plus Graphics 655 SPECviewperf 2020 - specvp2020 3dsmax-07 4k
8.4 fps (3%)
Cinebench R10 Cinebench R10 Shading (32bit) + NVIDIA GeForce GTX 1050 Ti Max-Q Cinebench R10 - Cinebench R10 Shading (32bit)
min: 4597 avg: 5340 median: 4972 (4%) max: 6451 Points
Cinebench R10 Shading (32bit) + Intel Iris Plus Graphics 655
min: 7836 avg: 9544 median: 10263 (7%) max: 10533 Points
Cinebench R11.5 Cinebench R11.5 OpenGL 64 Bit + NVIDIA GeForce GTX 1050 Ti Max-Q Cinebench R11.5 - Cinebench R11.5 OpenGL 64 Bit
min: 66.9 avg: 71.7 median: 71.7 (24%) max: 76.5 fps
Cinebench R11.5 OpenGL 64 Bit + Intel Iris Plus Graphics 655
min: 50.25 avg: 51.4 median: 51.6 (17%) max: 52.2 fps
Cinebench R15 Cinebench R15 OpenGL 64 Bit + NVIDIA GeForce GTX 1050 Ti Max-Q Cinebench R15 - Cinebench R15 OpenGL 64 Bit
min: 92.1 avg: 105.4 median: 102 (6%) max: 120.7 fps
Cinebench R15 OpenGL 64 Bit + Intel Iris Plus Graphics 655
min: 33.91 avg: 67 median: 74 (4%) max: 88 fps
Cinebench R15 OpenGL Ref. Match 64 Bit + NVIDIA GeForce GTX 1050 Ti Max-Q Cinebench R15 - Cinebench R15 OpenGL Ref. Match 64 Bit
99.6 % (100%)
Cinebench R15 OpenGL Ref. Match 64 Bit + Intel Iris Plus Graphics 655
min: 97.8 avg: 98.1 median: 97.8 (98%) max: 99.3 %
GFXBench - GFXBench 5.0 Aztec Ruins High Tier Offscreen
49.5 fps (9%)
GFXBench - GFXBench 5.0 Aztec Ruins Normal Tier Offscreen
119.1 fps (9%)
GFXBench - GFXBench Car Chase Offscreen
min: 108.8 avg: 124.2 median: 124.2 (14%) max: 139.5 fps
GFXBench 3.1 - GFXBench Manhattan ES 3.1 Offscreen
min: 168 avg: 184.9 median: 184.9 (4%) max: 201.7 fps
min: 43.1 avg: 2387 median: 2387.1 (50%) max: 4731 fps
GFXBench 3.0 - GFXBench 3.0 Manhattan Offscreen
min: 229.8 avg: 253.2 median: 253.2 (15%) max: 276.5 fps
199.6 fps (12%)
GFXBench (DX / GLBenchmark) 2.7 GFXBench T-Rex HD Offscreen C24Z16 + NVIDIA GeForce GTX 1050 Ti Max-Q GFXBench (DX / GLBenchmark) 2.7 - GFXBench T-Rex HD Offscreen C24Z16
min: 501 avg: 531 median: 531 (4%) max: 561 fps
GFXBench T-Rex HD Offscreen C24Z16 + Intel Iris Plus Graphics 655
min: 199.6 avg: 6375 median: 6375.3 (51%) max: 12551 fps
LuxMark v2.0 64Bit - LuxMark v2.0 Room GPU
min: 1167 avg: 1201 median: 1200.5 (5%) max: 1234 Samples/s
min: 359 avg: 419.5 median: 419.5 (2%) max: 480 Samples/s
LuxMark v2.0 64Bit - LuxMark v2.0 Sala GPU
min: 2100 avg: 2222 median: 2221.5 (4%) max: 2343 Samples/s
min: 882 avg: 1038 median: 1038 (2%) max: 1194 Samples/s
ComputeMark v2.1 - ComputeMark v2.1 Result
min: 4515 avg: 4879 median: 4879 (5%) max: 5243 Points
min: 1584 avg: 1713 median: 1712.5 (2%) max: 1841 Points
Power Consumption - Furmark Stress Test Power Consumption - external Monitor *
73.1 Watt (10%)
min: 28.9 avg: 37.4 median: 39.2 (6%) max: 42.4 Watt
Power Consumption - The Witcher 3 Power Consumption - external Monitor *
75.8 Watt (11%)
min: 35.3 avg: 40.6 median: 39.4 (6%) max: 47.2 Watt
Power Consumption - Witcher 3 Power Consumption *
min: 82 avg: 90 median: 85 (19%) max: 103 Watt
min: 39.4 avg: 43.3 median: 43.3 (10%) max: 47.2 Watt
Power Consumption - Witcher 3 ultra Power Efficiency
min: 0.2379 avg: 0.3 median: 0.3 (26%) max: 0.3073 fps per Watt
0.1 fps per Watt (13%)
Power Consumption - Witcher 3 ultra Power Efficiency - external Monitor
0.3 fps per Watt (27%)
0.2 fps per Watt (13%)
Emissions Witcher 3 Fan Noise + NVIDIA GeForce GTX 1050 Ti Max-Q Emissions - Witcher 3 Fan Noise
min: 36.4 avg: 40.2 median: 38.4 (61%) max: 47.6 dB(A)
Witcher 3 Fan Noise + Intel Iris Plus Graphics 655
min: 32.5 avg: 36.2 median: 37.2 (60%) max: 39 dB(A)
Clock Speed - GPU Clock Witcher 3 ultra
1392 MHz (55%)
998 MHz (39%)
Average Benchmarks NVIDIA GeForce GTX 1050 Ti Max-Q → 100% n=3 Average Benchmarks Intel HD Graphics P630 → 22% n=3 Average Benchmarks Intel Iris Plus Graphics 655 → 35% n=3
- Bereich der Benchmarkergebnisse für diese Grafikkarte
- Durchschnittliche Benchmarkergebnisse für diese Grafikkarte
* Smaller numbers mean a higher performance
1 This benchmark is not used for the average calculation
Spiele-Benchmarks Die folgenden Benchmarks basieren auf unseren Spieletests mit Testnotebooks. Die Performance dieser Grafikkarte bei den gelisteten Spielen ist abhängig von der verwendeten CPU, Speicherausstattung, Treiber und auch Betriebssystem. Dadurch müssen die untenstehenden Werte nicht repräsentativ sein. Detaillierte Informationen über das verwendete System sehen Sie nach einem Klick auf den fps-Wert.
Iris Plus Graphics 655:
44.6 fps
Iris Plus Graphics 655:
21.6 fps
Iris Plus Graphics 655:
16.4 fps
Iris Plus Graphics 655:
10.2 fps
Iris Plus Graphics 655:
40.7 fps
Iris Plus Graphics 655:
19.1 fps
Iris Plus Graphics 655:
14.5 fps
Iris Plus Graphics 655:
9.6 fps
Iris Plus Graphics 655:
54.8 fps
Iris Plus Graphics 655:
17.3 fps
Iris Plus Graphics 655:
11.6 fps
Iris Plus Graphics 655:
0 (!) [X] Intel NUC8i7BE Intel Core i7-8559U 2.7GHz
Iris Plus Graphics 655
Problem during benchmarking occured: Spiel startete nicht fps
Iris Plus Graphics 655:
29.1 [X] Intel NUC8i7BE Intel Core i7-8559U 2.7GHz
Iris Plus Graphics 655
min:
17 fps, max:
36 fps
fps
Iris Plus Graphics 655:
16.2 [X] Intel NUC8i7BE Intel Core i7-8559U 2.7GHz
Iris Plus Graphics 655
min:
11 fps, max:
22 fps
fps
Iris Plus Graphics 655:
14.1 [X] Intel NUC8i7BE Intel Core i7-8559U 2.7GHz
Iris Plus Graphics 655
min:
11 fps, max:
21 fps
fps
Iris Plus Graphics 655:
6.6 [X] Intel NUC8i7BE Intel Core i7-8559U 2.7GHz
Iris Plus Graphics 655
min:
3 fps, max:
9 fps
fps
Iris Plus Graphics 655:
59.8 [X] Intel NUC8i7BE Intel Core i7-8559U 2.7GHz
Iris Plus Graphics 655
min:
56 fps, max:
62 fps
fps
Iris Plus Graphics 655:
27.2 [X] Intel NUC8i7BE Intel Core i7-8559U 2.7GHz
Iris Plus Graphics 655
min:
20 fps, max:
31 fps
fps
Iris Plus Graphics 655:
15.8 [X] Intel NUC8i7BE Intel Core i7-8559U 2.7GHz
Iris Plus Graphics 655
min:
3.7 fps, P1:
6.17 fps, max:
130 fps
fps
Iris Plus Graphics 655:
0 (!) [X] Intel NUC8i7BE Intel Core i7-8559U 2.7GHz
Iris Plus Graphics 655
Problem during benchmarking occured: Spiel startete nicht fps
Iris Plus Graphics 655:
36.3 (!) [X] Intel NUC8i7BE Intel Core i7-8559U 2.7GHz
Iris Plus Graphics 655
Problem during benchmarking occured: Schwere grafische Probleme P1:
24.6 fps
fps
Iris Plus Graphics 655:
20.9 (!) [X] Intel NUC8i7BE Intel Core i7-8559U 2.7GHz
Iris Plus Graphics 655
Problem during benchmarking occured: Schwere grafische Probleme P1:
14.5 fps
fps
Iris Plus Graphics 655:
0 (!) [X] Intel NUC8i7BE Intel Core i7-8559U 2.7GHz
Iris Plus Graphics 655
Problem during benchmarking occured: Spiel startete nicht fps
Iris Plus Graphics 655:
92 [X] Intel NUC8i7BE DirectX 11
Intel Core i7-8559U 2.7GHz
Iris Plus Graphics 655
P1:
74.1 fps
fps
Iris Plus Graphics 655:
55.9 [X] Intel NUC8i7BE DirectX 11
Intel Core i7-8559U 2.7GHz
Iris Plus Graphics 655
P1:
47.4 fps
fps
Iris Plus Graphics 655:
46.3 [X] Intel NUC8i7BE DirectX 11
Intel Core i7-8559U 2.7GHz
Iris Plus Graphics 655
P1:
35.6 fps
fps
Iris Plus Graphics 655:
34.9 [X] Intel NUC8i7BE DirectX 11
Intel Core i7-8559U 2.7GHz
Iris Plus Graphics 655
P1:
31.3 fps
fps
Iris Plus Graphics 655:
26.5 [X] Intel NUC8i7BE DirectX 11
Intel Core i7-8559U 2.7GHz
Iris Plus Graphics 655
P1:
24 fps
fps
Iris Plus Graphics 655:
13.6 [X] Intel NUC8i7BE DirectX 11
Intel Core i7-8559U 2.7GHz
Iris Plus Graphics 655
P1:
12 fps
fps
Iris Plus Graphics 655:
22.5 23.5 ~ 23 fps
Iris Plus Graphics 655:
10.2 10.4 ~ 10 fps
Iris Plus Graphics 655:
6.4 6.7 ~ 7 fps
Iris Plus Graphics 655:
25.4 (!) [X] Intel NUC8i7BE Intel Core i7-8559U 2.7GHz
Iris Plus Graphics 655
Problem during benchmarking occured: Schwere grafische Probleme min:
20 fps, max:
31 fps
fps
Iris Plus Graphics 655:
51.2 [X] Intel NUC8i7BE Intel Core i7-8559U 2.7GHz
Iris Plus Graphics 655
min:
46 fps, max:
56 fps
fps
Iris Plus Graphics 655:
21.9 [X] Intel NUC8i7BE Intel Core i7-8559U 2.7GHz
Iris Plus Graphics 655
min:
19 fps, max:
23 fps
fps
Iris Plus Graphics 655:
19.3 [X] Intel NUC8i7BE Intel Core i7-8559U 2.7GHz
Iris Plus Graphics 655
min:
17 fps, max:
21 fps
fps
Iris Plus Graphics 655:
56.7 [X] Intel NUC8i7BE Intel Core i7-8559U 2.7GHz
Iris Plus Graphics 655
min:
51 fps, max:
63 fps
fps
Iris Plus Graphics 655:
18.5 [X] Intel NUC8i7BE Intel Core i7-8559U 2.7GHz
Iris Plus Graphics 655
min:
14 fps, max:
24 fps
fps
Iris Plus Graphics 655:
10.5 [X] Intel NUC8i7BE Intel Core i7-8559U 2.7GHz
Iris Plus Graphics 655
min:
8 fps, max:
13 fps
fps
Iris Plus Graphics 655:
24.5 fps
Iris Plus Graphics 655:
30.2 [X] Intel NUC8i7BE Intel Core i7-8559U 2.7GHz
Iris Plus Graphics 655
min:
26 fps, max:
34 fps
fps
Iris Plus Graphics 655:
35 fps
100%
GeForce GTX 1050 Ti Max-Q:
133.2 fps
48%
Iris Plus Graphics 655:
64 [X] Intel NUC8i7BE Intel Core i7-8559U 2.7GHz
Iris Plus Graphics 655
min:
57 fps, max:
76 fps
fps
100%
GeForce GTX 1050 Ti Max-Q:
56.7 fps
40%
Iris Plus Graphics 655:
22.8 [X] Intel NUC8i7BE Intel Core i7-8559U 2.7GHz
Iris Plus Graphics 655
min:
20 fps, max:
25 fps
fps
100%
GeForce GTX 1050 Ti Max-Q:
44.3 fps
100%
GeForce GTX 1050 Ti Max-Q:
27.2 fps
100%
GeForce GTX 1050 Ti Max-Q:
11.3 fps
100%
GeForce GTX 1050 Ti Max-Q:
67.1 fps
25%
Iris Plus Graphics 655:
16.6 [X] Intel NUC8i7BE Intel Core i7-8559U 2.7GHz
Iris Plus Graphics 655
min:
8 fps, max:
21 fps
fps
100%
GeForce GTX 1050 Ti Max-Q:
40.5 fps
100%
GeForce GTX 1050 Ti Max-Q:
34 fps
100%
GeForce GTX 1050 Ti Max-Q:
30.4 fps
100%
GeForce GTX 1050 Ti Max-Q:
9 fps
100%
GeForce GTX 1050 Ti Max-Q:
83 89 [X] MSI GF75 8RD-001 Intel Core i7-8750H 2.2GHz
GeForce GTX 1050 Ti Max-Q
min:
61 fps, max:
89 fps
~ 86 fps
26%
Iris Plus Graphics 655:
21 22 [X] Intel NUC8i7BE Intel Core i7-8559U 2.7GHz
Iris Plus Graphics 655
min:
19 fps, max:
27 fps
~ 22 fps
100%
GeForce GTX 1050 Ti Max-Q:
47 50 [X] MSI GF75 8RD-001 Intel Core i7-8750H 2.2GHz
GeForce GTX 1050 Ti Max-Q
min:
40 fps, max:
60 fps
~ 49 fps
22%
Iris Plus Graphics 655:
11 [X] Intel NUC8i7BE Intel Core i7-8559U 2.7GHz
Iris Plus Graphics 655
min:
10 fps, max:
14 fps
11 ~ 11 fps
100%
GeForce GTX 1050 Ti Max-Q:
43 46 [X] MSI GF75 8RD-001 Intel Core i7-8750H 2.2GHz
GeForce GTX 1050 Ti Max-Q
min:
38 fps, max:
56 fps
~ 45 fps
22%
Iris Plus Graphics 655:
10 fps
100%
GeForce GTX 1050 Ti Max-Q:
40 43 [X] MSI GF75 8RD-001 Intel Core i7-8750H 2.2GHz
GeForce GTX 1050 Ti Max-Q
min:
33 fps, max:
53 fps
~ 42 fps
21%
Iris Plus Graphics 655:
9 fps
100%
GeForce GTX 1050 Ti Max-Q:
29 [X] MSI GF75 8RD-001 Intel Core i7-8750H 2.2GHz
GeForce GTX 1050 Ti Max-Q
min:
24 fps, max:
37 fps
fps
100%
GeForce GTX 1050 Ti Max-Q:
14 15 [X] MSI GF75 8RD-001 Intel Core i7-8750H 2.2GHz
GeForce GTX 1050 Ti Max-Q
min:
11 fps, max:
19 fps
~ 15 fps
100%
GeForce GTX 1050 Ti Max-Q:
55.5 60.4 [X] MSI GF75 8RD-001 Intel Core i7-8750H 2.2GHz
GeForce GTX 1050 Ti Max-Q
min:
31.8 fps, max:
115.6 fps
~ 58 fps
33%
Iris Plus Graphics 655:
18.3 [X] Intel NUC8i7BE Intel Core i7-8559U 2.7GHz
Iris Plus Graphics 655
min:
10.36 fps, max:
31.73 fps
20.1 ~ 19 fps
100%
GeForce GTX 1050 Ti Max-Q:
31.4 [X] MSI GF75 8RD-001 Intel Core i7-8750H 2.2GHz
GeForce GTX 1050 Ti Max-Q
min:
15.8 fps, max:
53.7 fps
49.8 ~ 41 fps
25%
Iris Plus Graphics 655:
10.1 fps
100%
GeForce GTX 1050 Ti Max-Q:
23.5 [X] MSI GF75 8RD-001 Intel Core i7-8750H 2.2GHz
GeForce GTX 1050 Ti Max-Q
min:
12.1 fps, max:
39.8 fps
36.5 ~ 30 fps
25%
Iris Plus Graphics 655:
7.4 fps
100%
GeForce GTX 1050 Ti Max-Q:
19.3 [X] MSI GF75 8RD-001 Intel Core i7-8750H 2.2GHz
GeForce GTX 1050 Ti Max-Q
min:
10.4 fps, max:
19.3 fps
28.3 ~ 24 fps
100%
GeForce GTX 1050 Ti Max-Q:
4.7 fps
100%
GeForce GTX 1050 Ti Max-Q:
73.2 fps
100%
GeForce GTX 1050 Ti Max-Q:
47.9 fps
100%
GeForce GTX 1050 Ti Max-Q:
36.1 fps
100%
GeForce GTX 1050 Ti Max-Q:
35.3 fps
100%
GeForce GTX 1050 Ti Max-Q:
12.9 fps
100%
GeForce GTX 1050 Ti Max-Q:
134.5 fps
100%
GeForce GTX 1050 Ti Max-Q:
87.4 fps
100%
GeForce GTX 1050 Ti Max-Q:
73.7 fps
100%
GeForce GTX 1050 Ti Max-Q:
65 fps
100%
GeForce GTX 1050 Ti Max-Q:
13.2 fps
100%
GeForce GTX 1050 Ti Max-Q:
100.1 fps
20%
Iris Plus Graphics 655:
19.9 [X] Intel NUC8i7BE Intel Core i7-8559U 2.7GHz
Iris Plus Graphics 655
min:
1 fps, max:
33 fps
fps
100%
GeForce GTX 1050 Ti Max-Q:
57.3 fps
100%
GeForce GTX 1050 Ti Max-Q:
47.9 fps
100%
GeForce GTX 1050 Ti Max-Q:
44.8 fps
100%
GeForce GTX 1050 Ti Max-Q:
17.3 fps
100%
GeForce GTX 1050 Ti Max-Q:
193.6 fps
100%
GeForce GTX 1050 Ti Max-Q:
128.7 fps
100%
GeForce GTX 1050 Ti Max-Q:
80.5 fps
100%
GeForce GTX 1050 Ti Max-Q:
61 fps
100%
GeForce GTX 1050 Ti Max-Q:
22 fps
100%
GeForce GTX 1050 Ti Max-Q:
64.8 fps
100%
GeForce GTX 1050 Ti Max-Q:
41 fps
100%
GeForce GTX 1050 Ti Max-Q:
37.5 fps
100%
GeForce GTX 1050 Ti Max-Q:
35.9 fps
100%
GeForce GTX 1050 Ti Max-Q:
11.3 fps
100%
GeForce GTX 1050 Ti Max-Q:
118.7 fps
0%
Iris Plus Graphics 655:
0 (!) fps
100%
GeForce GTX 1050 Ti Max-Q:
46.3 fps
100%
GeForce GTX 1050 Ti Max-Q:
45 fps
100%
GeForce GTX 1050 Ti Max-Q:
37.5 fps
100%
GeForce GTX 1050 Ti Max-Q:
10.1 fps
100%
GeForce GTX 1050 Ti Max-Q:
67 fps
24%
Iris Plus Graphics 655:
13 18 [X] Intel NUC8i7BE Intel Core i7-8559U 2.7GHz
Iris Plus Graphics 655
min:
7 fps, max:
26 fps
~ 16 fps
100%
GeForce GTX 1050 Ti Max-Q:
43 fps
100%
GeForce GTX 1050 Ti Max-Q:
34 fps
100%
GeForce GTX 1050 Ti Max-Q:
18 fps
100%
GeForce GTX 1050 Ti Max-Q:
7 fps
100%
GeForce GTX 1050 Ti Max-Q:
122 fps
20%
Iris Plus Graphics 655:
25 fps
100%
GeForce GTX 1050 Ti Max-Q:
67 fps
0%
Iris Plus Graphics 655:
0 (!) fps
100%
GeForce GTX 1050 Ti Max-Q:
61 fps
100%
GeForce GTX 1050 Ti Max-Q:
47 fps
100%
GeForce GTX 1050 Ti Max-Q:
20 fps
Iris Plus Graphics 655:
82 [X] Intel NUC8i7BE Intel Core i7-8559U 2.7GHz
Iris Plus Graphics 655
min:
70 fps, max:
96 fps
fps
Iris Plus Graphics 655:
45.8 [X] Intel NUC8i7BE Intel Core i7-8559U 2.7GHz
Iris Plus Graphics 655
min:
39 fps, max:
51 fps
fps
Iris Plus Graphics 655:
40.3 [X] Intel NUC8i7BE Intel Core i7-8559U 2.7GHz
Iris Plus Graphics 655
min:
32 fps, max:
48 fps
fps
Iris Plus Graphics 655:
36.7 [X] Intel NUC8i7BE Intel Core i7-8559U 2.7GHz
Iris Plus Graphics 655
min:
30 fps, max:
45 fps
fps
100%
GeForce GTX 1050 Ti Max-Q:
97 fps
22%
Iris Plus Graphics 655:
19 [X] Geekom Mini IT8-GM08i5T Intel Core i5-8259U 2.3GHz
Iris Plus Graphics 655
20.5 22 [X] Intel NUC8i7BE Intel Core i7-8559U 2.7GHz
Iris Plus Graphics 655
min:
17 fps, max:
37 fps
23.5 ~ 21 fps
100%
GeForce GTX 1050 Ti Max-Q:
39 fps
31%
Iris Plus Graphics 655:
11 13 [X] Geekom Mini IT8-GM08i5T Intel Core i5-8259U 2.3GHz
Iris Plus Graphics 655
~ 12 fps
100%
GeForce GTX 1050 Ti Max-Q:
35 fps
26%
Iris Plus Graphics 655:
8 [X] Geekom Mini IT8-GM08i5T Intel Core i5-8259U 2.3GHz
Iris Plus Graphics 655
10.1 ~ 9 fps
100%
GeForce GTX 1050 Ti Max-Q:
29 fps
100%
GeForce GTX 1050 Ti Max-Q:
11 fps
Iris Plus Graphics 655:
41.4 fps
Iris Plus Graphics 655:
17.6 fps
Iris Plus Graphics 655:
16.9 fps
Iris Plus Graphics 655:
14.5 fps
100%
GeForce GTX 1050 Ti Max-Q:
134 fps
34%
Iris Plus Graphics 655:
45 fps
100%
GeForce GTX 1050 Ti Max-Q:
80 fps
29%
Iris Plus Graphics 655:
23 fps
100%
GeForce GTX 1050 Ti Max-Q:
62 fps
27%
Iris Plus Graphics 655:
17 fps
100%
GeForce GTX 1050 Ti Max-Q:
38 fps
32%
Iris Plus Graphics 655:
12 12 ~ 12 fps
100%
GeForce GTX 1050 Ti Max-Q:
17 fps
100%
GeForce GTX 1050 Ti Max-Q:
100.3 fps
100%
GeForce GTX 1050 Ti Max-Q:
39.2 fps
100%
GeForce GTX 1050 Ti Max-Q:
34.9 fps
100%
GeForce GTX 1050 Ti Max-Q:
26.8 fps
100%
GeForce GTX 1050 Ti Max-Q:
8.3 fps
100%
GeForce GTX 1050 Ti Max-Q:
60 fps
52%
Iris Plus Graphics 655:
30.9 fps
100%
GeForce GTX 1050 Ti Max-Q:
49.1 fps
100%
GeForce GTX 1050 Ti Max-Q:
45.3 fps
100%
GeForce GTX 1050 Ti Max-Q:
42 fps
100%
GeForce GTX 1050 Ti Max-Q:
14 fps
100%
GeForce GTX 1050 Ti Max-Q:
76 91 91 ~ 86 fps
26%
Iris Plus Graphics 655:
20 22 23 [X] Intel NUC8i7BE Intel Core i7-8559U 2.7GHz
Iris Plus Graphics 655
min:
20 fps, max:
28 fps
~ 22 fps
100%
GeForce GTX 1050 Ti Max-Q:
45 48 48 ~ 47 fps
23%
Iris Plus Graphics 655:
10 11 [X] Intel NUC8i7BE Intel Core i7-8559U 2.7GHz
Iris Plus Graphics 655
min:
10 fps, max:
14 fps
11 ~ 11 fps
100%
GeForce GTX 1050 Ti Max-Q:
41 44 44 ~ 43 fps
23%
Iris Plus Graphics 655:
10 fps
100%
GeForce GTX 1050 Ti Max-Q:
38 38 41 ~ 39 fps
23%
Iris Plus Graphics 655:
9 fps
100%
GeForce GTX 1050 Ti Max-Q:
13 13 14 ~ 13 fps
Iris Plus Graphics 655:
15.7 250 ~ 133 fps
Iris Plus Graphics 655:
40.3 fps
100%
GeForce GTX 1050 Ti Max-Q:
92.7 fps
28%
Iris Plus Graphics 655:
13.8 [X] Chuwi CoreBook X Pro Intel Core i5-8259U 2.3GHz
Iris Plus Graphics 655
21.2 22.4 [X] Beelink SEi8 Intel Core i3-8109U 3GHz
Iris Plus Graphics 655
25.3 [X] GMK NucBox 2 Intel Core i5-8259U 2.3GHz
Iris Plus Graphics 655
26.8 32.6 42.8 ~ 26 fps
100%
GeForce GTX 1050 Ti Max-Q:
80.3 fps
22%
Iris Plus Graphics 655:
9.8 [X] Chuwi CoreBook X Pro Intel Core i5-8259U 2.3GHz
Iris Plus Graphics 655
15 [X] Beelink SEi8 Intel Core i3-8109U 3GHz
Iris Plus Graphics 655
15.3 18 [X] GMK NucBox 2 Intel Core i5-8259U 2.3GHz
Iris Plus Graphics 655
18.4 23.3 29.5 ~ 18 fps
100%
GeForce GTX 1050 Ti Max-Q:
69.4 fps
23%
Iris Plus Graphics 655:
8.6 [X] Chuwi CoreBook X Pro Intel Core i5-8259U 2.3GHz
Iris Plus Graphics 655
12.3 [X] Beelink SEi8 Intel Core i3-8109U 3GHz
Iris Plus Graphics 655
13.4 15.9 [X] GMK NucBox 2 Intel Core i5-8259U 2.3GHz
Iris Plus Graphics 655
16 19.8 25.1 ~ 16 fps
100%
GeForce GTX 1050 Ti Max-Q:
39.5 fps
100%
GeForce GTX 1050 Ti Max-Q:
61.5 75.1 ~ 68 fps
24%
Iris Plus Graphics 655:
9.1 [X] Chuwi CoreBook X Pro 1.3
Intel Core i5-8259U 2.3GHz
Iris Plus Graphics 655
14.7 15.6 16.6 [X] Beelink SEi8 1.3
Intel Core i3-8109U 3GHz
Iris Plus Graphics 655
16.9 17 [X] Geekom Mini IT8-GM08i5T Intel Core i5-8259U 2.3GHz
Iris Plus Graphics 655
17.3 [X] GMK NucBox 2 1.3
Intel Core i5-8259U 2.3GHz
Iris Plus Graphics 655
18.1 ~ 16 fps
100%
GeForce GTX 1050 Ti Max-Q:
36.6 37.7 ~ 37 fps
24%
Iris Plus Graphics 655:
7.9 8.8 [X] Beelink SEi8 1.3
Intel Core i3-8109U 3GHz
Iris Plus Graphics 655
9.1 [X] GMK NucBox 2 1.3
Intel Core i5-8259U 2.3GHz
Iris Plus Graphics 655
9.7 ~ 9 fps
100%
GeForce GTX 1050 Ti Max-Q:
23.3 25 ~ 24 fps
25%
Iris Plus Graphics 655:
5.3 6 [X] GMK NucBox 2 1.3
Intel Core i5-8259U 2.3GHz
Iris Plus Graphics 655
6.1 [X] Beelink SEi8 1.3
Intel Core i3-8109U 3GHz
Iris Plus Graphics 655
6.6 ~ 6 fps
100%
GeForce GTX 1050 Ti Max-Q:
9.2 fps
Iris Plus Graphics 655:
51.5 fps
Iris Plus Graphics 655:
21.6 fps
100%
GeForce GTX 1050 Ti Max-Q:
92.3 fps
100%
GeForce GTX 1050 Ti Max-Q:
42 fps
100%
GeForce GTX 1050 Ti Max-Q:
34.3 fps
100%
GeForce GTX 1050 Ti Max-Q:
30.4 fps
100%
GeForce GTX 1050 Ti Max-Q:
58 fps
22%
Iris Plus Graphics 655:
13 fps
100%
GeForce GTX 1050 Ti Max-Q:
41 fps
100%
GeForce GTX 1050 Ti Max-Q:
33 fps
100%
GeForce GTX 1050 Ti Max-Q:
27 fps
100%
GeForce GTX 1050 Ti Max-Q:
13 fps
100%
GeForce GTX 1050 Ti Max-Q:
119.5 fps
100%
GeForce GTX 1050 Ti Max-Q:
69.4 fps
100%
GeForce GTX 1050 Ti Max-Q:
64.3 fps
100%
GeForce GTX 1050 Ti Max-Q:
57.9 fps
100%
GeForce GTX 1050 Ti Max-Q:
18.9 fps
100%
GeForce GTX 1050 Ti Max-Q:
105 fps
29%
Iris Plus Graphics 655:
30 fps
100%
GeForce GTX 1050 Ti Max-Q:
55 fps
33%
Iris Plus Graphics 655:
18 fps
100%
GeForce GTX 1050 Ti Max-Q:
41 fps
34%
Iris Plus Graphics 655:
14 fps
100%
GeForce GTX 1050 Ti Max-Q:
31 fps
29%
Iris Plus Graphics 655:
9 fps
100%
GeForce GTX 1050 Ti Max-Q:
13 fps
100%
GeForce GTX 1050 Ti Max-Q:
129.8 fps
99%
Iris Plus Graphics 655:
128 fps
100%
GeForce GTX 1050 Ti Max-Q:
123.6 fps
101%
Iris Plus Graphics 655:
125 fps
100%
GeForce GTX 1050 Ti Max-Q:
115.7 fps
98%
Iris Plus Graphics 655:
113 fps
100%
GeForce GTX 1050 Ti Max-Q:
112.6 fps
51%
Iris Plus Graphics 655:
57.8 fps
100%
GeForce GTX 1050 Ti Max-Q:
65.2 fps
53%
Iris Plus Graphics 655:
34.4 fps
100%
GeForce GTX 1050 Ti Max-Q:
249.1 fps
41%
Iris Plus Graphics 655:
78 [X] Geekom Mini IT8-GM08i5T Intel Core i5-8259U 2.3GHz
Iris Plus Graphics 655
97 133.3 ~ 103 fps
100%
GeForce GTX 1050 Ti Max-Q:
169.1 fps
29%
Iris Plus Graphics 655:
40.6 46 [X] Geekom Mini IT8-GM08i5T Intel Core i5-8259U 2.3GHz
Iris Plus Graphics 655
59.1 ~ 49 fps
100%
GeForce GTX 1050 Ti Max-Q:
112.5 fps
32%
Iris Plus Graphics 655:
32.7 36 [X] Geekom Mini IT8-GM08i5T Intel Core i5-8259U 2.3GHz
Iris Plus Graphics 655
38.8 ~ 36 fps
100%
GeForce GTX 1050 Ti Max-Q:
42.3 fps
100%
GeForce GTX 1050 Ti Max-Q:
142.4 fps
100%
GeForce GTX 1050 Ti Max-Q:
85.6 fps
100%
GeForce GTX 1050 Ti Max-Q:
68.3 fps
100%
GeForce GTX 1050 Ti Max-Q:
58.9 fps
100%
GeForce GTX 1050 Ti Max-Q:
21.7 fps
100%
GeForce GTX 1050 Ti Max-Q:
68.6 96.7 ~ 83 fps
27%
Iris Plus Graphics 655:
20.4 22.7 [X] Intel NUC8i7BE Intel Core i7-8559U 2.7GHz
Iris Plus Graphics 655
min:
15 fps, max:
27 fps
~ 22 fps
24%
Iris Plus Graphics 655:
10.2 fps
100%
GeForce GTX 1050 Ti Max-Q:
35.3 40 41.9 ~ 39 fps
100%
GeForce GTX 1050 Ti Max-Q:
13.9 14.5 ~ 14 fps
100%
GeForce GTX 1050 Ti Max-Q:
113.6 179.3 ~ 146 fps
14%
Iris Plus Graphics 655:
0 (!) 41.3 [X] Intel NUC8i7BE Intel Core i7-8559U 2.7GHz
Iris Plus Graphics 655
min:
31 fps, max:
65 fps
~ 21 fps
100%
GeForce GTX 1050 Ti Max-Q:
63.8 68.2 ~ 66 fps
24%
Iris Plus Graphics 655:
16.1 [X] Intel NUC8i7BE Intel Core i7-8559U 2.7GHz
Iris Plus Graphics 655
min:
13 fps, max:
21 fps
fps
100%
GeForce GTX 1050 Ti Max-Q:
64.9 65.5 ~ 65 fps
100%
GeForce GTX 1050 Ti Max-Q:
49.5 50.4 ~ 50 fps
100%
GeForce GTX 1050 Ti Max-Q:
19.2 19.2 ~ 19 fps
100%
GeForce GTX 1050 Ti Max-Q:
137.3 fps
100%
GeForce GTX 1050 Ti Max-Q:
104.6 fps
100%
GeForce GTX 1050 Ti Max-Q:
89.5 154.8 ~ 122 fps
100%
GeForce GTX 1050 Ti Max-Q:
85.2 120 ~ 103 fps
100%
GeForce GTX 1050 Ti Max-Q:
51.7 58.1 ~ 55 fps
100%
GeForce GTX 1050 Ti Max-Q:
49.8 53.1 ~ 51 fps
100%
GeForce GTX 1050 Ti Max-Q:
20.7 21.1 ~ 21 fps
100%
GeForce GTX 1050 Ti Max-Q:
112.5 fps
100%
GeForce GTX 1050 Ti Max-Q:
85.8 fps
100%
GeForce GTX 1050 Ti Max-Q:
51 fps
100%
GeForce GTX 1050 Ti Max-Q:
43 fps
Iris Plus Graphics 655:
28.7 [X] Intel NUC8i7BE Intel Core i7-8559U 2.7GHz
Iris Plus Graphics 655
min:
2.6 fps, max:
41.3 fps
fps
Iris Plus Graphics 655:
21.1 [X] Intel NUC8i7BE Intel Core i7-8559U 2.7GHz
Iris Plus Graphics 655
min:
16 fps, max:
29 fps
fps
100%
GeForce GTX 1050 Ti Max-Q:
285.4 fps
32%
Iris Plus Graphics 655:
91 fps
100%
GeForce GTX 1050 Ti Max-Q:
233.9 fps
29%
Iris Plus Graphics 655:
68 fps
100%
GeForce GTX 1050 Ti Max-Q:
117.7 fps
25%
Iris Plus Graphics 655:
29.9 fps
100%
GeForce GTX 1050 Ti Max-Q:
70.5 fps
26%
Iris Plus Graphics 655:
18.2 fps
100%
GeForce GTX 1050 Ti Max-Q:
37 fps
100%
GeForce GTX 1050 Ti Max-Q:
63 fps
31%
Iris Plus Graphics 655:
19.4 fps
100%
GeForce GTX 1050 Ti Max-Q:
41.3 fps
27%
Iris Plus Graphics 655:
11.3 fps
100%
GeForce GTX 1050 Ti Max-Q:
35.8 fps
29%
Iris Plus Graphics 655:
10.5 fps
100%
GeForce GTX 1050 Ti Max-Q:
15.7 fps
100%
GeForce GTX 1050 Ti Max-Q:
114.2 137.2 ~ 126 fps
27%
Iris Plus Graphics 655:
34.2 fps
100%
GeForce GTX 1050 Ti Max-Q:
83.4 89.5 ~ 86 fps
25%
Iris Plus Graphics 655:
21.2 fps
100%
GeForce GTX 1050 Ti Max-Q:
41.9 42.5 ~ 42 fps
100%
GeForce GTX 1050 Ti Max-Q:
32.2 34.8 ~ 34 fps
100%
GeForce GTX 1050 Ti Max-Q:
14.6 15.7 ~ 15 fps
26%
Iris Plus Graphics 655:
25.9 39.2 ~ 33 fps
26%
Iris Plus Graphics 655:
17.6 22.3 ~ 20 fps
24%
Iris Plus Graphics 655:
10.8 fps
23%
Iris Plus Graphics 655:
8.9 fps
100%
GeForce GTX 1050 Ti Max-Q:
16.8 17.1 ~ 17 fps
100%
GeForce GTX 1050 Ti Max-Q:
236.6 263.6 ~ 250 fps
30%
Iris Plus Graphics 655:
75.8 [X] Intel NUC8i7BE Intel Core i7-8559U 2.7GHz
Iris Plus Graphics 655
min:
12 fps, max:
128 fps
fps
100%
GeForce GTX 1050 Ti Max-Q:
154.6 162.2 ~ 158 fps
0%
Iris Plus Graphics 655:
0 (!) [X] Intel NUC8i7BE Intel Core i7-8559U 2.7GHz
Iris Plus Graphics 655
Problem during benchmarking occured: Spiel startete nicht fps
100%
GeForce GTX 1050 Ti Max-Q:
90.2 92.7 ~ 91 fps
100%
GeForce GTX 1050 Ti Max-Q:
62.5 67.5 ~ 65 fps
100%
GeForce GTX 1050 Ti Max-Q:
27.7 29.3 ~ 29 fps
100%
GeForce GTX 1050 Ti Max-Q:
168.6 fps
100%
GeForce GTX 1050 Ti Max-Q:
143.9 fps
100%
GeForce GTX 1050 Ti Max-Q:
112.7 fps
100%
GeForce GTX 1050 Ti Max-Q:
101 fps
100%
GeForce GTX 1050 Ti Max-Q:
34.4 fps
100%
GeForce GTX 1050 Ti Max-Q:
111.9 fps
77%
Iris Plus Graphics 655:
51.4 [X] Chuwi CoreBook X Pro Intel Core i5-8259U 2.3GHz
Iris Plus Graphics 655
min:
43.6 fps, max:
-1 fps
84 86.8 87.9 92.6 [X] Chuwi CoreBook X Intel Core i5-8259U 2.3GHz
Iris Plus Graphics 655
min:
74.2 fps, max:
-1 fps
94.4 [X] Beelink SEi8 Intel Core i3-8109U 3GHz
Iris Plus Graphics 655
min:
75.6 fps, max:
-1 fps
95 98 [X] GMK NucBox 2 Intel Core i5-8259U 2.3GHz
Iris Plus Graphics 655
min:
79.8 fps, max:
-1 fps
~ 86 fps
100%
GeForce GTX 1050 Ti Max-Q:
104.2 fps
56%
Iris Plus Graphics 655:
34.6 [X] Beelink SEi8 Intel Core i3-8109U 3GHz
Iris Plus Graphics 655
min:
29.8 fps, max:
-1 fps
37.1 [X] Chuwi CoreBook X Pro Intel Core i5-8259U 2.3GHz
Iris Plus Graphics 655
min:
32.3 fps, max:
-1 fps
57 [X] Chuwi CoreBook X Intel Core i5-8259U 2.3GHz
Iris Plus Graphics 655
min:
48.7 fps, max:
-1 fps
63 64 66 [X] GMK NucBox 2 Intel Core i5-8259U 2.3GHz
Iris Plus Graphics 655
min:
54.7 fps, max:
-1 fps
68 77.9 ~ 58 fps
100%
GeForce GTX 1050 Ti Max-Q:
98.1 fps
30%
Iris Plus Graphics 655:
15.8 [X] Chuwi CoreBook X Pro Intel Core i5-8259U 2.3GHz
Iris Plus Graphics 655
min:
14.5 fps, max:
-1 fps
25.3 [X] Beelink SEi8 Intel Core i3-8109U 3GHz
Iris Plus Graphics 655
min:
19.3 fps, max:
-1 fps
27.8 [X] Chuwi CoreBook X Intel Core i5-8259U 2.3GHz
Iris Plus Graphics 655
min:
24.9 fps, max:
-1 fps
31.9 [X] GMK NucBox 2 Intel Core i5-8259U 2.3GHz
Iris Plus Graphics 655
min:
29.3 fps, max:
-1 fps
32.4 33.3 34.5 34.7 ~ 29 fps
100%
GeForce GTX 1050 Ti Max-Q:
93.5 fps
28%
Iris Plus Graphics 655:
13.4 [X] Chuwi CoreBook X Pro Intel Core i5-8259U 2.3GHz
Iris Plus Graphics 655
min:
12.5 fps, max:
-1 fps
22.7 [X] Beelink SEi8 Intel Core i3-8109U 3GHz
Iris Plus Graphics 655
min:
18.8 fps, max:
-1 fps
24.5 [X] Chuwi CoreBook X Intel Core i5-8259U 2.3GHz
Iris Plus Graphics 655
min:
22.1 fps, max:
-1 fps
27.7 [X] GMK NucBox 2 Intel Core i5-8259U 2.3GHz
Iris Plus Graphics 655
min:
25.5 fps, max:
-1 fps
28.1 28.1 29.9 30.4 ~ 26 fps
100%
GeForce GTX 1050 Ti Max-Q:
46 fps
26%
Iris Plus Graphics 655:
11.6 12.2 ~ 12 fps
19%
Iris Plus Graphics 655:
14.6 17.8 ~ 16 fps
23%
Iris Plus Graphics 655:
10.1 10.9 ~ 11 fps
21%
Iris Plus Graphics 655:
5.6 5.6 ~ 6 fps
100%
GeForce GTX 1050 Ti Max-Q:
150.4 fps
41%
Iris Plus Graphics 655:
57 61 68 [X] Intel NUC8i7BE Intel Core i7-8559U 2.7GHz
Iris Plus Graphics 655
min:
17.5 fps, P1:
40 fps, max:
131 fps
~ 62 fps
100%
GeForce GTX 1050 Ti Max-Q:
143.3 fps
38%
Iris Plus Graphics 655:
51.2 51.8 62.1 [X] Intel NUC8i7BE Intel Core i7-8559U 2.7GHz
Iris Plus Graphics 655
min:
15.1 fps, P1:
37 fps, max:
117 fps
~ 55 fps
100%
GeForce GTX 1050 Ti Max-Q:
78.9 fps
19%
Iris Plus Graphics 655:
13.7 14.3 15.8 [X] Intel NUC8i7BE Intel Core i7-8559U 2.7GHz
Iris Plus Graphics 655
min:
8.44 fps, P1:
11.9 fps, max:
85.5 fps
~ 15 fps
100%
GeForce GTX 1050 Ti Max-Q:
34.5 fps
17%
Iris Plus Graphics 655:
5.2 5.5 6.2 [X] Intel NUC8i7BE Intel Core i7-8559U 2.7GHz
Iris Plus Graphics 655
min:
3.37 fps, P1:
4.2 fps, max:
28.7 fps
~ 6 fps
Iris Plus Graphics 655:
4.2 [X] Intel NUC8i7BE Intel Core i7-8559U 2.7GHz
Iris Plus Graphics 655
min:
2.38 fps, P1:
2.82 fps, max:
99 fps
fps
100%
GeForce GTX 1050 Ti Max-Q:
35.5 fps
35%
Iris Plus Graphics 655:
78.4 116.6 ~ 98 fps
29%
Iris Plus Graphics 655:
54.3 64.8 ~ 60 fps
29%
Iris Plus Graphics 655:
49.4 55 ~ 52 fps
22%
Iris Plus Graphics 655:
15.5 17 ~ 16 fps
Iris Plus Graphics 655:
93.7 fps
Iris Plus Graphics 655:
49.6 fps
Iris Plus Graphics 655:
12.4 fps
100%
GeForce GTX 1050 Ti Max-Q:
228.2 fps
100%
GeForce GTX 1050 Ti Max-Q:
202.6 fps
100%
GeForce GTX 1050 Ti Max-Q:
202.1 fps
100%
GeForce GTX 1050 Ti Max-Q:
170.1 fps
100%
GeForce GTX 1050 Ti Max-Q:
433.4 fps
100%
GeForce GTX 1050 Ti Max-Q:
200.4 fps
100%
GeForce GTX 1050 Ti Max-Q:
186.7 fps
100%
GeForce GTX 1050 Ti Max-Q:
126.7 fps
Average Gaming NVIDIA GeForce GTX 1050 Ti Max-Q → 100% Average Gaming 30-70 fps → 100%
Average Gaming Intel Iris Plus Graphics 655 → 30% Average Gaming 30-70 fps → 38%