NVIDIA GeForce GTX 1050 Ti Max-Q vs Intel Arc A550M vs Intel Arc A770M
NVIDIA GeForce GTX 1050 Ti Max-Q ► remove from comparison
Die Nvidia GeForce GTX 1050 Ti mit Max-Q Design ist eine Mittelklasse-GPU basierend auf der Pascal-Architektur und wurde im Januar 2018 vorgestellt. Anders als die schnelleren Modelle basiert die GTX 1050 Ti auf dem GP107-Chip, der im 14-nm-Verfahren bei Samsung hergestellt wird.
Im Vergleich zur normalen GTX 1050 Ti gibt es noch weitere Unterschiede als den Takt. Der Treiber wurde auf Effizienz (und nicht Leistung) optimiert (nur für die Max-Q Modelle), optimierte Spannungswandler für 1V Betreib, high-end Kühlungsmethoden und eine 40 dB Grenze für die Lüfterlautstärke (mit Taktanpasssungen um dies jederzeit zu gewährleisten) zeichnen die Max-Q Variante aus.
Features
Der GP107-Chip wird in einem 14-nm-FinFET-Prozess bei Samsung gefertigt und bietet eine Reihe neuer Features, unter anderem Support für DisplayPort 1.4 (ready), HDMI 2.0b, HDR, Simultaneous Multi-Projection (SMP) sowie verbessertes H.265 Video De- und Encoding (PlayReady 3.0). Eine genaue Auflistung der Verbesserungen und Features der neuen Pascal Desktop-GPUs finden Sie in unserem Pascal-Architektur-Artikel .
Performance
Die exakte Performance der GeForce GTX 1050 Ti Max-Q kann sich in Abhängigkeit von der Kühlung des jeweiligen Notebooks stark unterscheiden. Im Optimalfall ist die Leistung etwa 10 bis 15 % unterhalb der normalen GTX 1050 Ti angesiedelt. Dadurch eignet sich die Grafikkarte am besten für Full HD (1920 x 1080) bei hoher aber nicht maximaler Detailstufe.
Leistungsaufnahme
Die Leistungsaufnahme der GeForce GTX 1050 Ti Max-Q ist von Nvidia mit 40 - 46 Watt spezifiziert und damit deutlich unterhalb der normalen Notebook GTX 1050 Ti (64 Watt). Selbst die normale GTX 1050 ist mit 53 Watt höher spezifziert. Damit eignet sich die Grafikkarte auch für dünne und leichte 14-Zoll Notebooks.
Intel Arc A550M ► remove from comparison
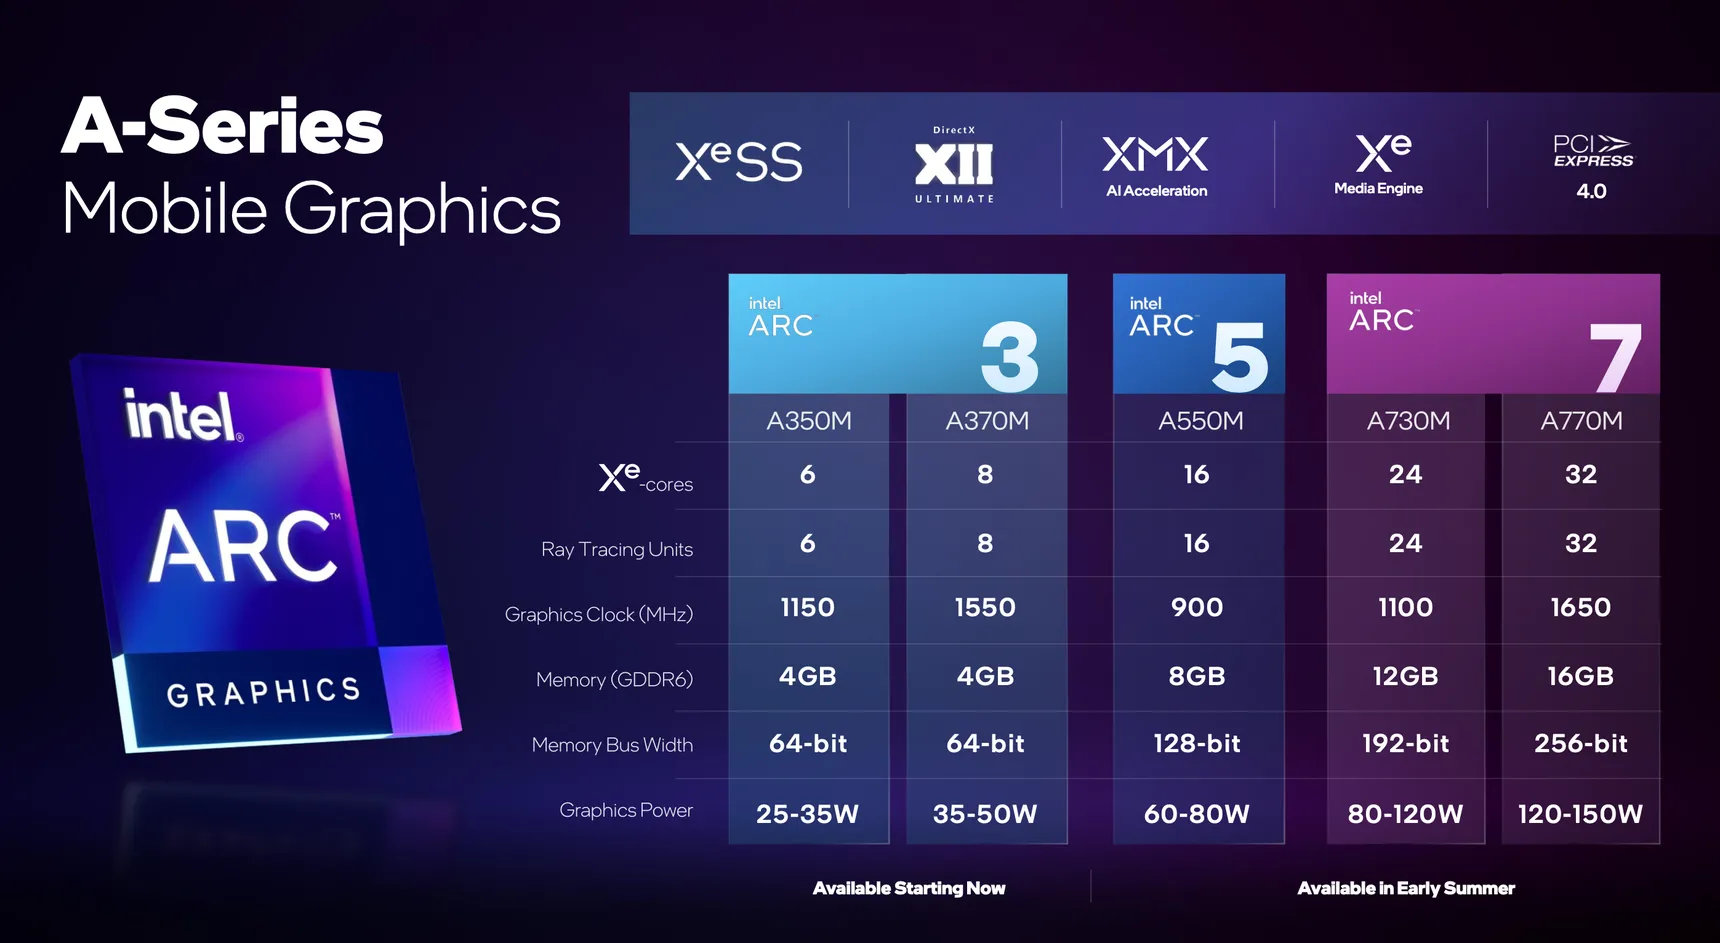
Die Intel Arc A550M (Device ID 5692) ist eine dedizierte Mittelklasse-Grafikkarte von Intel für Notebooks. Sie basiert auf den ACM-G10 Chip und bietet 16 der 32 Xe-Kerne (256 ALUs), 16 Ray-Tracing-Units, 3 MB L1-Cache und 16 MB L2-Cache. Die Kerne takten von 300 MHz über 900 MHz (Gaming) bis zu 2,05 GHz (Turbo). Das Speicherinterface ist 128 Bit breit und unterstützt 8 GB GDDR6 Grafikspeicher mit 14 Gbps. Der TGP ist zwischen 60 und 80 Watt je nach Modell.
Die Performance der A550M liegt in der unteren Mittelklasse von dedizierten Grafikkarten für Notebooks. Damit sollte die Performance wahrscheinlich zwischen Radeon RX 6500M und 6600M liegen und auch anspruchsvolle Spiele mit mittleren bis hohen Detailstufen flüssig darstellen können. Die langsamere Arc A370M basiert auf den kleineren ACM-G11 Chip und bietet eine deutlich schwächere Performance.
Der ACM-G10 Chip wird bei TSMC in 6nm gefertigt (N6 Prozess), nutzt ein BGA2660 Package, bietet 21,7 Mrd. Transistoren und ist 406 mm2 groß. Er integriert zwei Media Engines für VP9, AVC, HEVC, AV1 8k60 12-Bit HDR Dekodierung und 8k 10-Bit HDR Enkodierung. Die integrierten 4 Display Pipes unterstützen 4x 4k120 HDR, HDMI 2.0B, DP 2.0 10G und Adaptive Sync.
Mittels Deep Link kann mit einer CPU der 12. Generation (Alder Lake) Dynamic Power Share genutzt werden.
Intel Arc A770M ► remove from comparison
Die Intel Arc A770M (Device ID 5690) ist eine dedizierte Mittelklasse-Grafikkarte von Intel für Notebooks. Sie basiert auf dem ACM-G10 Chip und bietet alle 32 Xe-Kerne (512 ALUs), 32 Ray-Tracing-Units, 6 MB L1-Cache und 16 MB L2-Cache. Die Taktraten können von 300 MHz über 1650 MHz (Gaming) bis 2050 MHz (Turbo) rangieren. Das Speicherinterface ist 256 Bit breit und unterstützt 16 GB GDDR6 Grafikspeicher mit 16 Gbps. Der TGP ist zwischen 120 und 150 Watt je nach Modell.
Die Performance der A770M liegt in der oberen Mittelklasse von dedizierten Grafikkarten für Notebooks. Die genauen Leistungsdaten sind noch nicht ganz klar, der Stromverbrauch spielt, aber in der Klasse einer RTX 3070 und daher schätzen wir die Performance etwas darunter ein.
Der ACM-G10 Chip wird bei TSMC in 6 nm gefertigt (N6 Prozess), nutzt ein BGA2660 Interface (aufgelöstet), bietet 21,7 Mrd. Transistoren und ist 406 mm² groß. Er integriert zwei Media Engines für VP9, AVC, HEVC, AV1 8k60 12-Bit HDR Dekodierung und 8k 10-Bit HDR Enkodierung. Die integrierten 4 Display Pipes unterstützen 4x 4k120 HDR, HDMI 2.0B, DP 2.0 10G und Adaptive Sync.
Mittels Deep Link kann mit einer CPU der 12. Generation (Alder Lake) Dynamic Power Share genutzt werden.
NVIDIA GeForce GTX 1050 Ti Max-Q Intel Arc A550M Intel Arc A770M Arc Serie Arc A770 4096 @ 2.1 - 2.4 GHz 256 Bit @ 16000 MHz Arc A750 3584 @ 2.05 - 2.4 GHz 256 Bit @ 16000 MHz Arc A580 3072 @ 1.7 - 2 GHz 256 Bit @ 16000 MHz A770M 4096 @ 1.65 GHz 256 Bit @ 16000 MHz A730M 3072 @ 1.1 GHz 192 Bit @ 14000 MHz A570M 16 @ 0.9 - 1.3 GHz 128 Bit @ 14000 MHz A550M 16 @ 0.9 - 2.01 GHz 128 Bit @ 14000 MHz A530M 12 @ 0.9 - 1.3 GHz 128 Bit @ 14000 MHz A370M 8 @ 1.55 GHz 64 Bit @ 14000 MHz Arc A380 1024 @ 2 GHz 96 Bit @ 15500 MHz A310 6 @ 2 GHz 64 Bit @ 15500 MHz A350M 6 @ 1.15 GHz 64 Bit @ 14000 MHz
Arc A770 4096 @ 2.1 - 2.4 GHz 256 Bit @ 16000 MHz Arc A750 3584 @ 2.05 - 2.4 GHz 256 Bit @ 16000 MHz Arc A580 3072 @ 1.7 - 2 GHz 256 Bit @ 16000 MHz A770M 4096 @ 1.65 GHz 256 Bit @ 16000 MHz A730M 3072 @ 1.1 GHz 192 Bit @ 14000 MHz A570M 16 @ 0.9 - 1.3 GHz 128 Bit @ 14000 MHz A550M 16 @ 0.9 - 2.01 GHz 128 Bit @ 14000 MHz A530M 12 @ 0.9 - 1.3 GHz 128 Bit @ 14000 MHz A370M 8 @ 1.55 GHz 64 Bit @ 14000 MHz Arc A380 1024 @ 2 GHz 96 Bit @ 15500 MHz A310 6 @ 2 GHz 64 Bit @ 15500 MHz A350M 6 @ 1.15 GHz 64 Bit @ 14000 MHz
Codename N17P-G1 Max-Q Alchemist Alchemist Architektur Pascal Xe HPG Xe HPG Pipelines 768 - unified 16 - unified 4096 - unified Kerntakt 1151 – 1290 - 1290 – 1417 (Boost) MHz 900 - 2005 (Boost) MHz 1650 MHz Speichertakt 7000 MHz 14000 effective = 1750 MHz 16000 MHz Speicherbandbreite 128 Bit 128 Bit 256 Bit Speichertyp GDDR5 GDDR6 GDDR6 Max. Speichergröße 4 GB 8 GB 16 GB Shared Memory nein nein nein API DirectX 12_1, OpenGL 4.5 DirectX 12_2, Shader 6.6, OpenGL 4.6, OpenCL 3.0, Vulkan 1.3 DirectX 12_2, OpenGL 4.6, Vulkan 1.3 Stromverbrauch 40 - 46 Watt 80 Watt (60 - 80 Watt TGP) 150 Watt (120 - 150 Watt TGP) Herstellungsprozess 16 nm 6 nm 6 nm Features Multi-Projection, VR Ready, G-SYNC, Vulkan, Multi Monitor Notebookgröße mittel (15.4" z.B.) groß (17" z.B.) Erscheinungsdatum 03.01.2018 30.03.2022 30.03.2022 Herstellerseite www.nvidia.com ark.intel.com ark.intel.com TMUs 128 ROPs 64 Raytracing Cores 16 32 Cache L1: 3 MB, L2: 16 MB L1: 6 MB, L2: 16 MB Memory Bandwidth 224 GB/s 512 GB/s Transistors 21.7 Billion 21.7 Billion Die Size 406 mm² 406 mm² PCIe 4 16x 4 16x Displays 4 Displays (max.), HDMI 2.0b, DisplayPort 2.0 10G Ready 4 Displays (max.), HDMI 2.0b, DisplayPort 2.0 10G Ready
Benchmarks Performance Rating - 3DMark 11 + Fire Strike + Time Spy - GeForce GTX 1050 Ti Max-Q
3.2 pt (10%)
...
NVIDIA GeForce GTX 1050 Ti Max-Q
...
max:
Performance Rating - 3DMark 11 + Fire Strike + Time Spy - A770M
11.3 pt (34%)
...
...
max:
3DMark - 3DMark Time Spy Score
min: 2361 avg: 2453 median: 2485 (7%) max: 2513 Points
6320 Points (18%)
10997 Points (32%)
GPU TDP ? TDP 117 W 31% 100%
3DMark - 3DMark Time Spy Graphics
min: 2196 avg: 2245 median: 2261 (6%) max: 2278 Points
5830 Points (15%)
10783 Points (29%)
GPU TDP ? TDP 117 W 29% 100%
3DMark - 3DMark Ice Storm Unlimited Graphics
324705 Points (33%)
3DMark - 3DMark Ice Storm Extreme Graphics
39641 Points (5%)
384531 Points (45%)
GPU TDP ? TDP 117 W 10% 100%
3DMark - 3DMark Cloud Gate Score
min: 20755 avg: 24100 median: 24021 (23%) max: 28253 Points
53345 Points (50%)
GPU TDP ? TDP 117 W 45% 100%
3DMark - 3DMark Cloud Gate Graphics
min: 41871 avg: 46017 median: 46952 (12%) max: 50801 Points
124487 Points (31%)
GPU TDP ? TDP 117 W 37% 100%
3DMark - 3DMark Fire Strike Standard Score
min: 6175 avg: 6548 median: 6688 (11%) max: 6753 Points
12900 Points (22%)
min: 20560 avg: 22179 median: 22178.5 (37%) max: 23797 Points
GPU TDP ? TDP 117 W 33% 100%
3DMark - 3DMark Fire Strike Standard Graphics
min: 6957 avg: 7281 median: 7324 (8%) max: 7428 Points
14350 Points (16%)
min: 23000 avg: 25563 median: 25563 (29%) max: 28126 Points
GPU TDP ? TDP 117 W 32% 100%
3DMark - 3DMark Ice Storm Graphics
min: 41029 avg: 73224 median: 60442 (7%) max: 118202 Points
426092 Points (47%)
GPU TDP ? TDP 117 W 17% 100%
3DMark - 3DMark Night Raid
54701 Points (52%)
3DMark - 3DMark Night Raid Graphics Score
112098 Points (43%)
3DMark 11 - 3DM11 Performance Score
min: 8250 avg: 8936 median: 9106 (12%) max: 9414 Points
29170 Points (38%)
GPU TDP ? TDP 117 W 31% 100%
3DMark 11 - 3DM11 Performance GPU
min: 8317 avg: 8781 median: 8752 (8%) max: 9079 Points
37375 Points (32%)
GPU TDP ? TDP 117 W 23% 100%
3DMark Vantage + NVIDIA GeForce GTX 1050 Ti Max-Q 3DMark Vantage - 3DM Vant. Perf. total
min: 24827 avg: 29504 median: 29503.5 (9%) max: 34180 Points
3DM Vant. Perf. total + Intel Arc A770M
77403 Points (22%)
GPU TDP ? TDP 117 W 38% 100%
3DM Vant. Perf. GPU no PhysX + NVIDIA GeForce GTX 1050 Ti Max-Q 3DMark Vantage - 3DM Vant. Perf. GPU no PhysX
min: 25707 avg: 29448 median: 29448 (16%) max: 33189 Points
3DM Vant. Perf. GPU no PhysX + Intel Arc A770M
80346 Points (44%)
GPU TDP ? TDP 117 W 37% 100%
3DMark 05 - 3DMark 05 - Standard
55811 Points (61%)
3DMark 06 3DMark 06 - Standard 1280x1024 + NVIDIA GeForce GTX 1050 Ti Max-Q
min: 26796 avg: 28797 median: 28797 (38%) max: 30798 Points
3DMark 06 - Standard 1280x1024 + Intel Arc A770M
48471 Points (63%)
GPU TDP ? TDP 117 W 59% 100%
3DMark 06 - Standard 1024x768 + NVIDIA GeForce GTX 1050 Ti Max-Q
34786 Points (45%)
Unigine Valley 1.0 - Unigine Valley 1.0 DX
40.1 fps (12%)
75.2 fps (23%)
GPU TDP ? TDP 117 W 53% 100%
Unigine Heaven 2.1 - Heaven 2.1 high
86 fps (16%)
SPECviewperf 12 + Intel Arc A770M SPECviewperf 12 - specvp12 sw-03
61.1 fps (15%)
specvp12 snx-02 + Intel Arc A770M SPECviewperf 12 - specvp12 snx-02
1.3 fps (0%)
specvp12 showcase-01 + Intel Arc A770M SPECviewperf 12 - specvp12 showcase-01
104 fps (23%)
specvp12 mediacal-01 + Intel Arc A770M SPECviewperf 12 - specvp12 mediacal-01
40.4 fps (10%)
specvp12 maya-04 + Intel Arc A770M SPECviewperf 12 - specvp12 maya-04
136 fps (37%)
specvp12 energy-01 + Intel Arc A770M SPECviewperf 12 - specvp12 energy-01
2.1 fps (2%)
specvp12 creo-01 + Intel Arc A770M SPECviewperf 12 - specvp12 creo-01
37.7 fps (15%)
specvp12 catia-04 + Intel Arc A770M SPECviewperf 12 - specvp12 catia-04
144 fps (24%)
specvp12 3dsmax-05 + Intel Arc A770M SPECviewperf 12 - specvp12 3dsmax-05
150 fps (26%)
SPECviewperf 13 specvp13 sw-04 + Intel Arc A770M SPECviewperf 13 - specvp13 sw-04
66.2 fps (18%)
specvp13 snx-03 + Intel Arc A770M SPECviewperf 13 - specvp13 snx-03
2.4 fps (0%)
specvp13 showcase-02 + Intel Arc A770M SPECviewperf 13 - specvp13 showcase-02
105 fps (23%)
specvp13 medical-02 + Intel Arc A770M SPECviewperf 13 - specvp13 medical-02
70.4 fps (15%)
specvp13 maya-05 + Intel Arc A770M SPECviewperf 13 - specvp13 maya-05
281 fps (32%)
specvp13 energy-02 + Intel Arc A770M SPECviewperf 13 - specvp13 energy-02
19.2 fps (6%)
specvp13 creo-02 + Intel Arc A770M SPECviewperf 13 - specvp13 creo-02
77.6 fps (11%)
specvp13 catia-05 + Intel Arc A770M SPECviewperf 13 - specvp13 catia-05
211 fps (23%)
specvp13 3dsmax-06 + Intel Arc A770M SPECviewperf 13 - specvp13 3dsmax-06
149 fps (26%)
SPECviewperf 2020 specvp2020 solidworks-05 4k + Intel Arc A770M SPECviewperf 2020 - specvp2020 solidworks-05 4k
47.4 fps (14%)
specvp2020 snx-04 4k + Intel Arc A770M SPECviewperf 2020 - specvp2020 snx-04 4k
2.4 fps (0%)
specvp2020 medical-03 4k + Intel Arc A770M SPECviewperf 2020 - specvp2020 medical-03 4k
15.6 fps (15%)
specvp2020 maya-06 4k + Intel Arc A770M SPECviewperf 2020 - specvp2020 maya-06 4k
149 fps (24%)
specvp2020 energy-03 4k + Intel Arc A770M SPECviewperf 2020 - specvp2020 energy-03 4k
14.1 fps (2%)
specvp2020 creo-03 4k + Intel Arc A770M SPECviewperf 2020 - specvp2020 creo-03 4k
45.5 fps (22%)
specvp2020 catia-06 4k + Intel Arc A770M SPECviewperf 2020 - specvp2020 catia-06 4k
36 fps (24%)
specvp2020 3dsmax-07 4k + Intel Arc A770M SPECviewperf 2020 - specvp2020 3dsmax-07 4k
40.1 fps (17%)
Cinebench R10 Cinebench R10 Shading (32bit) + NVIDIA GeForce GTX 1050 Ti Max-Q Cinebench R10 - Cinebench R10 Shading (32bit)
min: 4597 avg: 5340 median: 4972 (4%) max: 6451 Points
Cinebench R10 Shading (32bit) + Intel Arc A770M
18594 Points (13%)
GPU TDP ? TDP 117 W 29% 100%
Cinebench R11.5 Cinebench R11.5 OpenGL 64 Bit + NVIDIA GeForce GTX 1050 Ti Max-Q Cinebench R11.5 - Cinebench R11.5 OpenGL 64 Bit
min: 66.9 avg: 71.7 median: 71.7 (24%) max: 76.5 fps
Cinebench R11.5 OpenGL 64 Bit + Intel Arc A770M
140 fps (46%)
GPU TDP ? TDP 117 W 51% 100%
Cinebench R15 + NVIDIA GeForce GTX 1050 Ti Max-Q Cinebench R15 - Cinebench R15 OpenGL 64 Bit
min: 92.1 avg: 105.4 median: 102 (6%) max: 120.7 fps
Cinebench R15 OpenGL 64 Bit + Intel Arc A770M
216.5 fps (13%)
GPU TDP ? TDP 117 W 49% 100%
Cinebench R15 OpenGL Ref. Match 64 Bit + NVIDIA GeForce GTX 1050 Ti Max-Q Cinebench R15 - Cinebench R15 OpenGL Ref. Match 64 Bit
99.6 % (100%)
Cinebench R15 OpenGL Ref. Match 64 Bit + Intel Arc A770M
97.8 % (98%)
GPU TDP ? TDP 117 W 100% 98%
GFXBench - GFXBench 5.0 Aztec Ruins High Tier Offscreen
49.5 fps (9%)
GFXBench - GFXBench 5.0 Aztec Ruins Normal Tier Offscreen
119.1 fps (9%)
GFXBench - GFXBench Car Chase Offscreen
min: 108.8 avg: 124.2 median: 124.2 (14%) max: 139.5 fps
GFXBench 3.1 - GFXBench Manhattan ES 3.1 Offscreen
min: 168 avg: 184.9 median: 184.9 (4%) max: 201.7 fps
GFXBench 3.0 - GFXBench 3.0 Manhattan Offscreen
min: 229.8 avg: 253.2 median: 253.2 (15%) max: 276.5 fps
GFXBench (DX / GLBenchmark) 2.7 + NVIDIA GeForce GTX 1050 Ti Max-Q GFXBench (DX / GLBenchmark) 2.7 - GFXBench T-Rex HD Offscreen C24Z16
min: 501 avg: 531 median: 531 (4%) max: 561 fps
LuxMark v2.0 64Bit - LuxMark v2.0 Room GPU
min: 1167 avg: 1201 median: 1200.5 (4%) max: 1234 Samples/s
3678 Samples/s (13%)
GPU TDP ? TDP 117 W 33% 100%
LuxMark v2.0 64Bit - LuxMark v2.0 Sala GPU
min: 2100 avg: 2222 median: 2221.5 (4%) max: 2343 Samples/s
10975 Samples/s (19%)
GPU TDP ? TDP 117 W 20% 100%
ComputeMark v2.1 - ComputeMark v2.1 Result
min: 4515 avg: 4879 median: 4879 (5%) max: 5243 Points
20027 Points (22%)
GPU TDP ? TDP 117 W 24% 100%
Power Consumption - Furmark Stress Test Power Consumption - external Monitor *
73.1 Watt (10%)
205 Watt (29%)
GPU TDP ? TDP 117 W 126% 100%
Power Consumption - The Witcher 3 Power Consumption - external Monitor *
75.8 Watt (11%)
187.2 Watt (26%)
GPU TDP ? TDP 117 W 121% 100%
Power Consumption - Witcher 3 Power Consumption *
min: 82 avg: 90 median: 85 (19%) max: 103 Watt
Power Consumption - Witcher 3 ultra Power Efficiency
min: 0.2379 avg: 0.3 median: 0.3 (26%) max: 0.3073 fps per Watt
Power Consumption - Witcher 3 ultra Power Efficiency - external Monitor
0.3 fps per Watt (27%)
0.3 fps per Watt (22%)
GPU TDP ? TDP 117 W 100% 82%
Emissions Witcher 3 Fan Noise + NVIDIA GeForce GTX 1050 Ti Max-Q Emissions - Witcher 3 Fan Noise
min: 36.4 avg: 40.2 median: 38.4 (61%) max: 47.6 dB(A)
Clock Speed - GPU Clock Witcher 3 ultra
1392 MHz (55%)
Average Benchmarks NVIDIA GeForce GTX 1050 Ti Max-Q → 100% n=4 Average Benchmarks Intel Arc A550M → 225% n=4 Average Benchmarks Intel Arc A770M → 400% n=4
- Bereich der Benchmarkergebnisse für diese Grafikkarte
- Durchschnittliche Benchmarkergebnisse für diese Grafikkarte
* Smaller numbers mean a higher performance
1 This benchmark is not used for the average calculation
Spiele-Benchmarks Die folgenden Benchmarks basieren auf unseren Spieletests mit Testnotebooks. Die Performance dieser Grafikkarte bei den gelisteten Spielen ist abhängig von der verwendeten CPU, Speicherausstattung, Treiber und auch Betriebssystem. Dadurch müssen die untenstehenden Werte nicht repräsentativ sein. Detaillierte Informationen über das verwendete System sehen Sie nach einem Klick auf den fps-Wert.
100%
GeForce GTX 1050 Ti Max-Q:
133.2 fps
100%
GeForce GTX 1050 Ti Max-Q:
56.7 fps
100%
GeForce GTX 1050 Ti Max-Q:
44.3 fps
100%
GeForce GTX 1050 Ti Max-Q:
27.2 fps
100%
GeForce GTX 1050 Ti Max-Q:
11.3 fps
100%
GeForce GTX 1050 Ti Max-Q:
67.1 fps
100%
GeForce GTX 1050 Ti Max-Q:
40.5 fps
100%
GeForce GTX 1050 Ti Max-Q:
34 fps
100%
GeForce GTX 1050 Ti Max-Q:
30.4 fps
100%
GeForce GTX 1050 Ti Max-Q:
9 fps
100%
GeForce GTX 1050 Ti Max-Q:
83 89 [X] MSI GF75 8RD-001 Intel Core i7-8750H 2.2GHz
GeForce GTX 1050 Ti Max-Q
min:
61 fps, max:
89 fps
~ 86 fps
100%
GeForce GTX 1050 Ti Max-Q:
47 50 [X] MSI GF75 8RD-001 Intel Core i7-8750H 2.2GHz
GeForce GTX 1050 Ti Max-Q
min:
40 fps, max:
60 fps
~ 49 fps
100%
GeForce GTX 1050 Ti Max-Q:
43 46 [X] MSI GF75 8RD-001 Intel Core i7-8750H 2.2GHz
GeForce GTX 1050 Ti Max-Q
min:
38 fps, max:
56 fps
~ 45 fps
100%
GeForce GTX 1050 Ti Max-Q:
40 43 [X] MSI GF75 8RD-001 Intel Core i7-8750H 2.2GHz
GeForce GTX 1050 Ti Max-Q
min:
33 fps, max:
53 fps
~ 42 fps
100%
GeForce GTX 1050 Ti Max-Q:
29 [X] MSI GF75 8RD-001 Intel Core i7-8750H 2.2GHz
GeForce GTX 1050 Ti Max-Q
min:
24 fps, max:
37 fps
fps
100%
GeForce GTX 1050 Ti Max-Q:
14 15 [X] MSI GF75 8RD-001 Intel Core i7-8750H 2.2GHz
GeForce GTX 1050 Ti Max-Q
min:
11 fps, max:
19 fps
~ 15 fps
100%
GeForce GTX 1050 Ti Max-Q:
55.5 60.4 [X] MSI GF75 8RD-001 Intel Core i7-8750H 2.2GHz
GeForce GTX 1050 Ti Max-Q
min:
31.8 fps, max:
115.6 fps
~ 58 fps
100%
GeForce GTX 1050 Ti Max-Q:
31.4 [X] MSI GF75 8RD-001 Intel Core i7-8750H 2.2GHz
GeForce GTX 1050 Ti Max-Q
min:
15.8 fps, max:
53.7 fps
49.8 ~ 41 fps
100%
GeForce GTX 1050 Ti Max-Q:
23.5 [X] MSI GF75 8RD-001 Intel Core i7-8750H 2.2GHz
GeForce GTX 1050 Ti Max-Q
min:
12.1 fps, max:
39.8 fps
36.5 ~ 30 fps
100%
GeForce GTX 1050 Ti Max-Q:
19.3 [X] MSI GF75 8RD-001 Intel Core i7-8750H 2.2GHz
GeForce GTX 1050 Ti Max-Q
min:
10.4 fps, max:
19.3 fps
28.3 ~ 24 fps
100%
GeForce GTX 1050 Ti Max-Q:
4.7 fps
100%
GeForce GTX 1050 Ti Max-Q:
73.2 fps
100%
GeForce GTX 1050 Ti Max-Q:
47.9 fps
100%
GeForce GTX 1050 Ti Max-Q:
36.1 fps
100%
GeForce GTX 1050 Ti Max-Q:
35.3 fps
100%
GeForce GTX 1050 Ti Max-Q:
12.9 fps
100%
GeForce GTX 1050 Ti Max-Q:
134.5 fps
100%
GeForce GTX 1050 Ti Max-Q:
87.4 fps
100%
GeForce GTX 1050 Ti Max-Q:
73.7 fps
100%
GeForce GTX 1050 Ti Max-Q:
65 fps
100%
GeForce GTX 1050 Ti Max-Q:
13.2 fps
100%
GeForce GTX 1050 Ti Max-Q:
100.1 fps
100%
GeForce GTX 1050 Ti Max-Q:
57.3 fps
100%
GeForce GTX 1050 Ti Max-Q:
47.9 fps
100%
GeForce GTX 1050 Ti Max-Q:
44.8 fps
100%
GeForce GTX 1050 Ti Max-Q:
17.3 fps
100%
GeForce GTX 1050 Ti Max-Q:
193.6 fps
100%
GeForce GTX 1050 Ti Max-Q:
128.7 fps
100%
GeForce GTX 1050 Ti Max-Q:
80.5 fps
100%
GeForce GTX 1050 Ti Max-Q:
61 fps
100%
GeForce GTX 1050 Ti Max-Q:
22 fps
100%
GeForce GTX 1050 Ti Max-Q:
64.8 fps
100%
GeForce GTX 1050 Ti Max-Q:
41 fps
100%
GeForce GTX 1050 Ti Max-Q:
37.5 fps
100%
GeForce GTX 1050 Ti Max-Q:
35.9 fps
100%
GeForce GTX 1050 Ti Max-Q:
11.3 fps
100%
GeForce GTX 1050 Ti Max-Q:
118.7 fps
100%
GeForce GTX 1050 Ti Max-Q:
46.3 fps
100%
GeForce GTX 1050 Ti Max-Q:
45 fps
100%
GeForce GTX 1050 Ti Max-Q:
37.5 fps
100%
GeForce GTX 1050 Ti Max-Q:
10.1 fps
100%
GeForce GTX 1050 Ti Max-Q:
67 fps
100%
GeForce GTX 1050 Ti Max-Q:
43 fps
100%
GeForce GTX 1050 Ti Max-Q:
34 fps
100%
GeForce GTX 1050 Ti Max-Q:
18 fps
100%
GeForce GTX 1050 Ti Max-Q:
7 fps
100%
GeForce GTX 1050 Ti Max-Q:
122 fps
100%
GeForce GTX 1050 Ti Max-Q:
67 fps
100%
GeForce GTX 1050 Ti Max-Q:
61 fps
100%
GeForce GTX 1050 Ti Max-Q:
47 fps
100%
GeForce GTX 1050 Ti Max-Q:
20 fps
100%
GeForce GTX 1050 Ti Max-Q:
97 fps
100%
GeForce GTX 1050 Ti Max-Q:
39 fps
100%
GeForce GTX 1050 Ti Max-Q:
35 fps
100%
GeForce GTX 1050 Ti Max-Q:
29 fps
100%
GeForce GTX 1050 Ti Max-Q:
11 fps
100%
GeForce GTX 1050 Ti Max-Q:
134 fps
100%
GeForce GTX 1050 Ti Max-Q:
80 fps
100%
GeForce GTX 1050 Ti Max-Q:
62 fps
100%
GeForce GTX 1050 Ti Max-Q:
38 fps
100%
GeForce GTX 1050 Ti Max-Q:
17 fps
100%
GeForce GTX 1050 Ti Max-Q:
100.3 fps
100%
GeForce GTX 1050 Ti Max-Q:
39.2 fps
100%
GeForce GTX 1050 Ti Max-Q:
34.9 fps
100%
GeForce GTX 1050 Ti Max-Q:
26.8 fps
100%
GeForce GTX 1050 Ti Max-Q:
8.3 fps
100%
GeForce GTX 1050 Ti Max-Q:
60 fps
100%
GeForce GTX 1050 Ti Max-Q:
49.1 fps
100%
GeForce GTX 1050 Ti Max-Q:
45.3 fps
100%
GeForce GTX 1050 Ti Max-Q:
42 fps
100%
GeForce GTX 1050 Ti Max-Q:
14 fps
100%
GeForce GTX 1050 Ti Max-Q:
76 91 91 ~ 86 fps
100%
GeForce GTX 1050 Ti Max-Q:
45 48 48 ~ 47 fps
100%
GeForce GTX 1050 Ti Max-Q:
41 44 44 ~ 43 fps
100%
GeForce GTX 1050 Ti Max-Q:
38 38 41 ~ 39 fps
100%
GeForce GTX 1050 Ti Max-Q:
13 13 14 ~ 13 fps
100%
GeForce GTX 1050 Ti Max-Q:
92.7 fps
100%
GeForce GTX 1050 Ti Max-Q:
80.3 fps
100%
GeForce GTX 1050 Ti Max-Q:
69.4 fps
100%
GeForce GTX 1050 Ti Max-Q:
39.5 fps
100%
GeForce GTX 1050 Ti Max-Q:
61.5 75.1 ~ 68 fps
100%
GeForce GTX 1050 Ti Max-Q:
36.6 37.7 ~ 37 fps
100%
GeForce GTX 1050 Ti Max-Q:
23.3 25 ~ 24 fps
100%
GeForce GTX 1050 Ti Max-Q:
9.2 fps
100%
GeForce GTX 1050 Ti Max-Q:
92.3 fps
100%
GeForce GTX 1050 Ti Max-Q:
42 fps
100%
GeForce GTX 1050 Ti Max-Q:
34.3 fps
100%
GeForce GTX 1050 Ti Max-Q:
30.4 fps
100%
GeForce GTX 1050 Ti Max-Q:
58 fps
100%
GeForce GTX 1050 Ti Max-Q:
41 fps
100%
GeForce GTX 1050 Ti Max-Q:
33 fps
100%
GeForce GTX 1050 Ti Max-Q:
27 fps
100%
GeForce GTX 1050 Ti Max-Q:
13 fps
100%
GeForce GTX 1050 Ti Max-Q:
119.5 fps
100%
GeForce GTX 1050 Ti Max-Q:
69.4 fps
100%
GeForce GTX 1050 Ti Max-Q:
64.3 fps
100%
GeForce GTX 1050 Ti Max-Q:
57.9 fps
100%
GeForce GTX 1050 Ti Max-Q:
18.9 fps
100%
GeForce GTX 1050 Ti Max-Q:
105 fps
100%
GeForce GTX 1050 Ti Max-Q:
55 fps
100%
GeForce GTX 1050 Ti Max-Q:
41 fps
100%
GeForce GTX 1050 Ti Max-Q:
31 fps
100%
GeForce GTX 1050 Ti Max-Q:
13 fps
100%
GeForce GTX 1050 Ti Max-Q:
129.8 fps
100%
GeForce GTX 1050 Ti Max-Q:
123.6 fps
100%
GeForce GTX 1050 Ti Max-Q:
115.7 fps
100%
GeForce GTX 1050 Ti Max-Q:
112.6 fps
100%
GeForce GTX 1050 Ti Max-Q:
65.2 fps
100%
GeForce GTX 1050 Ti Max-Q:
249.1 fps
100%
GeForce GTX 1050 Ti Max-Q:
169.1 fps
100%
GeForce GTX 1050 Ti Max-Q:
112.5 fps
100%
GeForce GTX 1050 Ti Max-Q:
42.3 fps
100%
GeForce GTX 1050 Ti Max-Q:
142.4 fps
100%
GeForce GTX 1050 Ti Max-Q:
85.6 fps
100%
GeForce GTX 1050 Ti Max-Q:
68.3 fps
100%
GeForce GTX 1050 Ti Max-Q:
58.9 fps
100%
GeForce GTX 1050 Ti Max-Q:
21.7 fps
100%
GeForce GTX 1050 Ti Max-Q:
68.6 96.7 ~ 83 fps
100%
GeForce GTX 1050 Ti Max-Q:
35.3 40 41.9 ~ 39 fps
100%
GeForce GTX 1050 Ti Max-Q:
13.9 14.5 ~ 14 fps
100%
GeForce GTX 1050 Ti Max-Q:
113.6 179.3 ~ 146 fps
100%
GeForce GTX 1050 Ti Max-Q:
63.8 68.2 ~ 66 fps
100%
GeForce GTX 1050 Ti Max-Q:
64.9 65.5 ~ 65 fps
100%
GeForce GTX 1050 Ti Max-Q:
49.5 50.4 ~ 50 fps
100%
GeForce GTX 1050 Ti Max-Q:
19.2 19.2 ~ 19 fps
100%
GeForce GTX 1050 Ti Max-Q:
137.3 fps
100%
GeForce GTX 1050 Ti Max-Q:
104.6 fps
100%
GeForce GTX 1050 Ti Max-Q:
89.5 154.8 ~ 122 fps
100%
GeForce GTX 1050 Ti Max-Q:
85.2 120 ~ 103 fps
100%
GeForce GTX 1050 Ti Max-Q:
51.7 58.1 ~ 55 fps
100%
GeForce GTX 1050 Ti Max-Q:
49.8 53.1 ~ 51 fps
100%
GeForce GTX 1050 Ti Max-Q:
20.7 21.1 ~ 21 fps
100%
GeForce GTX 1050 Ti Max-Q:
112.5 fps
100%
GeForce GTX 1050 Ti Max-Q:
85.8 fps
100%
GeForce GTX 1050 Ti Max-Q:
51 fps
100%
GeForce GTX 1050 Ti Max-Q:
43 fps
100%
GeForce GTX 1050 Ti Max-Q:
285.4 fps
100%
GeForce GTX 1050 Ti Max-Q:
233.9 fps
100%
GeForce GTX 1050 Ti Max-Q:
117.7 fps
100%
GeForce GTX 1050 Ti Max-Q:
70.5 fps
100%
GeForce GTX 1050 Ti Max-Q:
37 fps
100%
GeForce GTX 1050 Ti Max-Q:
63 fps
100%
GeForce GTX 1050 Ti Max-Q:
41.3 fps
100%
GeForce GTX 1050 Ti Max-Q:
35.8 fps
100%
GeForce GTX 1050 Ti Max-Q:
15.7 fps
100%
GeForce GTX 1050 Ti Max-Q:
114.2 137.2 ~ 126 fps
100%
GeForce GTX 1050 Ti Max-Q:
83.4 89.5 ~ 86 fps
100%
GeForce GTX 1050 Ti Max-Q:
41.9 42.5 ~ 42 fps
100%
GeForce GTX 1050 Ti Max-Q:
32.2 34.8 ~ 34 fps
100%
GeForce GTX 1050 Ti Max-Q:
14.6 15.7 ~ 15 fps
100%
GeForce GTX 1050 Ti Max-Q:
16.8 17.1 ~ 17 fps
100%
GeForce GTX 1050 Ti Max-Q:
236.6 263.6 ~ 250 fps
100%
GeForce GTX 1050 Ti Max-Q:
154.6 162.2 ~ 158 fps
100%
GeForce GTX 1050 Ti Max-Q:
90.2 92.7 ~ 91 fps
100%
GeForce GTX 1050 Ti Max-Q:
62.5 67.5 ~ 65 fps
100%
GeForce GTX 1050 Ti Max-Q:
27.7 29.3 ~ 29 fps
100%
GeForce GTX 1050 Ti Max-Q:
168.6 fps
100%
GeForce GTX 1050 Ti Max-Q:
143.9 fps
100%
GeForce GTX 1050 Ti Max-Q:
112.7 fps
100%
GeForce GTX 1050 Ti Max-Q:
101 fps
100%
GeForce GTX 1050 Ti Max-Q:
34.4 fps
100%
GeForce GTX 1050 Ti Max-Q:
111.9 fps
100%
GeForce GTX 1050 Ti Max-Q:
104.2 fps
100%
GeForce GTX 1050 Ti Max-Q:
98.1 fps
100%
GeForce GTX 1050 Ti Max-Q:
93.5 fps
100%
GeForce GTX 1050 Ti Max-Q:
46 fps
100%
GeForce GTX 1050 Ti Max-Q:
150.4 fps
100%
GeForce GTX 1050 Ti Max-Q:
143.3 fps
100%
GeForce GTX 1050 Ti Max-Q:
78.9 fps
100%
GeForce GTX 1050 Ti Max-Q:
34.5 fps
100%
GeForce GTX 1050 Ti Max-Q:
35.5 fps
100%
GeForce GTX 1050 Ti Max-Q:
228.2 fps
100%
GeForce GTX 1050 Ti Max-Q:
202.6 fps
100%
GeForce GTX 1050 Ti Max-Q:
202.1 fps
100%
GeForce GTX 1050 Ti Max-Q:
170.1 fps
100%
GeForce GTX 1050 Ti Max-Q:
433.4 fps
100%
GeForce GTX 1050 Ti Max-Q:
200.4 fps
100%
GeForce GTX 1050 Ti Max-Q:
186.7 fps
100%
GeForce GTX 1050 Ti Max-Q:
126.7 fps
Average Gaming NVIDIA GeForce GTX 1050 Ti Max-Q → 100% Average Gaming 30-70 fps → 100%
Average Gaming Intel Arc A770M → 214% Average Gaming 30-70 fps → 248%
 Deutsch
 English
 Español
 Français
 Italiano
 Nederlands
 Polski
 Português
 Русский
 Türkçe
 Svenska
 Chinese
 Magyar