Notebookcheck Logo

NVIDIA GeForce GTX 1050 Ti Max-Q vs Intel Arc A350M vs Intel Arc A310

NVIDIA GeForce GTX 1050 Ti Max-Q

► remove from comparison NVIDIA GeForce GTX 1050 Ti Max-Q

Die Nvidia GeForce GTX 1050 Ti mit Max-Q Design ist eine Mittelklasse-GPU basierend auf der Pascal-Architektur und wurde im Januar 2018 vorgestellt. Anders als die schnelleren Modelle basiert die GTX 1050 Ti auf dem GP107-Chip, der im 14-nm-Verfahren bei Samsung hergestellt wird.

Im Vergleich zur normalen GTX 1050 Ti gibt es noch weitere Unterschiede als den Takt. Der Treiber wurde auf Effizienz (und nicht Leistung) optimiert (nur für die Max-Q Modelle), optimierte Spannungswandler für 1V Betreib, high-end Kühlungsmethoden und eine 40 dB Grenze für die Lüfterlautstärke (mit Taktanpasssungen um dies jederzeit zu gewährleisten) zeichnen die Max-Q Variante aus.

Features

Der GP107-Chip wird in einem 14-nm-FinFET-Prozess bei Samsung gefertigt und bietet eine Reihe neuer Features, unter anderem Support für DisplayPort 1.4 (ready), HDMI 2.0b, HDR, Simultaneous Multi-Projection (SMP) sowie verbessertes H.265 Video De- und Encoding (PlayReady 3.0). Eine genaue Auflistung der Verbesserungen und Features der neuen Pascal Desktop-GPUs finden Sie in unserem Pascal-Architektur-Artikel.

Performance

Die exakte Performance der GeForce GTX 1050 Ti Max-Q kann sich in Abhängigkeit von der Kühlung des jeweiligen Notebooks stark unterscheiden. Im Optimalfall ist die Leistung etwa 10 bis 15 % unterhalb der normalen GTX 1050 Ti angesiedelt. Dadurch eignet sich die Grafikkarte am besten für Full HD (1920 x 1080) bei hoher aber nicht maximaler Detailstufe.

Leistungsaufnahme

Die Leistungsaufnahme der GeForce GTX 1050 Ti Max-Q ist von Nvidia mit 40 - 46 Watt spezifiziert und damit deutlich unterhalb der normalen Notebook GTX 1050 Ti (64 Watt). Selbst die normale GTX 1050 ist mit 53 Watt höher spezifziert. Damit eignet sich die Grafikkarte auch für dünne und leichte 14-Zoll Notebooks.

Intel Arc A350M

► remove from comparison Intel A350M

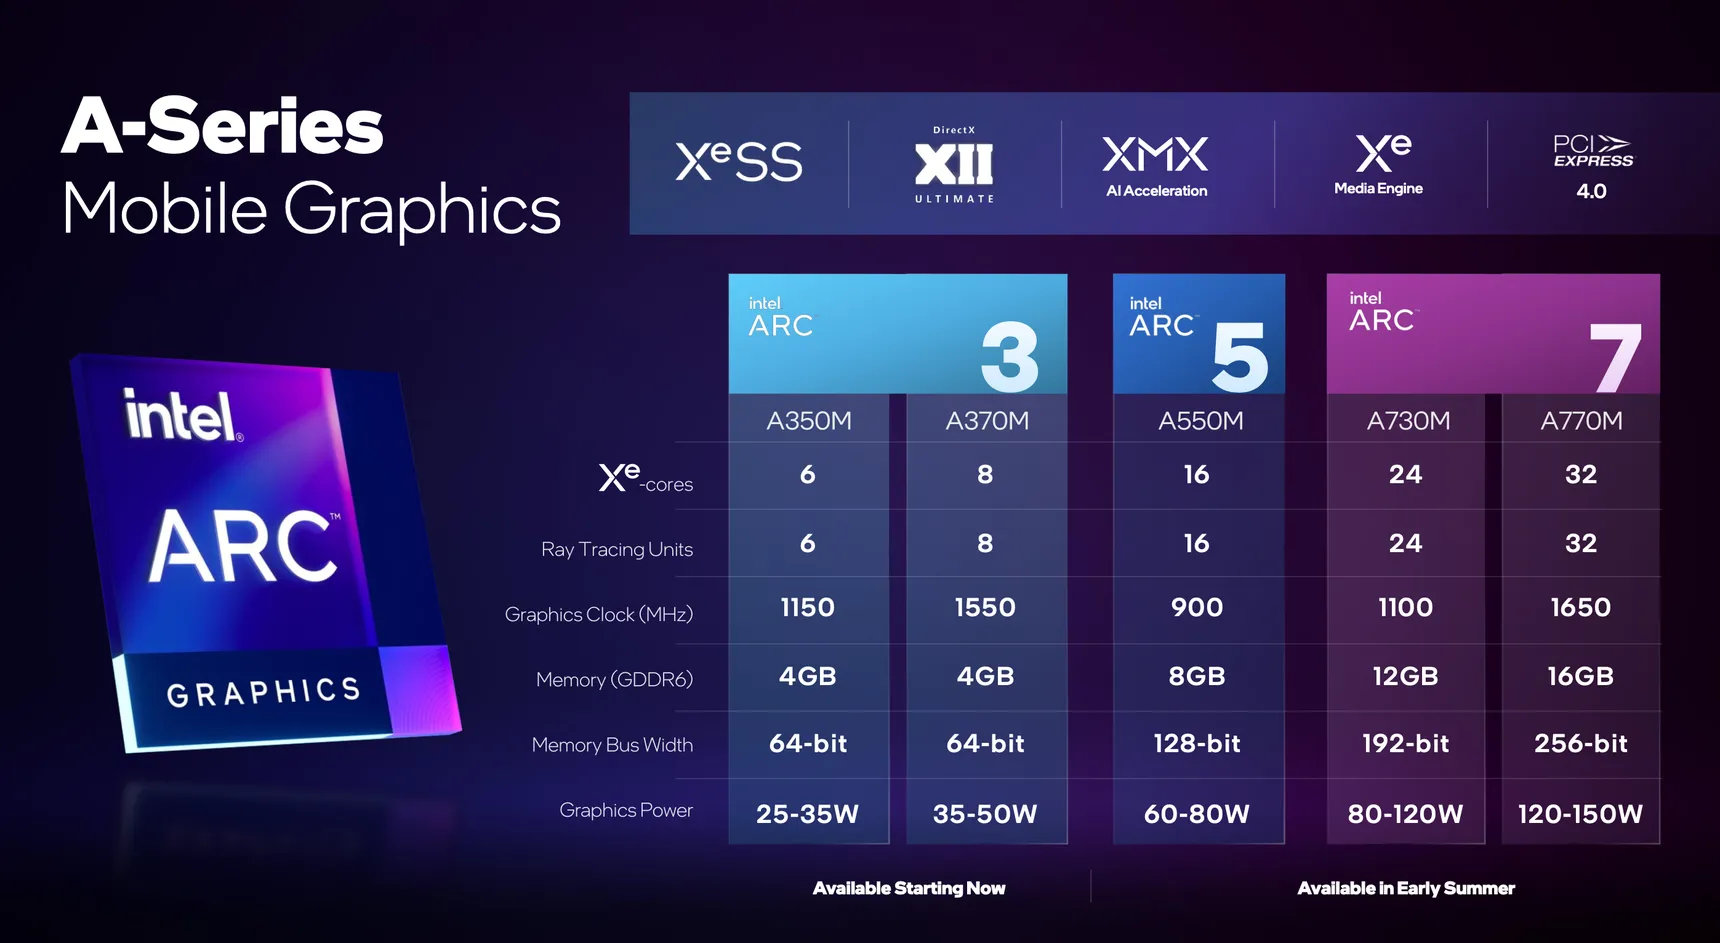
Die Intel Arc A350M ist eine dedizierte Einstiegs-Grafikkarte von Intel für Notebooks. Sie basiert auf den ACM-G11 Chip und bietet 6 der 8 Xe-Kerne (96 ALUs), 6 der 8 Ray-Tracing-Units, 1,152 MB L1-Cache und 4MB L2-Cache. Das Speicherinterface ist 64 Bit breit und unterstützt 4GB GDDR6 Grafikspeicher mit 14 Gbps. Der TGP ist zwischen 25 und 35 Watt je nach Modell.

Die Performance sollte etwas oberhalb der älteren Intel Xe Max liegen (ebenfalls 96 ALUs) und dadurch in der Einstiegsklasse von dedizierten GPUs.

Der ACM-G11 Chip wird bei TSMC in 6nm gefertigt (N6 Prozess) und bietet 7,2 Mrd. Transistoren und ist 157 mm2 groß. Er integriert zwei Media Engines für VP9, AVC, HEVC, AV1 8k60 12-Bit HDR Dekodierung und 8k 10-Bit HDR Enkodierung. Die integrierten 4 Display Pipes unterstützen 4x 4k120 HDR, HDMI 2.0B, DP 2.0 10G und Adaptive Sync. 

Mittels Deep Link kann mit einer CPU der 12. Generation (Alder Lake) Dynamic Power Share genutzt werden.

Intel Arc A310

► remove from comparison Intel A310

Die Intel Arc A310 ist eine dedizierte Einstiegs-Grafikkarte von Intel für Desktops. Sie basiert auf den ACM-G11 Chip und bietet 6 der 8 Xe-Kerne (96 ALUs), 6 der 8 Ray-Tracing-Units, 1,152 MB L1-Cache und 4MB L2-Cache. Das Speicherinterface ist 64 Bit breit und unterstützt 4GB GDDR6 Grafikspeicher mit 15,5 Gbps. Der TGP ist zwischen 40 und 75 Watt je nach Modell.

Der A310 ist ähnlich zur mobilen Arc A350M, bis auf die höheren Taktraten der Kerne und des Speichers.

Der ACM-G11 Chip wird bei TSMC in 6nm gefertigt (N6 Prozess) und bietet 7,2 Mrd. Transistoren und ist 157 mm2 groß. Er integriert zwei Media Engines für VP9, AVC, HEVC, AV1 8k60 12-Bit HDR Dekodierung und 8k 10-Bit HDR Enkodierung. Die integrierten 4 Display Pipes unterstützen 4x 4k120 HDR, HDMI 2.0B, DP 2.0 10G und Adaptive Sync. 

NVIDIA GeForce GTX 1050 Ti Max-QIntel Arc A350MIntel Arc A310
Arc Serie
GeForce GTX 1080 Ti 3584 @ 1.48 - 1.6 GHz352 Bit @ 11000 MHz
GeForce GTX 1080 SLI (Laptop) 5120 @ 1.56 - 1.73 GHz256 Bit @ 10000 MHz
GeForce GTX 1070 SLI (Desktop) 3840 @ 1.51 - 1.68 GHz256 Bit @ 8000 MHz
GeForce GTX 1070 SLI (Laptop) 4096 @ 1.44 - 1.65 GHz256 Bit @ 8000 MHz
GeForce GTX 1080 (Desktop) 2560 @ 1.61 - 1.73 GHz256 Bit @ 10000 MHz
GeForce GTX 1080 Mobile 2560 @ 1.57 - 1.73 GHz256 Bit @ 10000 MHz
GeForce GTX 1070 Ti (Desktop) 2432 @ 1.61 - 1.68 GHz256 Bit @ 8000 MHz
GeForce GTX 1070 (Desktop) 1920 @ 1.51 - 1.68 GHz256 Bit @ 8000 MHz
GeForce GTX 1080 Max-Q 2560 @ 1.1 - 1.28 GHz256 Bit @ 10000 MHz
GeForce GTX 1070 Mobile 2048 @ 1.44 - 1.65 GHz256 Bit @ 8000 MHz
GeForce GTX 1070 Max-Q 2048 @ 1.1 - 1.27 GHz256 Bit @ 8000 MHz
GeForce GTX 1060 (Desktop) 1280 @ 1.51 - 1.71 GHz192 Bit @ 8000 MHz
GeForce GTX 1060 Mobile 1280 @ 1.4 - 1.67 GHz192 Bit @ 8000 MHz
GeForce GTX 1060 Max-Q 1280 @ 1.06 - 1.34 GHz192 Bit @ 8000 MHz
GeForce GTX 1050 Ti Mobile 768 @ 1.49 - 1.62 GHz128 Bit @ 7000 MHz
GeForce GTX 1050 Ti (Desktop) 768 @ 1.29 - 1.39 GHz128 Bit @ 7008 MHz
GeForce GTX 1050 Ti Max-Q 768 @ 1.15 - 1.29 GHz128 Bit @ 7000 MHz
GeForce GTX 1050 (Desktop) 640 @ 1.35 - 1.46 GHz128 Bit @ 7008 MHz
GeForce GTX 1050 Mobile 640 @ 1.35 - 1.49 GHz128 Bit @ 7000 MHz
GeForce GTX 1050 Max-Q 640 @ 1 - 1.14 GHz128 Bit @ 7000 MHz
GeForce GT 1030 (Desktop) 384 @ 1.23 - 1.67 GHz64 Bit @ 6000 MHz
Arc A770 4096 @ 2.1 - 2.4 GHz256 Bit @ 16000 MHz
Arc A750 3584 @ 2.05 - 2.4 GHz256 Bit @ 16000 MHz
Arc A580 3072 @ 1.7 - 2 GHz256 Bit @ 16000 MHz
A770M 4096 @ 1.65 GHz256 Bit @ 16000 MHz
A730M 3072 @ 1.1 GHz192 Bit @ 14000 MHz
A570M 16 @ 0.9 - 1.3 GHz128 Bit @ 14000 MHz
A550M 16 @ 0.9 - 2.01 GHz128 Bit @ 14000 MHz
A530M 12 @ 0.9 - 1.3 GHz128 Bit @ 14000 MHz
A370M 8 @ 1.55 GHz64 Bit @ 14000 MHz
Arc A380 1024 @ 2 GHz96 Bit @ 15500 MHz
A310 6 @ 2 GHz64 Bit @ 15500 MHz
A350M 6 @ 1.15 GHz64 Bit @ 14000 MHz
CodenameN17P-G1 Max-QAlchemistAlchemist
ArchitekturPascalXe HPGXe HPG
Pipelines768 - unified6 - unified6 - unified
Kerntakt1151 – 1290 - 1290 – 1417 (Boost) MHz1150 MHz2000 (Boost) MHz
Speichertakt7000 MHz14000 MHz15500 MHz
Speicherbandbreite128 Bit64 Bit64 Bit
SpeichertypGDDR5GDDR6GDDR6
Max. Speichergröße4 GB4 GB4 GB
Shared Memoryneinneinnein
APIDirectX 12_1, OpenGL 4.5DirectX 12_2, OpenGL 4.6, Vulkan 1.3DirectX 12_2, OpenGL 4.6, Vulkan 1.3
Stromverbrauch40 - 46 Watt35 Watt (25 - 35 Watt TGP)75 Watt (40 - 75 Watt TGP)
Herstellungsprozess16 nm6 nm6 nm
FeaturesMulti-Projection, VR Ready, G-SYNC, Vulkan, Multi Monitor
Notebookgrößemittel (15.4" z.B.)
Erscheinungsdatum03.01.2018 30.03.2022 01.09.2022
Herstellerseitewww.nvidia.comark.intel.comwww.intel.com
Raytracing Cores66
CacheL1: 1.1 MB, L2: 4 MBL1: 1.1 MB, L2: 4 MB
Memory Bandwidth112 GB/s124 GB/s
Transistors7.2 Billion7.2 Billion
Die Size 157 mm² 157 mm²
PCIe4 8x4 8x
Displays4 Displays (max.), HDMI 2.0b, DisplayPort 2.0 10G Ready4 Displays (max.), HDMI 2.0b, DisplayPort 2.0 10G Ready

Benchmarks

Performance Rating - 3DMark 11 + Fire Strike + Time Spy - GeForce GTX 1050 Ti Max-Q
3.2 pt (10%)
Performance Rating - 3DMark 11 + Fire Strike + Time Spy - A310
3.8 pt (11%)
3DMark - 3DMark Time Spy Score
min: 2361     avg: 2453     median: 2485 (7%)     max: 2513 Points
min: 2976     avg: 3289     median: 3397 (10%)     max: 3494 Points
151%
A310 +
3743 Points (11%)
3DMark - 3DMark Time Spy Graphics
min: 2196     avg: 2245     median: 2261 (6%)     max: 2278 Points
min: 2731     avg: 2993     median: 3050 (8%)     max: 3197 Points
145%
A310 +
3269 Points (9%)
3DMark - 3DMark Ice Storm Unlimited Graphics
324705 Points (33%)
3DMark - 3DMark Ice Storm Extreme Graphics
39641 Points (5%)
3DMark - 3DMark Cloud Gate Score
min: 20755     avg: 24100     median: 24021 (26%)     max: 28253 Points
min: 23965     avg: 25147     median: 25146.5 (27%)     max: 26328 Points
187%
A310 +
44891 Points (48%)
3DMark - 3DMark Cloud Gate Graphics
min: 41871     avg: 46017     median: 46952 (12%)     max: 50801 Points
min: 28623     avg: 36315     median: 36314.5 (10%)     max: 44006 Points
113%
A310 +
53244 Points (14%)
3DMark - 3DMark Fire Strike Standard Score
min: 6175     avg: 6548     median: 6688 (12%)     max: 6753 Points
min: 5961     avg: 6267     median: 6009 (11%)     max: 6832 Points
122%
A310 +
8192 Points (14%)
3DMark - 3DMark Fire Strike Standard Graphics
min: 6957     avg: 7281     median: 7324 (8%)     max: 7428 Points
min: 6800     avg: 7088     median: 7147 (8%)     max: 7318 Points
116%
A310 +
8464 Points (10%)
3DMark - 3DMark Ice Storm Graphics
min: 41029     avg: 73224     median: 60442 (7%)     max: 118202 Points
425%
1 A310 +
257130 Points (30%)
3DMark - 3DMark Wild Life Unlimited
100%
1 A350M +
19449 Points (10%)
3DMark - 3DMark Wild Life Extreme Unlimited
100%
1 A350M +
min: 5189     avg: 5300     median: 5299.5 (6%)     max: 5410 Points
3DMark 11 - 3DM11 Performance Score
min: 8250     avg: 8936     median: 9106 (13%)     max: 9414 Points
min: 10123     avg: 10766     median: 10766 (15%)     max: 11409 Points
143%
A310 +
13031 Points (18%)
3DMark 11 - 3DM11 Performance GPU
min: 8317     avg: 8781     median: 8752 (8%)     max: 9079 Points
min: 10687     avg: 10730     median: 10730 (9%)     max: 10773 Points
136%
A310 +
11915 Points (10%)
3DMark Vantage
3DM Vant. Perf. total + NVIDIA GeForce GTX 1050 Ti Max-Q
3DMark Vantage - 3DM Vant. Perf. total
min: 24827     avg: 29504     median: 29503.5 (9%)     max: 34180 Points
3DM Vant. Perf. total + Intel Arc A350M
31023 Points (9%)
3DM Vant. Perf. total + Intel Arc A310
159%
A310 +
46839 Points (14%)
3DM Vant. Perf. GPU no PhysX + NVIDIA GeForce GTX 1050 Ti Max-Q
3DMark Vantage - 3DM Vant. Perf. GPU no PhysX
min: 25707     avg: 29448     median: 29448 (16%)     max: 33189 Points
3DM Vant. Perf. GPU no PhysX + Intel Arc A350M
28186 Points (15%)
3DM Vant. Perf. GPU no PhysX + Intel Arc A310
133%
A310 +
39213 Points (21%)
3DMark 06 3DMark 06 - Standard 1280x1024 + NVIDIA GeForce GTX 1050 Ti Max-Q
3DMark 06
min: 26796     avg: 28797     median: 28797 (38%)     max: 30798 Points
3DMark 06 - Standard 1280x1024 + Intel Arc A350M
31625 Points (41%)
3DMark 06 - Standard 1280x1024 + Intel Arc A310
187%
A310 +
53771 Points (70%)
3DMark 06 - Standard 1024x768 + NVIDIA GeForce GTX 1050 Ti Max-Q
3DMark 06
34786 Points (45%)
Unigine Valley 1.0 - Unigine Valley 1.0 DX
40.1 fps (12%)
49%
1 A350M +
19.5 fps (6%)
Unigine Heaven 2.1 - Heaven 2.1 high
86 fps (16%)
SPECviewperf 13 specvp13 sw-04 + Intel Arc A350M
SPECviewperf 13 - specvp13 sw-04
100%
1 A350M +
57.6 fps (15%)
specvp13 snx-03 + Intel Arc A350M
SPECviewperf 13 - specvp13 snx-03
100%
1 A350M +
3.2 fps (0%)
specvp13 showcase-02 + Intel Arc A350M
SPECviewperf 13 - specvp13 showcase-02
100%
1 A350M +
27.7 fps (6%)
specvp13 medical-02 + Intel Arc A350M
SPECviewperf 13 - specvp13 medical-02
100%
1 A350M +
19.9 fps (4%)
specvp13 maya-05 + Intel Arc A350M
SPECviewperf 13 - specvp13 maya-05
100%
1 A350M +
63.6 fps (7%)
specvp13 energy-02 + Intel Arc A350M
SPECviewperf 13 - specvp13 energy-02
100%
1 A350M +
11.8 fps (4%)
specvp13 creo-02 + Intel Arc A350M
SPECviewperf 13 - specvp13 creo-02
100%
1 A350M +
49.1 fps (7%)
specvp13 catia-05 + Intel Arc A350M
SPECviewperf 13 - specvp13 catia-05
100%
1 A350M +
77 fps (9%)
specvp13 3dsmax-06 + Intel Arc A350M
SPECviewperf 13 - specvp13 3dsmax-06
100%
1 A350M +
55.7 fps (10%)
SPECviewperf 2020 specvp2020 solidworks-05 1080p + Intel Arc A350M
SPECviewperf 2020 - specvp2020 solidworks-05 1080p
100%
1 A350M +
17.2 fps (3%)
specvp2020 snx-04 1080p + Intel Arc A350M
SPECviewperf 2020 - specvp2020 snx-04 1080p
100%
1 A350M +
3.2 fps (1%)
specvp2020 medical-03 1080p + Intel Arc A350M
SPECviewperf 2020 - specvp2020 medical-03 1080p
100%
1 A350M +
9.1 fps (6%)
specvp2020 maya-06 1080p + Intel Arc A350M
SPECviewperf 2020 - specvp2020 maya-06 1080p
100%
1 A350M +
72 fps (8%)
specvp2020 energy-03 1080p + Intel Arc A350M
SPECviewperf 2020 - specvp2020 energy-03 1080p
100%
1 A350M +
12 fps (8%)
specvp2020 creo-03 1080p + Intel Arc A350M
SPECviewperf 2020 - specvp2020 creo-03 1080p
100%
1 A350M +
30.8 fps (15%)
specvp2020 catia-06 1080p + Intel Arc A350M
SPECviewperf 2020 - specvp2020 catia-06 1080p
100%
1 A350M +
17.4 fps (11%)
specvp2020 3dsmax-07 1080p + Intel Arc A350M
SPECviewperf 2020 - specvp2020 3dsmax-07 1080p
100%
1 A350M +
20.9 fps (7%)
Cinebench R10 Cinebench R10 Shading (32bit) + NVIDIA GeForce GTX 1050 Ti Max-Q
Cinebench R10 - Cinebench R10 Shading (32bit)
min: 4597     avg: 5340     median: 4972 (4%)     max: 6451 Points
Cinebench R11.5 Cinebench R11.5 OpenGL 64 Bit + NVIDIA GeForce GTX 1050 Ti Max-Q
Cinebench R11.5 - Cinebench R11.5 OpenGL 64 Bit
min: 66.9     avg: 71.7     median: 71.7 (24%)     max: 76.5 fps
Cinebench R15
Cinebench R15 OpenGL 64 Bit + NVIDIA GeForce GTX 1050 Ti Max-Q
Cinebench R15 - Cinebench R15 OpenGL 64 Bit
min: 92.1     avg: 105.4     median: 102 (6%)     max: 120.7 fps
Cinebench R15 OpenGL 64 Bit + Intel Arc A350M
146%
1 A350M +
min: 138.13     avg: 149.3     median: 149.3 (9%)     max: 160.4 fps
Cinebench R15 OpenGL Ref. Match 64 Bit + NVIDIA GeForce GTX 1050 Ti Max-Q
Cinebench R15 - Cinebench R15 OpenGL Ref. Match 64 Bit
99.6 % (100%)
Cinebench R15 OpenGL Ref. Match 64 Bit + Intel Arc A350M
98%
1 A350M +
97.8 % (98%)
GFXBench - GFXBench 5.0 4K Aztec Ruins High Tier Offscreen
100%
1 A350M +
29.6 fps (12%)
121%
1 A310 +
35.9 fps (15%)
GFXBench - GFXBench 5.0 Aztec Ruins High Tier Offscreen
49.5 fps (9%)
62.8 fps (11%)
163%
A310 +
80.5 fps (15%)
GFXBench - GFXBench 5.0 Aztec Ruins Normal Tier Offscreen
119.1 fps (9%)
160 fps (12%)
168%
A310 +
199.7 fps (15%)
GFXBench - GFXBench Car Chase Offscreen
min: 108.8     avg: 124.2     median: 124.2 (14%)     max: 139.5 fps
101%
1 A350M +
125 fps (14%)
GFXBench 3.1 - GFXBench Manhattan ES 3.1 Offscreen
min: 168     avg: 184.9     median: 184.9 (4%)     max: 201.7 fps
105%
1 A350M +
194 fps (4%)
GFXBench 3.0 - GFXBench 3.0 Manhattan Offscreen
min: 229.8     avg: 253.2     median: 253.2 (15%)     max: 276.5 fps
122%
1 A350M +
309 fps (18%)
GFXBench (DX / GLBenchmark) 2.7
GFXBench T-Rex HD Offscreen C24Z16 + NVIDIA GeForce GTX 1050 Ti Max-Q
GFXBench (DX / GLBenchmark) 2.7 - GFXBench T-Rex HD Offscreen C24Z16
min: 501     avg: 531     median: 531 (4%)     max: 561 fps
GFXBench T-Rex HD Offscreen C24Z16 + Intel Arc A350M
121%
1 A350M +
640 fps (5%)
LuxMark v2.0 64Bit - LuxMark v2.0 Room GPU
min: 1167     avg: 1201     median: 1200.5 (5%)     max: 1234 Samples/s
1062 Samples/s (5%)
854 Samples/s (4%)
LuxMark v2.0 64Bit - LuxMark v2.0 Sala GPU
min: 2100     avg: 2222     median: 2221.5 (4%)     max: 2343 Samples/s
2796 Samples/s (5%)
125%
A310 +
2784 Samples/s (5%)
ComputeMark v2.1 - ComputeMark v2.1 Result
min: 4515     avg: 4879     median: 4879 (5%)     max: 5243 Points
4447 Points (5%)
108%
A310 +
5254 Points (6%)
Power Consumption - Furmark Stress Test Power Consumption - external Monitor *
73.1 Watt (10%)
105%
1 A350M +
min: 60.5     avg: 69.4     median: 69.4 (10%)     max: 78.3 Watt
Power Consumption - The Witcher 3 Power Consumption - external Monitor *
75.8 Watt (11%)
116%
1 A350M +
min: 53.2     avg: 65.1     median: 65.1 (9%)     max: 77 Watt
Power Consumption - Witcher 3 Power Consumption *
min: 82     avg: 90     median: 85 (19%)     max: 103 Watt
119%
1 A350M +
min: 56.7     avg: 71.2     median: 71.2 (16%)     max: 85.6 Watt
Power Consumption - Witcher 3 ultra Power Efficiency
min: 0.2379     avg: 0.3     median: 0.3 (26%)     max: 0.3073 fps per Watt
96%
1 A350M +
min: 0.2395     avg: 0.3     median: 0.3 (25%)     max: 0.3245 fps per Watt
Power Consumption - Witcher 3 ultra Power Efficiency - external Monitor
0.3 fps per Watt (27%)
105%
1 A350M +
0.3 fps per Watt (29%)
Emissions Witcher 3 Fan Noise + NVIDIA GeForce GTX 1050 Ti Max-Q
Emissions - Witcher 3 Fan Noise
min: 36.4     avg: 40.2     median: 38.4 (61%)     max: 47.6 dB(A)
Witcher 3 Fan Noise + Intel Arc A350M
124%
1 A350M +
47.5 dB(A) (76%)
Clock Speed - GPU Clock Witcher 3 ultra
1392 MHz (55%)

Average Benchmarks NVIDIA GeForce GTX 1050 Ti Max-Q → 100% n=16

Average Benchmarks Intel Arc A350M → 110% n=16

Average Benchmarks Intel Arc A310 → 139% n=16

- Bereich der Benchmarkergebnisse für diese Grafikkarte
- Durchschnittliche Benchmarkergebnisse für diese Grafikkarte
* Smaller numbers mean a higher performance
1 This benchmark is not used for the average calculation

Spiele-Benchmarks

Die folgenden Benchmarks basieren auf unseren Spieletests mit Testnotebooks. Die Performance dieser Grafikkarte bei den gelisteten Spielen ist abhängig von der verwendeten CPU, Speicherausstattung, Treiber und auch Betriebssystem. Dadurch müssen die untenstehenden Werte nicht repräsentativ sein. Detaillierte Informationen über das verwendete System sehen Sie nach einem Klick auf den fps-Wert.

low 1920x1080
A310:
62.5  fps
med. 1920x1080
A310:
53.4  fps
high 1920x1080
A310:
39.6  fps
ultra 1920x1080
A310:
30.9  fps
low 1920x1080
A310:
0 (!)  fps
med. 1920x1080
A310:
0 (!)  fps
high 1920x1080
A310:
0 (!)  fps
ultra 1920x1080
A310:
0 (!)  fps
low 1920x1080
A310:
22.4  fps
med. 1920x1080
A310:
19.5  fps
high 1920x1080
A310:
16.7  fps
ultra 1920x1080
A310:
16.3  fps
low 1920x1080
A310:
20.4  fps
med. 1920x1080
A310:
18  fps
high 1920x1080
A310:
13.8  fps
ultra 1920x1080
A310:
9.9  fps
Palworld

Palworld

2024
low 1920x1080
A310:
38.3  fps
med. 1920x1080
A310:
33.2  fps
high 1920x1080
A310:
23.2  fps
ultra 1920x1080
A310:
20.9  fps
med. 1920x1080
A310:
260  fps
high 1920x1080
A310:
154.7  fps
ultra 1920x1080
A310:
141.6  fps
low 1920x1080
A310:
102.2  fps
med. 1920x1080
A310:
75.6  fps
high 1920x1080
A310:
58.3  fps
ultra 1920x1080
A310:
34.6  fps
low 1920x1080
A310:
75  fps
med. 1920x1080
A310:
53.1  fps
high 1920x1080
A310:
46.6  fps
ultra 1920x1080
A310:
34.6  fps
low 1920x1080
A310:
16  fps
med. 1920x1080
A310:
14  fps
high 1920x1080
A310:
11  fps
ultra 1920x1080
A310:
8.1  fps
low 1920x1080
A310:
34.3  fps
med. 1920x1080
A310:
27.3  fps
high 1920x1080
A310:
18.6  fps
ultra 1920x1080
A310:
16.8  fps
low 1920x1080
A310:
16.3  fps
med. 1920x1080
A310:
13.9  fps
high 1920x1080
A310:
12.3  fps
low 1920x1080
A310:
22.7  fps
med. 1920x1080
A310:
22.2  fps
high 1920x1080
A310:
18.4  fps
ultra 1920x1080
A310:
14  fps
low 1920x1080
A310:
111  fps
med. 1920x1080
A310:
73.6  fps
high 1920x1080
A310:
41.6  fps
ultra 1920x1080
A310:
32.3  fps
low 1920x1080
A310:
37  fps
med. 1920x1080
A310:
32  fps
high 1920x1080
A310:
25  fps
ultra 1920x1080
A310:
20  fps
low 1920x1080
A310:
153.5  fps
med. 1920x1080
A310:
106.3  fps
high 1920x1080
A310:
37.5  fps
ultra 1920x1080
A310:
27.7  fps
low 1920x1080
A310:
41  fps
med. 1920x1080
A310:
31.1  fps
high 1920x1080
A310:
25.7  fps
ultra 1920x1080
A310:
23.7  fps
Lies of P

Lies of P

2023
low 1920x1080
A310:
49.3  fps
med. 1920x1080
A310:
42  fps
high 1920x1080
A310:
36  fps
ultra 1920x1080
A310:
30.3  fps
low 1920x1080
A310:
37  fps
med. 1920x1080
A310:
33  fps
high 1920x1080
A310:
27  fps
ultra 1920x1080
A310:
22  fps
Starfield

Starfield

2023
low 1920x1080
A310:
17.3  fps
med. 1920x1080
A310:
14.2  fps
high 1920x1080
A310:
13  fps
ultra 1920x1080
A310:
10.3  fps
low 1920x1080
A310:
56.3  fps
med. 1920x1080
A310:
43.8  fps
high 1920x1080
A310:
39  fps
ultra 1920x1080
A310:
26.9  fps
low 1920x1080
A310:
32.6  fps
med. 1920x1080
A310:
31.8  fps
high 1920x1080
A310:
26.7  fps
ultra 1920x1080
A310:
8.1  fps
low 1920x1080
A310:
40.6  fps
med. 1920x1080
A310:
32  fps
high 1920x1080
A310:
25.5  fps
ultra 1920x1080
A310:
24.9  fps
low 1920x1080
A310:
30.3  fps
med. 1920x1080
A310:
24.6  fps
high 1920x1080
A310:
19.1  fps
ultra 1920x1080
A310:
16.1  fps
F1 23

F1 23

2023
low 1920x1080
A310:
88  fps
med. 1920x1080
A310:
75  fps
high 1920x1080
A310:
42  fps
ultra 1920x1080
A310:
12  fps
low 1920x1080
A310:
42.4  fps
med. 1920x1080
A310:
30.1  fps
high 1920x1080
A310:
21.6  fps
ultra 1920x1080
A310:
9.5  fps
low 1920x1080
A310:
35.2  fps
med. 1920x1080
A310:
31.2  fps
high 1920x1080
A310:
25.4  fps
ultra 1920x1080
A310:
24.8  fps
low 1920x1080
A310:
29.9  fps
med. 1920x1080
A310:
18.9  fps
high 1920x1080
A310:
17.4  fps
ultra 1920x1080
A310:
17.1  fps
low 1920x1080
A310:
54.2  fps
med. 1920x1080
A310:
40.3  fps
high 1920x1080
A310:
27.4  fps
ultra 1920x1080
A310:
18.8  fps
Returnal

Returnal

2023
low 1920x1080
A310:
30  fps
med. 1920x1080
A310:
29  fps
high 1920x1080
A310:
26  fps
ultra 1920x1080
A310:
21  fps
low 1920x1080
A350M:
37.5  fps
A310:
42.3  fps
med. 1920x1080
A350M:
25  fps
A310:
35.2  fps
high 1920x1080
A350M:
19.8  fps
A310:
21.5  fps
ultra 1920x1080
A350M:
15.3  fps
A310:
15.4  fps
QHD 2560x1440
A350M:
10.1  fps
4K 3840x2160
A350M:
3  fps
low 1920x1080
A350M:
56.3  fps
med. 1920x1080
A350M:
42.6  fps
high 1920x1080
A350M:
36.1  fps
ultra 1920x1080
A350M:
29.7  fps
QHD 2560x1440
A350M:
20.4  fps
low 1920x1080
A350M:
71.9  fps
med. 1920x1080
A350M:
42.6  fps
high 1920x1080
A350M:
38.2  fps
ultra 1920x1080
A350M:
27.8  fps
QHD 2560x1440
A350M:
18.8  fps
4K 3840x2160
A350M:
4.4  fps
low 1920x1080
A350M:
42.1  fps
med. 1920x1080
A350M:
28.3  fps
high 1920x1080
A350M:
12.3  fps
ultra 1920x1080
A350M:
13.9  fps
QHD 2560x1440
A350M:
8.3  fps
4K 3840x2160
A350M:
3.1  fps
low 1920x1080
A350M:
41.5  fps
med. 1920x1080
A350M:
33.2  fps
high 1920x1080
A350M:
25.4  fps
ultra 1920x1080
A350M:
20.4  fps
QHD 2560x1440
A350M:
14.7  fps
4K 3840x2160
A350M:
7.2  fps
low 1920x1080
A350M:
41  fps
med. 1920x1080
A350M:
37  fps
high 1920x1080
A350M:
23  fps
ultra 1920x1080
A350M:
12  fps
QHD 2560x1440
A350M:
7  fps
4K 3840x2160
A350M:
6  fps
low 1920x1080
A350M:
29.9  fps
med. 1920x1080
A350M:
24.3  fps
high 1920x1080
A350M:
20  fps
QHD 2560x1440
A350M:
13.1 16.8 ~ 15 fps
4K 3840x2160
A350M:
6.4  fps
F1 22

F1 22

2022
low 1920x1080
A350M:
52.1  fps
med. 1920x1080
A350M:
51.4  fps
high 1920x1080
A350M:
35.5  fps
low 1920x1080
A350M:
80.6  fps
med. 1920x1080
A350M:
64.7  fps
high 1920x1080
A350M:
54.9  fps
ultra 1920x1080
A350M:
49.9  fps
QHD 2560x1440
A350M:
30.6  fps
4K 3840x2160
A350M:
10.8  fps
low 1920x1080
A350M:
32.2  fps
med. 1920x1080
A350M:
30.6  fps
high 1920x1080
A350M:
29.6  fps
ultra 1920x1080
A350M:
29.2  fps
low 1920x1080
A350M:
27.4  fps
med. 1920x1080
A350M:
18.5  fps
high 1920x1080
A350M:
16.2  fps
ultra 1920x1080
A350M:
11.6  fps
low 1920x1080
A350M:
78  fps
med. 1920x1080
A350M:
56  fps
high 1920x1080
A350M:
41  fps
ultra 1920x1080
A350M:
28  fps
low 1920x1080
A350M:
26.7  fps
med. 1920x1080
A350M:
21.9  fps
high 1920x1080
A350M:
17.8  fps
low 1920x1080
A350M:
68  fps
med. 1920x1080
A350M:
52  fps
high 1920x1080
A350M:
45  fps
ultra 1920x1080
A350M:
30  fps
QHD 2560x1440
A350M:
17  fps
4K 3840x2160
A350M:
2.6  fps
low 1920x1080
A350M:
22  fps
med. 1920x1080
A350M:
18  fps
high 1920x1080
A350M:
15  fps
ultra 1920x1080
A350M:
11  fps
low 1280x720
A350M:
121  fps
med. 1920x1080
A350M:
63  fps
high 1920x1080
A350M:
47  fps
ultra 1920x1080
A350M:
43  fps
low 1280x720
A350M:
108  fps
med. 1920x1080
A350M:
50  fps
high 1920x1080
A350M:
47  fps
ultra 1920x1080
A350M:
11  fps
QHD 2560x1440
A350M:
9  fps
4K 3840x2160
A350M:
6  fps
low 1280x720
A350M:
60  fps
med. 1920x1080
A350M:
32  fps
high 1920x1080
A350M:
25  fps
ultra 1920x1080
A350M:
21  fps
QHD 2560x1440
A350M:
12  fps
4K 3840x2160
A350M:
7  fps
low 1280x720
A350M:
139.3  fps
med. 1920x1080
A350M:
60.2  fps
high 1920x1080
A350M:
48.1  fps
ultra 1920x1080
A350M:
46  fps
QHD 2560x1440
A350M:
31  fps
4K 3840x2160
A350M:
14.9  fps
F1 2021

F1 2021

2021
low 1280x720
A350M:
166.6  fps
med. 1920x1080
A350M:
63.8  fps
high 1920x1080
A350M:
52.2  fps
ultra 1920x1080
A350M:
21.1  fps
low 1280x720
A350M:
65  fps
med. 1920x1080
A350M:
35  fps
high 1920x1080
A350M:
20  fps
ultra 1920x1080
A350M:
16  fps
QHD 2560x1440
A350M:
14  fps
low 1280x720
A350M:
43.1  fps
low 1280x720
A350M:
113.4  fps
med. 1920x1080
A350M:
55.6  fps
low 1280x720
A350M:
92  fps
med. 1920x1080
A350M:
46  fps
high 1920x1080
A350M:
37  fps
ultra 1920x1080
A350M:
27  fps
QHD 2560x1440
A350M:
17  fps
4K 3840x2160
A350M:
7  fps
low 1280x720
100%
GeForce GTX 1050 Ti Max-Q:
133.2  fps
med. 1920x1080
100%
GeForce GTX 1050 Ti Max-Q:
56.7  fps
high 1920x1080
100%
GeForce GTX 1050 Ti Max-Q:
44.3  fps
ultra 1920x1080
100%
GeForce GTX 1050 Ti Max-Q:
27.2  fps
4K 3840x2160
100%
GeForce GTX 1050 Ti Max-Q:
11.3  fps
Anthem

Anthem

2019
low 1280x720
100%
GeForce GTX 1050 Ti Max-Q:
67.1  fps
med. 1920x1080
100%
GeForce GTX 1050 Ti Max-Q:
40.5  fps
high 1920x1080
100%
GeForce GTX 1050 Ti Max-Q:
34  fps
ultra 1920x1080
100%
GeForce GTX 1050 Ti Max-Q:
30.4  fps
4K 3840x2160
100%
GeForce GTX 1050 Ti Max-Q:
9  fps
low 1280x720
100%
GeForce GTX 1050 Ti Max-Q:
83 89 ~ 86 fps
med. 1920x1080
100%
GeForce GTX 1050 Ti Max-Q:
47 50 ~ 49 fps
high 1920x1080
100%
GeForce GTX 1050 Ti Max-Q:
43 46 ~ 45 fps
ultra 1920x1080
100%
GeForce GTX 1050 Ti Max-Q:
40 43 ~ 42 fps
QHD 2560x1440
100%
GeForce GTX 1050 Ti Max-Q:
29  fps
4K 3840x2160
100%
GeForce GTX 1050 Ti Max-Q:
14 15 ~ 15 fps
low 1280x720
100%
GeForce GTX 1050 Ti Max-Q:
55.5 60.4 ~ 58 fps
med. 1920x1080
100%
GeForce GTX 1050 Ti Max-Q:
31.4 49.8 ~ 41 fps
high 1920x1080
100%
GeForce GTX 1050 Ti Max-Q:
23.5 36.5 ~ 30 fps
ultra 1920x1080
100%
GeForce GTX 1050 Ti Max-Q:
19.3 28.3 ~ 24 fps
4K 3840x2160
100%
GeForce GTX 1050 Ti Max-Q:
4.7  fps
low 1280x720
100%
GeForce GTX 1050 Ti Max-Q:
73.2  fps
med. 1920x1080
100%
GeForce GTX 1050 Ti Max-Q:
47.9  fps
high 1920x1080
100%
GeForce GTX 1050 Ti Max-Q:
36.1  fps
ultra 1920x1080
100%
GeForce GTX 1050 Ti Max-Q:
35.3  fps
4K 3840x2160
100%
GeForce GTX 1050 Ti Max-Q:
12.9  fps
low 1280x720
100%
GeForce GTX 1050 Ti Max-Q:
134.5  fps
med. 1920x1080
100%
GeForce GTX 1050 Ti Max-Q:
87.4  fps
high 1920x1080
100%
GeForce GTX 1050 Ti Max-Q:
73.7  fps
ultra 1920x1080
100%
GeForce GTX 1050 Ti Max-Q:
65  fps
4K 3840x2160
100%
GeForce GTX 1050 Ti Max-Q:
13.2  fps
low 1280x720
100%
GeForce GTX 1050 Ti Max-Q:
100.1  fps
med. 1920x1080
100%
GeForce GTX 1050 Ti Max-Q:
57.3  fps
high 1920x1080
100%
GeForce GTX 1050 Ti Max-Q:
47.9  fps
ultra 1920x1080
100%
GeForce GTX 1050 Ti Max-Q:
44.8  fps
4K 3840x2160
100%
GeForce GTX 1050 Ti Max-Q:
17.3  fps
low 1280x720
100%
GeForce GTX 1050 Ti Max-Q:
193.6  fps
med. 1920x1080
100%
GeForce GTX 1050 Ti Max-Q:
128.7  fps
high 1920x1080
100%
GeForce GTX 1050 Ti Max-Q:
80.5  fps
ultra 1920x1080
100%
GeForce GTX 1050 Ti Max-Q:
61  fps
4K 3840x2160
100%
GeForce GTX 1050 Ti Max-Q:
22  fps
Hitman 2

Hitman 2

2018
low 1280x720
100%
GeForce GTX 1050 Ti Max-Q:
64.8  fps
med. 1920x1080
100%
GeForce GTX 1050 Ti Max-Q:
41  fps
high 1920x1080
100%
GeForce GTX 1050 Ti Max-Q:
37.5  fps
ultra 1920x1080
100%
GeForce GTX 1050 Ti Max-Q:
35.9  fps
4K 3840x2160
100%
GeForce GTX 1050 Ti Max-Q:
11.3  fps
low 1280x720
100%
GeForce GTX 1050 Ti Max-Q:
118.7  fps
med. 1920x1080
100%
GeForce GTX 1050 Ti Max-Q:
46.3  fps
high 1920x1080
100%
GeForce GTX 1050 Ti Max-Q:
45  fps
ultra 1920x1080
100%
GeForce GTX 1050 Ti Max-Q:
37.5  fps
4K 3840x2160
100%
GeForce GTX 1050 Ti Max-Q:
10.1  fps
low 1280x720
100%
GeForce GTX 1050 Ti Max-Q:
67  fps
med. 1920x1080
100%
GeForce GTX 1050 Ti Max-Q:
43  fps
high 1920x1080
100%
GeForce GTX 1050 Ti Max-Q:
34  fps
ultra 1920x1080
100%
GeForce GTX 1050 Ti Max-Q:
18  fps
4K 3840x2160
100%
GeForce GTX 1050 Ti Max-Q:
7  fps
low 1280x720
100%
GeForce GTX 1050 Ti Max-Q:
122  fps
med. 1920x1080
100%
GeForce GTX 1050 Ti Max-Q:
67  fps
high 1920x1080
100%
GeForce GTX 1050 Ti Max-Q:
61  fps
ultra 1920x1080
100%
GeForce GTX 1050 Ti Max-Q:
47  fps
4K 3840x2160
100%
GeForce GTX 1050 Ti Max-Q:
20  fps
low 1280x720
100%
GeForce GTX 1050 Ti Max-Q:
97  fps
med. 1920x1080
100%
GeForce GTX 1050 Ti Max-Q:
39  fps
high 1920x1080
100%
GeForce GTX 1050 Ti Max-Q:
35  fps
ultra 1920x1080
100%
GeForce GTX 1050 Ti Max-Q:
29  fps
4K 3840x2160
100%
GeForce GTX 1050 Ti Max-Q:
11  fps
Strange Brigade

Strange Brigade

2018
low 1280x720
A350M:
138 163.4 ~ 151 fps
A310:
187.3  fps
med. 1920x1080
A350M:
59.8 71.6 ~ 66 fps
A310:
79.7  fps
high 1920x1080
A350M:
47.4 58.7 ~ 53 fps
A310:
65.3  fps
ultra 1920x1080
A350M:
40.9 49.1 ~ 45 fps
A310:
53.8  fps
QHD 2560x1440
A350M:
36.6  fps
4K 3840x2160
A350M:
18.8 19.6 ~ 19 fps
F1 2018

F1 2018

2018
low 1280x720
100%
GeForce GTX 1050 Ti Max-Q:
134  fps
med. 1920x1080
100%
GeForce GTX 1050 Ti Max-Q:
80  fps
high 1920x1080
100%
GeForce GTX 1050 Ti Max-Q:
62  fps
ultra 1920x1080
100%
GeForce GTX 1050 Ti Max-Q:
38  fps
4K 3840x2160
100%
GeForce GTX 1050 Ti Max-Q:
17  fps
low 1280x720
100%
GeForce GTX 1050 Ti Max-Q:
100.3  fps
med. 1920x1080
100%
GeForce GTX 1050 Ti Max-Q:
39.2  fps
high 1920x1080
100%
GeForce GTX 1050 Ti Max-Q:
34.9  fps
ultra 1920x1080
100%
GeForce GTX 1050 Ti Max-Q:
26.8  fps
4K 3840x2160
100%
GeForce GTX 1050 Ti Max-Q:
8.3  fps
low 1280x720
100%
GeForce GTX 1050 Ti Max-Q:
60  fps
med. 1920x1080
100%
GeForce GTX 1050 Ti Max-Q:
49.1  fps
high 1920x1080
100%
GeForce GTX 1050 Ti Max-Q:
45.3  fps
ultra 1920x1080
100%
GeForce GTX 1050 Ti Max-Q:
42  fps
4K 3840x2160
100%
GeForce GTX 1050 Ti Max-Q:
14  fps
Far Cry 5

Far Cry 5

2018
low 1280x720
100%
GeForce GTX 1050 Ti Max-Q:
76 91 91 ~ 86 fps
90%
A350M:
65 89 ~ 77 fps
115%
A310:
99  fps
med. 1920x1080
100%
GeForce GTX 1050 Ti Max-Q:
45 48 48 ~ 47 fps
89%
A350M:
39 44 ~ 42 fps
109%
A310:
51  fps
high 1920x1080
100%
GeForce GTX 1050 Ti Max-Q:
41 44 44 ~ 43 fps
91%
A350M:
37 41 ~ 39 fps
109%
A310:
47  fps
ultra 1920x1080
100%
GeForce GTX 1050 Ti Max-Q:
38 38 41 ~ 39 fps
95%
A350M:
35 38 ~ 37 fps
113%
A310:
44  fps
QHD 2560x1440
A350M:
25  fps
4K 3840x2160
100%
GeForce GTX 1050 Ti Max-Q:
13 13 14 ~ 13 fps
92%
A350M:
12  fps
low 1280x720
100%
GeForce GTX 1050 Ti Max-Q:
92.7  fps
42%
A350M:
33.9 43.9 ~ 39 fps
med. 1920x1080
100%
GeForce GTX 1050 Ti Max-Q:
80.3  fps
39%
A350M:
29.4 32.2 ~ 31 fps
high 1920x1080
100%
GeForce GTX 1050 Ti Max-Q:
69.4  fps
39%
A350M:
25.8 27.9 ~ 27 fps
4K 3840x2160
100%
GeForce GTX 1050 Ti Max-Q:
39.5  fps
50%
A350M:
19.6  fps
low 1280x720
100%
GeForce GTX 1050 Ti Max-Q:
61.5 75.1 ~ 68 fps
91%
A350M:
59.3 64.8 ~ 62 fps
med. 1920x1080
100%
GeForce GTX 1050 Ti Max-Q:
36.6 37.7 ~ 37 fps
86%
A350M:
29.8 33.2 ~ 32 fps
113%
A310:
41.7  fps
high 1920x1080
100%
GeForce GTX 1050 Ti Max-Q:
23.3 25 ~ 24 fps
79%
A350M:
18.2 20.7 ~ 19 fps
100%
A310:
24.1  fps
QHD 2560x1440
A350M:
13.6  fps
4K 3840x2160
100%
GeForce GTX 1050 Ti Max-Q:
9.2  fps
76%
A350M:
7 7.3 ~ 7 fps
low 1280x720
100%
GeForce GTX 1050 Ti Max-Q:
92.3  fps
med. 1920x1080
100%
GeForce GTX 1050 Ti Max-Q:
42  fps
high 1920x1080
100%
GeForce GTX 1050 Ti Max-Q:
34.3  fps
ultra 1920x1080
100%
GeForce GTX 1050 Ti Max-Q:
30.4  fps
low 1280x720
100%
GeForce GTX 1050 Ti Max-Q:
58  fps
med. 1920x1080
100%
GeForce GTX 1050 Ti Max-Q:
41  fps
high 1920x1080
100%
GeForce GTX 1050 Ti Max-Q:
33  fps
ultra 1920x1080
100%
GeForce GTX 1050 Ti Max-Q:
27  fps
4K 3840x2160
100%
GeForce GTX 1050 Ti Max-Q:
13  fps
Destiny 2

Destiny 2

2017
low 1280x720
100%
GeForce GTX 1050 Ti Max-Q:
119.5  fps
med. 1920x1080
100%
GeForce GTX 1050 Ti Max-Q:
69.4  fps
high 1920x1080
100%
GeForce GTX 1050 Ti Max-Q:
64.3  fps
ultra 1920x1080
100%
GeForce GTX 1050 Ti Max-Q:
57.9  fps
4K 3840x2160
100%
GeForce GTX 1050 Ti Max-Q:
18.9  fps
low 1280x720
100%
GeForce GTX 1050 Ti Max-Q:
105  fps
med. 1920x1080
100%
GeForce GTX 1050 Ti Max-Q:
55  fps
high 1920x1080
100%
GeForce GTX 1050 Ti Max-Q:
41  fps
ultra 1920x1080
100%
GeForce GTX 1050 Ti Max-Q:
31  fps
4K 3840x2160
100%
GeForce GTX 1050 Ti Max-Q:
13  fps
low 1280x720
100%
GeForce GTX 1050 Ti Max-Q:
129.8  fps
med. 1366x768
100%
GeForce GTX 1050 Ti Max-Q:
123.6  fps
high 1920x1080
100%
GeForce GTX 1050 Ti Max-Q:
115.7  fps
ultra 1920x1080
100%
GeForce GTX 1050 Ti Max-Q:
112.6  fps
4K 3820x2160
100%
GeForce GTX 1050 Ti Max-Q:
65.2  fps
low 1280x720
100%
GeForce GTX 1050 Ti Max-Q:
249.1  fps
med. 1920x1080
100%
GeForce GTX 1050 Ti Max-Q:
169.1  fps
high 1920x1080
100%
GeForce GTX 1050 Ti Max-Q:
112.5  fps
4K 3840x2160
100%
GeForce GTX 1050 Ti Max-Q:
42.3  fps
Prey

Prey

2017
low 1280x720
100%
GeForce GTX 1050 Ti Max-Q:
142.4  fps
med. 1920x1080
100%
GeForce GTX 1050 Ti Max-Q:
85.6  fps
high 1920x1080
100%
GeForce GTX 1050 Ti Max-Q:
68.3  fps
ultra 1920x1080
100%
GeForce GTX 1050 Ti Max-Q:
58.9  fps
4K 3840x2160
100%
GeForce GTX 1050 Ti Max-Q:
21.7  fps
low 1280x720
100%
GeForce GTX 1050 Ti Max-Q:
68.6 96.7 ~ 83 fps
med. 1920x1080
100%
GeForce GTX 1050 Ti Max-Q:
39.3 42.7 45.9 ~ 43 fps
high 1920x1080
100%
GeForce GTX 1050 Ti Max-Q:
35.3 40 41.9 ~ 39 fps
ultra 1920x1080
100%
GeForce GTX 1050 Ti Max-Q:
19.1 22.4 23.4 ~ 22 fps
4K 3840x2160
100%
GeForce GTX 1050 Ti Max-Q:
13.9 14.5 ~ 14 fps
For Honor

For Honor

2017
low 1280x720
100%
GeForce GTX 1050 Ti Max-Q:
113.6 179.3 ~ 146 fps
med. 1920x1080
100%
GeForce GTX 1050 Ti Max-Q:
63.8 68.2 ~ 66 fps
high 1920x1080
100%
GeForce GTX 1050 Ti Max-Q:
64.9 65.5 ~ 65 fps
ultra 1920x1080
100%
GeForce GTX 1050 Ti Max-Q:
49.5 50.4 ~ 50 fps
4K 3840x2160
100%
GeForce GTX 1050 Ti Max-Q:
19.2 19.2 ~ 19 fps
high 1920x1080
100%
GeForce GTX 1050 Ti Max-Q:
137.3  fps
ultra 1920x1080
100%
GeForce GTX 1050 Ti Max-Q:
104.6  fps
low 1280x720
100%
GeForce GTX 1050 Ti Max-Q:
89.5 154.8 ~ 122 fps
med. 1366x768
100%
GeForce GTX 1050 Ti Max-Q:
85.2 120 ~ 103 fps
high 1920x1080
100%
GeForce GTX 1050 Ti Max-Q:
51.7 58.1 ~ 55 fps
ultra 1920x1080
100%
GeForce GTX 1050 Ti Max-Q:
49.8 53.1 ~ 51 fps
4K 3840x2160
100%
GeForce GTX 1050 Ti Max-Q:
20.7 21.1 ~ 21 fps
low 1024x768
100%
GeForce GTX 1050 Ti Max-Q:
112.5  fps
med. 1366x768
100%
GeForce GTX 1050 Ti Max-Q:
85.8  fps
high 1920x1080
100%
GeForce GTX 1050 Ti Max-Q:
51  fps
ultra 1920x1080
100%
GeForce GTX 1050 Ti Max-Q:
43  fps
Overwatch

Overwatch

2016
low 1280x720
100%
GeForce GTX 1050 Ti Max-Q:
285.4  fps
med. 1366x768
100%
GeForce GTX 1050 Ti Max-Q:
233.9  fps
high 1920x1080
100%
GeForce GTX 1050 Ti Max-Q:
117.7  fps
ultra 1920x1080
100%
GeForce GTX 1050 Ti Max-Q:
70.5  fps
4K 3840x2160
100%
GeForce GTX 1050 Ti Max-Q:
37  fps
low 1280x768
100%
GeForce GTX 1050 Ti Max-Q:
63  fps
med. 1920x1080
100%
GeForce GTX 1050 Ti Max-Q:
41.3  fps
high 1920x1080
100%
GeForce GTX 1050 Ti Max-Q:
35.8  fps
4K 3840x2160
100%
GeForce GTX 1050 Ti Max-Q:
15.7  fps
low 1280x720
100%
GeForce GTX 1050 Ti Max-Q:
114.2 137.2 ~ 126 fps
med. 1366x768
100%
GeForce GTX 1050 Ti Max-Q:
83.4 89.5 ~ 86 fps
high 1920x1080
100%
GeForce GTX 1050 Ti Max-Q:
41.9 42.5 ~ 42 fps
ultra 1920x1080
100%
GeForce GTX 1050 Ti Max-Q:
32.2 34.8 ~ 34 fps
4K 3840x2160
100%
GeForce GTX 1050 Ti Max-Q:
14.6 15.7 ~ 15 fps
low 1024x768
100%
GeForce GTX 1050 Ti Max-Q:
99.9 118.3 141.1 141.7 ~ 125 fps
med. 1366x768
100%
GeForce GTX 1050 Ti Max-Q:
67.6 73.6 82.9 85.7 ~ 77 fps
high 1920x1080
100%
GeForce GTX 1050 Ti Max-Q:
38.8 47.3 47.4 47.7 ~ 45 fps
ultra 1920x1080
100%
GeForce GTX 1050 Ti Max-Q:
31.7 39.5 39.9 40.5 ~ 38 fps
4K 3840x2160
100%
GeForce GTX 1050 Ti Max-Q:
16.8 17.1 ~ 17 fps
low 1024x768
100%
GeForce GTX 1050 Ti Max-Q:
236.6 263.6 ~ 250 fps
med. 1366x768
100%
GeForce GTX 1050 Ti Max-Q:
154.6 162.2 ~ 158 fps
high 1920x1080
100%
GeForce GTX 1050 Ti Max-Q:
90.2 92.7 ~ 91 fps
ultra 1920x1080
100%
GeForce GTX 1050 Ti Max-Q:
62.5 67.5 ~ 65 fps
4K 3840x2160
100%
GeForce GTX 1050 Ti Max-Q:
27.7 29.3 ~ 29 fps
low 1366x768
100%
GeForce GTX 1050 Ti Max-Q:
168.6  fps
med. 1366x768
100%
GeForce GTX 1050 Ti Max-Q:
143.9  fps
high 1920x1080
100%
GeForce GTX 1050 Ti Max-Q:
112.7  fps
ultra 1920x1080
100%
GeForce GTX 1050 Ti Max-Q:
101  fps
4K 3840 x 2160
100%
GeForce GTX 1050 Ti Max-Q:
34.4  fps
low 1280x720
100%
GeForce GTX 1050 Ti Max-Q:
111.9  fps
92%
A350M:
102.1 102.9 ~ 103 fps
med. 1366x768
100%
GeForce GTX 1050 Ti Max-Q:
104.2  fps
82%
A350M:
83.5 85.8 ~ 85 fps
high 1920x1080
100%
GeForce GTX 1050 Ti Max-Q:
98.1  fps
63%
A350M:
60.6 63.9 ~ 62 fps
ultra 1920x1080
100%
GeForce GTX 1050 Ti Max-Q:
93.5  fps
63%
A350M:
56.1 62.1 ~ 59 fps
4K 3840x2160
100%
GeForce GTX 1050 Ti Max-Q:
46  fps
low 1024x768
100%
GeForce GTX 1050 Ti Max-Q:
122 130.7 130.9 131.3 138.6 145 ~ 133 fps
98%
A350M:
120 140.1 ~ 130 fps
132%
A310:
176  fps
med. 1366x768
100%
GeForce GTX 1050 Ti Max-Q:
73.2 76.6 80.9 82.6 87.2 99 ~ 83 fps
96%
A350M:
76 83.6 ~ 80 fps
130%
A310:
108  fps
high 1920x1080
100%
GeForce GTX 1050 Ti Max-Q:
42.6 44.2 45.1 46 48.2 60 ~ 48 fps
90%
A350M:
41 45 ~ 43 fps
117%
A310:
56  fps
ultra 1920x1080
100%
GeForce GTX 1050 Ti Max-Q:
23.5 24.5 24.9 25.2 25.4 26 43 ~ 28 fps
68%
A350M:
18.4 20.5 ~ 19 fps
104%
A310:
29  fps
4K 3840x2160
100%
GeForce GTX 1050 Ti Max-Q:
15.9 16.4 17.1 ~ 16 fps
94%
A350M:
15.1  fps
GTA V

GTA V

2015
low 1024x768
100%
GeForce GTX 1050 Ti Max-Q:
150.4  fps
102%
A350M:
134.5 170.7 ~ 153 fps
125%
A310:
187.7  fps
med. 1366x768
100%
GeForce GTX 1050 Ti Max-Q:
143.3  fps
93%
A350M:
109.3 156.3 ~ 133 fps
131%
A310:
187.6  fps
high 1920x1080
100%
GeForce GTX 1050 Ti Max-Q:
78.9  fps
47%
A350M:
36.5 38 ~ 37 fps
49%
A310:
38.3  fps
ultra 1920x1080
100%
GeForce GTX 1050 Ti Max-Q:
34.5  fps
43%
A350M:
14.7 15.2 ~ 15 fps
49%
A310:
16.8  fps
QHD 2560x1440
A350M:
10.1  fps
4K 3840x2160
100%
GeForce GTX 1050 Ti Max-Q:
35.5  fps
31%
A350M:
11.1  fps
low 1280x720
100%
GeForce GTX 1050 Ti Max-Q:
244.3 262 297 298.2 299 ~ 280 fps
med. 1366x768
100%
GeForce GTX 1050 Ti Max-Q:
194.6 204 208.7 209.3 214 ~ 206 fps
high 1366x768
100%
GeForce GTX 1050 Ti Max-Q:
175.8 181.3 183.3 183.5 187.8 ~ 182 fps
ultra 1920x1080
100%
GeForce GTX 1050 Ti Max-Q:
71.3 71.8 72.2 73 74.6 ~ 73 fps
low 1024x768
100%
GeForce GTX 1050 Ti Max-Q:
228.2  fps
med. 1366x768
100%
GeForce GTX 1050 Ti Max-Q:
202.6  fps
high 1366x768
100%
GeForce GTX 1050 Ti Max-Q:
202.1  fps
ultra 1920x1080
100%
GeForce GTX 1050 Ti Max-Q:
170.1  fps
low 1024x768
100%
GeForce GTX 1050 Ti Max-Q:
433.4  fps
med. 1360x768
100%
GeForce GTX 1050 Ti Max-Q:
200.4  fps
high 1360x768
100%
GeForce GTX 1050 Ti Max-Q:
186.7  fps
ultra 1920x1080
100%
GeForce GTX 1050 Ti Max-Q:
126.7  fps

Average Gaming NVIDIA GeForce GTX 1050 Ti Max-Q → 100%

Average Gaming 30-70 fps → 100%

Average Gaming Intel Arc A350M → 75%

Average Gaming 30-70 fps → 72%

Average Gaming Intel Arc A310 → 107%

Average Gaming 30-70 fps → 101%

Intel Arc A310lowmed.highultraQHD4K
Last Epoch62.553.439.630.9
Skull & Bones
Helldivers 222.419.516.716.3
Enshrouded20.41813.89.88
Palworld38.333.223.220.9
Prince of Persia The Lost Crown260154.7141.6
Ready or Not102.275.658.334.6
The Finals7553.146.634.6
Avatar Frontiers of Pandora1614118.1
EA Sports WRC34.327.318.616.8
Alan Wake 216.313.912.3
Lords of the Fallen22.722.218.414
Total War Pharaoh11173.641.632.3
Assassin's Creed Mirage37322520
Counter-Strike 2153.5106.337.527.7
Cyberpunk 2077 2.1 Phantom Liberty4131.125.723.7
Lies of P49.3423630.3
The Crew Motorfest37332722
Starfield17.314.21310.3
Armored Core 656.343.83926.9
Atlas Fallen32.631.826.78.12
Baldur's Gate 340.63225.524.9
Ratchet & Clank Rift Apart30.324.619.116.1
F1 2388754212
Resident Evil 4 Remake42.430.121.69.5
Company of Heroes 335.231.225.424.8
Sons of the Forest29.918.917.417.1
Atomic Heart54.240.327.418.8
Returnal30292621
Hogwarts Legacy42.335.221.515.4
Strange Brigade187.379.765.353.8
Far Cry 599514744
Final Fantasy XV Benchmark41.724.1
The Witcher 31761085629
GTA V187.7187.638.316.8
< 30 fps
< 60 fps
< 120 fps
≥ 120 fps
7
15
6
4
10
16
6
2
21
11
1
1
24
7

1


Intel Arc A350Mlowmed.highultraQHD4K
Hogwarts Legacy37.52519.815.310.12.96
The Witcher 3 v4.0056.342.636.129.720.4
High On Life71.942.638.227.818.84.36
The Callisto Protocol42.128.312.313.98.33.1
Spider-Man Miles Morales41.533.225.420.414.77.22
Call of Duty Modern Warfare 2 20224137231276
A Plague Tale Requiem29.924.320156.4
F1 2252.151.435.5
Vampire Bloodhunt80.664.754.949.930.610.8
Ghostwire Tokyo32.230.629.629.2
Cyberpunk 2077 1.627.418.516.211.6
GRID Legends78564128
Dying Light 226.721.917.8
Rainbow Six Extraction68524530172.6
God of War22181511
Farming Simulator 22121634743
Forza Horizon 510850471196
Riders Republic60322521127
Back 4 Blood139.360.248.1463114.9
F1 2021166.663.852.221.1
Assassin´s Creed Valhalla6535201614
Flight Simulator 202043.1
Doom Eternal113.455.6
The Division 292463727177
Strange Brigade15166534536.619
Far Cry 5774239372512
X-Plane 11.1139312719.6
Final Fantasy XV Benchmark62321913.67
Dota 2 Reborn103856259
The Witcher 313080431915.1
GTA V153133371510.111.1
< 30 fps
< 60 fps
< 120 fps
≥ 120 fps
4
9
12
6
6
16
7
1
13
15
1
17
7

15
3

18


NVIDIA GeForce GTX 1050 Ti Max-Qlowmed.highultraQHD4K
Dirt Rally 2.0133.256.744.327.211.3
Anthem67.140.53430.49
Far Cry New Dawn864945422915
Metro Exodus584130244.7
Just Cause 473.247.936.135.312.9
Darksiders III134.587.473.76513.2
Battlefield V100.157.347.944.817.3
Farming Simulator 19193.6128.780.56122
Hitman 264.84137.535.911.3
Call of Duty Black Ops 4118.746.34537.510.1
Assassin´s Creed Odyssey674334187
Forza Horizon 412267614720
Shadow of the Tomb Raider9739352911
F1 201813480623817
Monster Hunter World100.339.234.926.88.3
The Crew 26049.145.34214
Far Cry 58647433913
X-Plane 11.1192.780.369.439.5
Final Fantasy XV Benchmark6837249.2
Star Wars Battlefront 292.34234.330.4
Assassin´s Creed Origins5841332713
Destiny 2119.569.464.357.918.9
Middle-earth: Shadow of War10555413113
Team Fortress 2129.8123.6115.7112.665.2
Rocket League249.1169.1112.542.3
Prey142.485.668.358.921.7
Ghost Recon Wildlands8343392214
For Honor14666655019
Farming Simulator 17137.3104.6
Battlefield 1122103555121
Civilization VI112.585.85143
Overwatch285.4233.9117.770.537
Ashes of the Singularity6341.335.815.7
The Division12686423415
Rise of the Tomb Raider12577453817
Rainbow Six Siege250158916529
World of Warships168.6143.9112.710134.4
Dota 2 Reborn111.9104.298.193.546
The Witcher 313383482816
GTA V150.4143.378.934.535.5
BioShock Infinite28020618273
Diablo III228.2202.6202.1170.1
StarCraft 2433.4200.4186.7126.7
< 30 fps
< 60 fps
< 120 fps
≥ 120 fps

2
20
20

19
13
10
1
23
15
4
8
20
9
2
1


30
6
1

Eine Liste mit weiteren Spielen und allen Grafikkarten finden Sie auf unserer Seite: Welches Spiel ist mit welcher Grafikkarte spielbar?

v1.28
log 02. 12:28:01

#0 ran 0s before starting gpusingle class +0s ... 0s

#1 checking url part for id 8480 +0s ... 0s

#2 checking url part for id 11149 +0s ... 0s

#3 checking url part for id 12464 +0s ... 0s

#4 redirected to Ajax server, took 1727864880s time from redirect:1 +0s ... 0s

#5 did not recreate cache, as it is less than 5 days old! Created at Tue, 01 Oct 2024 05:16:38 +0200 +0s ... 0s

#6 composed specs +0.003s ... 0.003s

#7 did output specs +0s ... 0.003s

#8 start showIntegratedCPUs +0s ... 0.003s

#9 getting avg benchmarks for device 8480 +0.001s ... 0.004s

#10 got single benchmarks 8480 +0.001s ... 0.005s

#11 getting avg benchmarks for device 11149 +0s ... 0.005s

#12 got single benchmarks 11149 +0s ... 0.006s

#13 getting avg benchmarks for device 12464 +0.001s ... 0.007s

#14 got single benchmarks 12464 +0s ... 0.007s

#15 got avg benchmarks for devices +0s ... 0.007s

#16 min, max, avg, median took s +0.024s ... 0.031s

#17 before gaming benchmark output +0s ... 0.031s

#18 Got 621 rows for game benchmarks. +0.025s ... 0.056s

#19 composed SQL query for gamebenchmarks +0s ... 0.056s

#20 got data and put it in $dataArray +0.004s ... 0.06s

#21 benchmarks composed for output. +0.028s ... 0.088s

#22 calculated avg scores. +0s ... 0.088s

#23 return log +0.001s ... 0.089s

Teilen Sie diesen Artikel, um uns zu unterstützen. Jeder Link hilft!
> Notebook Test, Laptop Test und News > Benchmarks / Technik > Benchmarks / Technik > Grafikkarten Vergleich - Head 2 Head
Autor: Klaus Hinum,  8.09.2017 (Update:  1.07.2023)