Notebookcheck Logo

NVIDIA GeForce GTX 1050 Ti (Desktop) vs NVIDIA GeForce RTX 2070 Mobile vs NVIDIA GeForce RTX 2080 Max-Q

NVIDIA GeForce GTX 1050 Ti (Desktop)

► remove from comparison NVIDIA GeForce GTX 1050 Ti (Desktop)

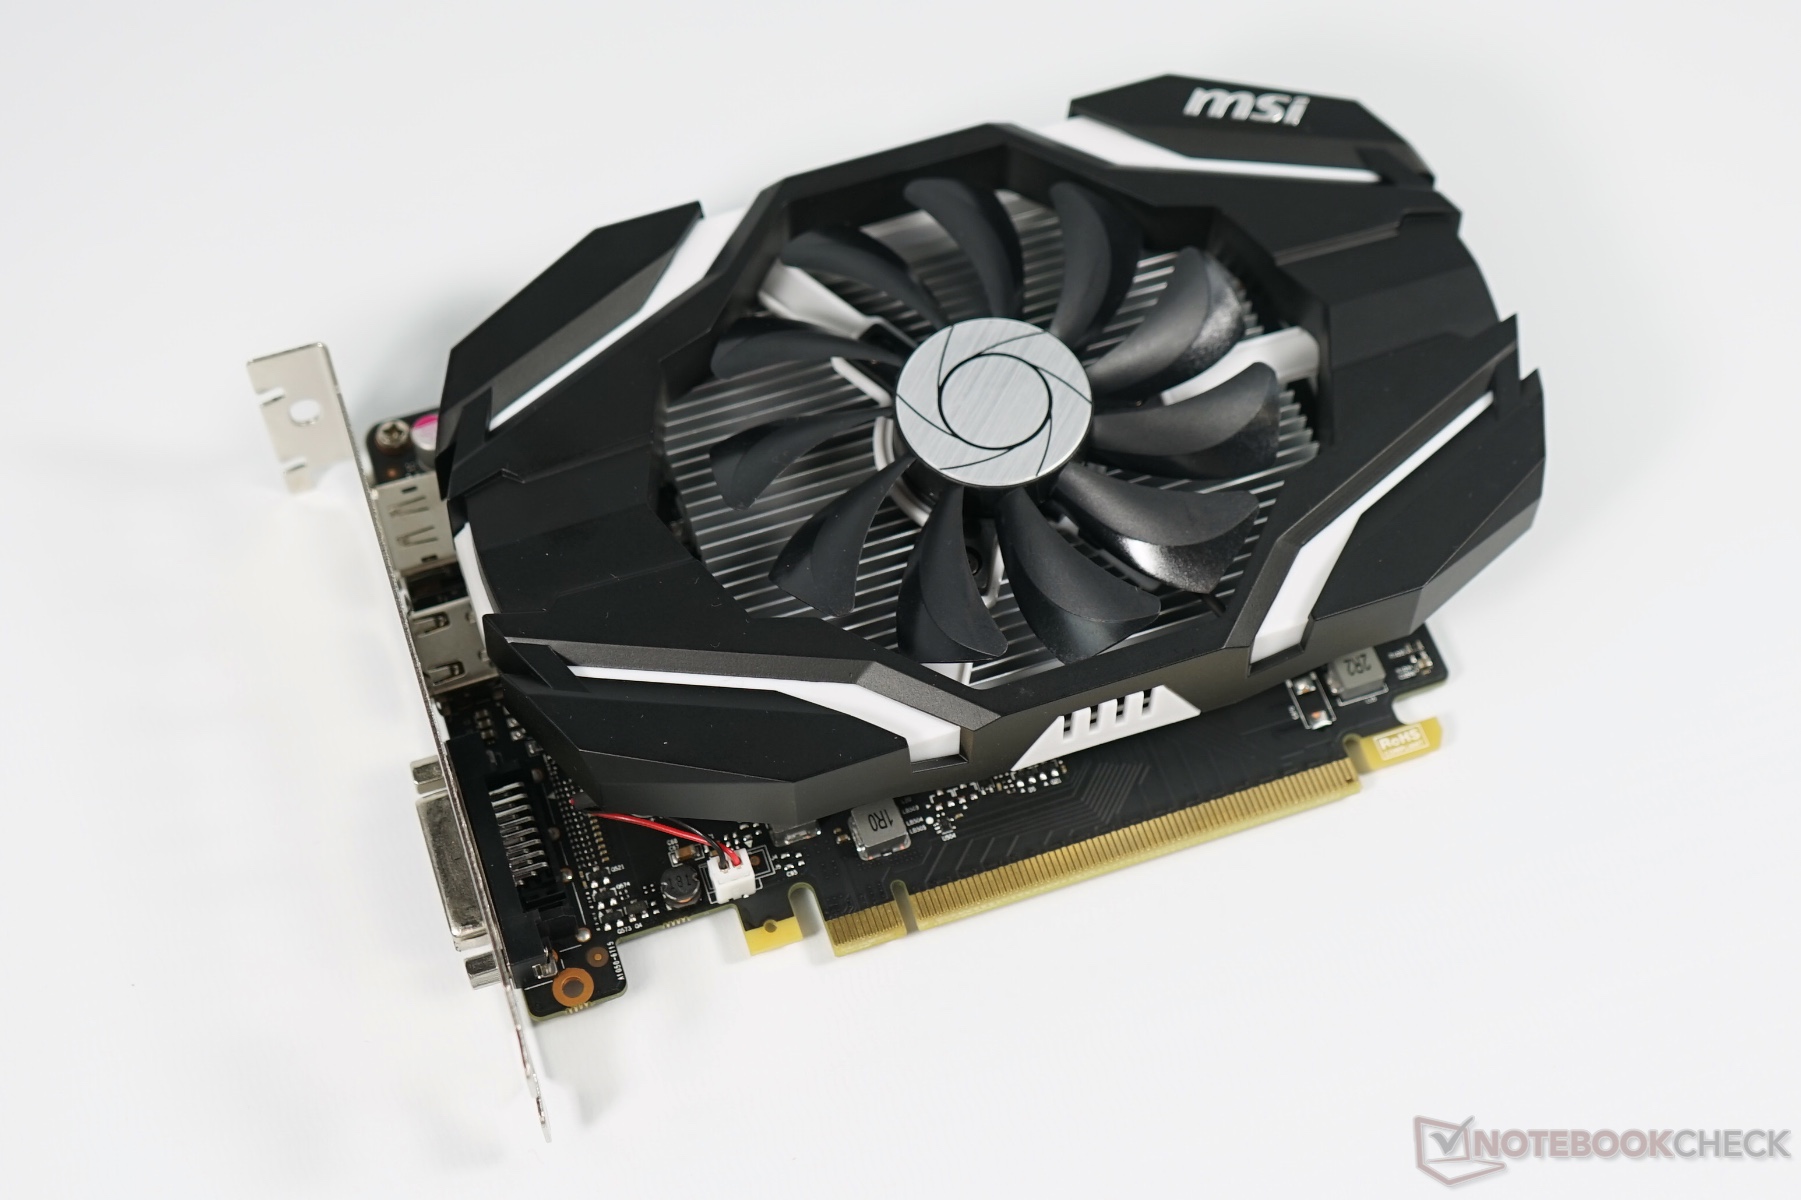
Die Nvidia GeForce GTX 1050 Ti (N17P-G1) ist eine Einstiegs-Gaming-Grafikkarte für Desktops. Sie basiert auf die Pascal Architektur und wird in 14 nm FinFET bei Samsung gefertigt (im Unterschied zu den größeren Pascal Chips, welche in 16nm bei TSMC gefertigt werden). Sie basiert auf den kleinen GP107 Chip und ist spezifiziert mit einem TDP von 75 Watt. Als übliche Speicherausstattung gibt Nvidia 4 GB GDDR5 an. Das mobile Pendant (GTX 1050 Ti für Notebooks) wird später vorgestellt (Gerüchte sprechen von Anfang 2017) und sollte eine ähnliche Leistung bieten.

Die Performance in unseren Tests reiht sich zwischen Radeon RX 460 und RX 470 auf dem Niveau der alten GeForce GTX 960 (bzw 970M) ein. Dadurch eignet sich die Karte gut für 1920x1080 in hohen Detail Settings (ausser bei sehr anspruchsvollen Spielen, siehe Benchmarks unten).

Besonders am Windows Desktop ist die GTX 1050 Ti sehr sparsam. Unser MSI Sample brauchte nur 5 Watt mehr als die integriert Grafikkarte im Prozessor. Mehr Details erfahren Sie im ausführlichen Testbericht der MSI GTX 1050 Ti.

NVIDIA GeForce RTX 2070 Mobile

► remove from comparison

Die Nvidia GeForce RTX 2070 für Laptops ist nach der mobilen RTX 2080 die zweitschnellste mobile Grafikkarte in 2019. Sie basiert auf die Desktop RTX 2070 jedoch werden die Shader deutlich niedriger getaktet (-11% Boost, -14% Base). Die GPU verfügt ebenfalls über die 2.304 Shadereinheiten, sowie 8 GB GDDR6-Speicher an einem 256-Bit-Interface (14 GHz, 448 GB/s).

Mit dem "Super"-Refresh im April 2020 wird auch eine neue Version der RTX 2070 mit höheren Taktraten verfügbar sein (N18E-G1R-A1, TU106-735-A1 Chip). Diese taktet mit 1305 - 1485 MHz minimal höher bei gleichem Stromverbrauch. Der Speichertakt ist jedoch eventuell auf 5501 MHz verringert. Es gibt jedoch auch die schneller taktende RTX 2070 Super Mobile mit 2.560 Shader und geringeren Taktraten.

Features

Der TU106-Chip wird in 12nm gefertigt und bietet eine Reihe neuer Features, wie DLSS (Deep Learning Super Sampling) und Real Time Ray Tracing. Dadurch lassen sich vor allem Beleuchtungseffekte sehr viel realistischer darstellen. Weiterhin gibt es Support für DisplayPort 1.4 (ready), HDMI 2.0b, HDR, Simultaneous Multi-Projection (SMP) sowie H.265 Video De- und Encoding (PlayReady 3.0). 

Performance

Die Performance der mobilen GeForce RTX 2070 sollte etwas unterhalb der Desktop RTX 2070 liegen und in etwa auf dem Niveau der mobilen GTX 1080. Damit ordnet sich die RTX 2070 im absoluten High-End-Segment ein und kann die meisten Spiele des Jahres 2018 in hohen Einstellungen und 4K-Auflösung flüssig darstellen.

Der Stromverbrauch der normalen (Max-P) Notebook-Grafikkarte ist mit 115 Watt von Nvidia spezifiziert und damit 35 Watt höher als bei der Max-Q Version.

NVIDIA GeForce RTX 2080 Max-Q

► remove from comparison NVIDIA GeForce RTX 2080 Max-Q

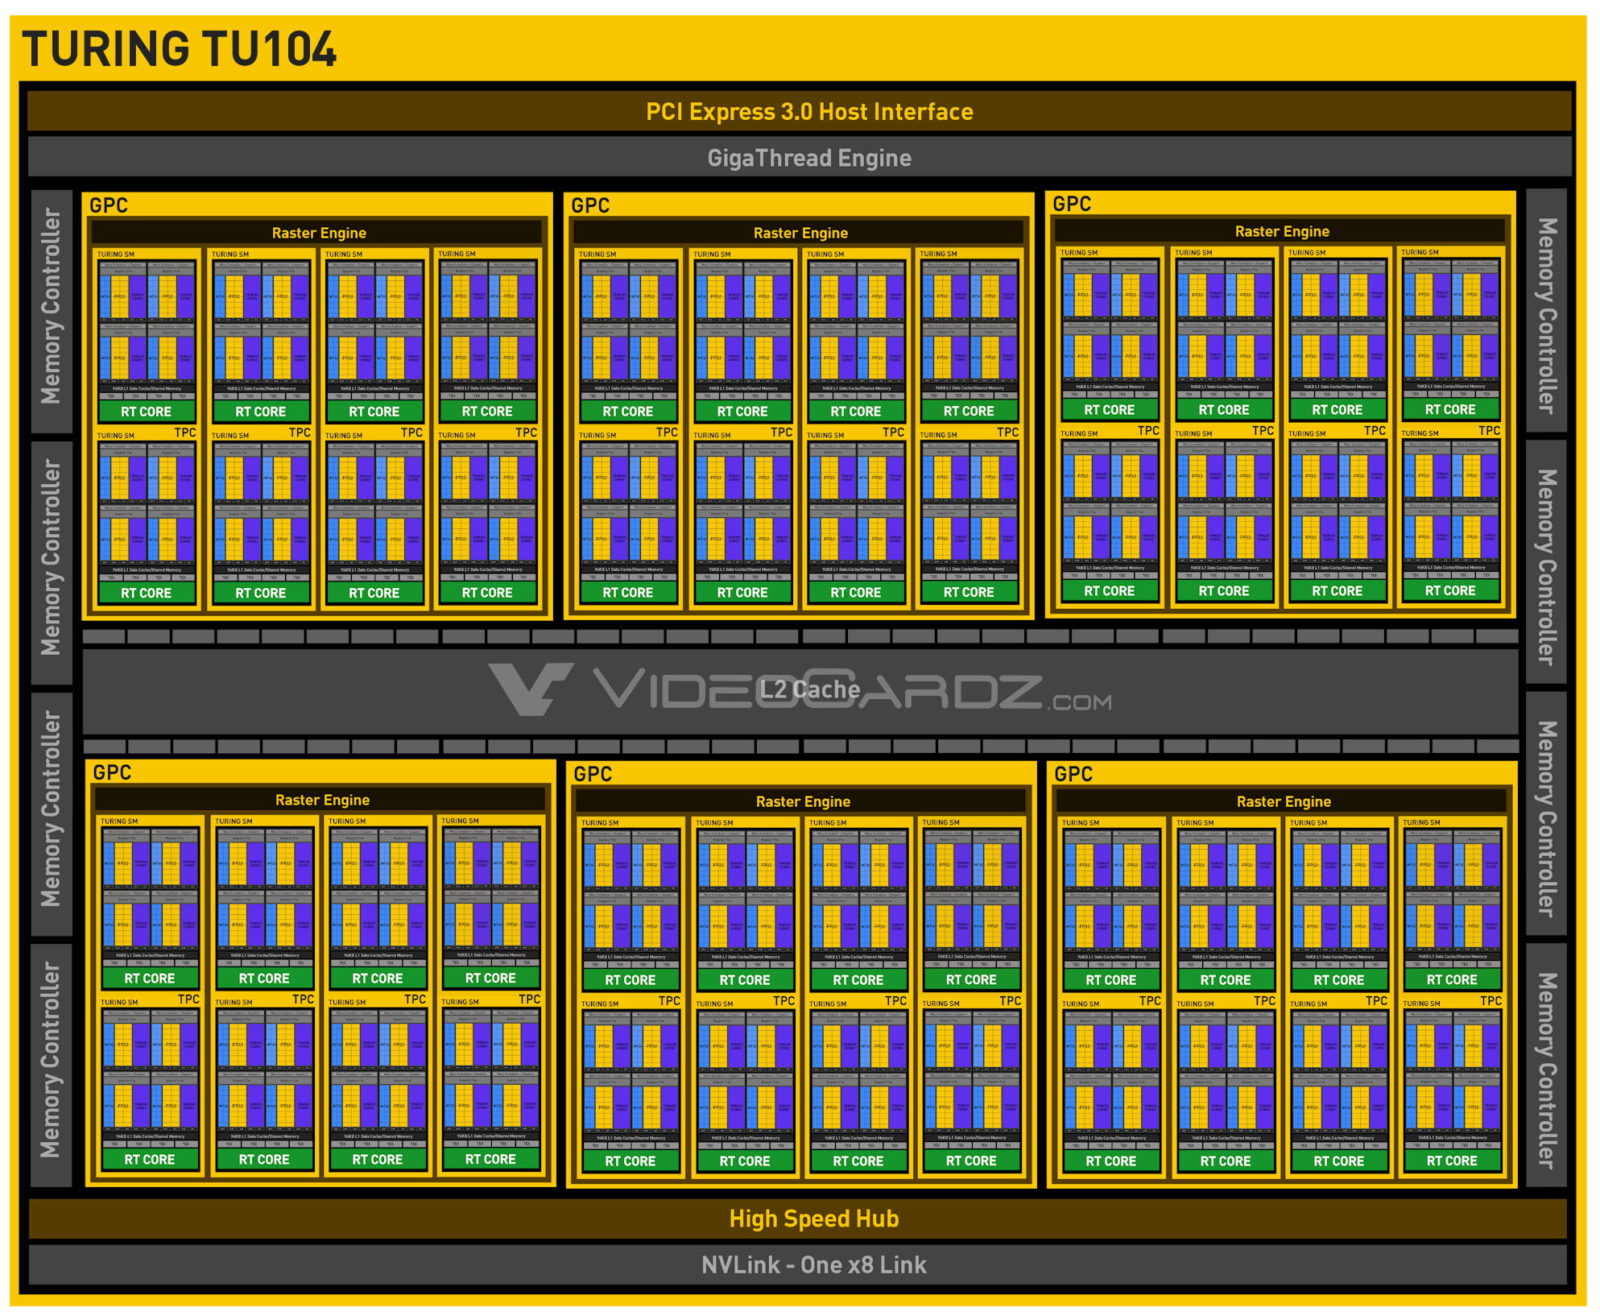
Die Nvidia GeForce RTX 2080 mit Max-Q Design ist eine mobile High-End-Grafikkarte der Turing-Serie. Sie ist gedacht für dünne und relativ leichte Gaming Laptops und wahrscheinlich etwa 10-15% langsamer als eine normale mobile RTX 2080 (wie bei der 10er Generation).

Anscheinend gibt es zwei Varianten der RTX 2080 Max-Q, eine mit 80 Watt TDP und 735 - 1095 MHz und eine schnellere mit 90 Watt TDP mit 990 - 1230 MHz Kerntakt (Basis - Boost). Beide Varianten takten mit 6 GHz den GDDR6 Speicher (im Vergleich zu 7 GHz bei der normalen RTX 2080).

Im Vergleich zur normalen GTX 1080 gibt es noch weitere Unterschiede als den Takt. Der Treiber wurde auf Effizienz (und nicht Leistung) optimiert (nur für die Max-Q Modelle), optimierte Spannungswandler für 1V Betreib, high-end Kühlungsmethoden und eine 40 dB Grenze für die Lüfterlautstärke (mit Taktanpasssungen um dies jederzeit zu gewährleisten) zeichnen die Max-Q Variante aus.

Features

Der TU104-Chip wird in 12nm gefertigt und bietet eine Reihe neuer Features, wie DLSS (Deep Learning Super Sampling) und Real Time Ray Tracing. Dadurch lassen sich vor allem Beleuchtungseffekte sehr viel realistischer darstellen. Weiterhin gibt es Support für DisplayPort 1.4 (ready), HDMI 2.0b, HDR, Simultaneous Multi-Projection (SMP) sowie H.265 Video De- und Encoding (PlayReady 3.0). 

Performance

Die Spieleleistung sollte leicht oberhalb der mobilen RTX 2070 liegen und deutlich unterhalb der normalen RTX 2080. Damit ist sie RTX2080 Max-Q die zweitschnellste mobile Grafikkarte und auch für 4K Gaming geeignet.

NVIDIA GeForce GTX 1050 Ti (Desktop)NVIDIA GeForce RTX 2070 MobileNVIDIA GeForce RTX 2080 Max-Q
GeForce RTX 2000 Serie
GeForce GTX 1080 Ti 3584 @ 1.48 - 1.6 GHz352 Bit @ 11000 MHz
GeForce GTX 1080 SLI (Laptop) 5120 @ 1.56 - 1.73 GHz256 Bit @ 10000 MHz
GeForce GTX 1070 SLI (Desktop) 3840 @ 1.51 - 1.68 GHz256 Bit @ 8000 MHz
GeForce GTX 1070 SLI (Laptop) 4096 @ 1.44 - 1.65 GHz256 Bit @ 8000 MHz
GeForce GTX 1080 (Desktop) 2560 @ 1.61 - 1.73 GHz256 Bit @ 10000 MHz
GeForce GTX 1080 Mobile 2560 @ 1.57 - 1.73 GHz256 Bit @ 10000 MHz
GeForce GTX 1070 Ti (Desktop) 2432 @ 1.61 - 1.68 GHz256 Bit @ 8000 MHz
GeForce GTX 1070 (Desktop) 1920 @ 1.51 - 1.68 GHz256 Bit @ 8000 MHz
GeForce GTX 1080 Max-Q 2560 @ 1.1 - 1.28 GHz256 Bit @ 10000 MHz
GeForce GTX 1070 Mobile 2048 @ 1.44 - 1.65 GHz256 Bit @ 8000 MHz
GeForce GTX 1070 Max-Q 2048 @ 1.1 - 1.27 GHz256 Bit @ 8000 MHz
GeForce GTX 1060 (Desktop) 1280 @ 1.51 - 1.71 GHz192 Bit @ 8000 MHz
GeForce GTX 1060 Mobile 1280 @ 1.4 - 1.67 GHz192 Bit @ 8000 MHz
GeForce GTX 1060 Max-Q 1280 @ 1.06 - 1.34 GHz192 Bit @ 8000 MHz
GeForce GTX 1050 Ti Mobile 768 @ 1.49 - 1.62 GHz128 Bit @ 7000 MHz
GeForce GTX 1050 Ti (Desktop) 768 @ 1.29 - 1.39 GHz128 Bit @ 7008 MHz
GeForce GTX 1050 Ti Max-Q 768 @ 1.15 - 1.29 GHz128 Bit @ 7000 MHz
GeForce GTX 1050 (Desktop) 640 @ 1.35 - 1.46 GHz128 Bit @ 7008 MHz
GeForce GTX 1050 Mobile 640 @ 1.35 - 1.49 GHz128 Bit @ 7000 MHz
GeForce GTX 1050 Max-Q 640 @ 1 - 1.14 GHz128 Bit @ 7000 MHz
GeForce GT 1030 (Desktop) 384 @ 1.23 - 1.67 GHz64 Bit @ 6000 MHz
NVIDIA Titan RTX 4608 @ 1.35 - 1.77 GHz384 Bit @ 14000 MHz
GeForce RTX 2080 Ti (Desktop) 4352 @ 1.35 - 1.55 GHz352 Bit @ 14000 MHz
GeForce RTX 2080 Super (Desktop) 3072 @ 1.65 - 1.82 GHz256 Bit @ 15500 MHz
GeForce RTX 2080 (Desktop) 2944 @ 1.52 - 1.71 GHz256 Bit @ 14000 MHz
GeForce RTX 2080 Super Mobile 3072 @ 1.37 - 1.56 GHz256 Bit @ 14000 MHz
GeForce RTX 2080 Mobile 2944 @ 1.38 - 1.59 GHz256 Bit @ 14000 MHz
GeForce RTX 2070 Super (Desktop) 2560 @ 1.61 - 1.77 GHz256 Bit @ 14000 MHz
GeForce RTX 2070 (Desktop) 2304 @ 1.41 - 1.62 GHz256 Bit @ 14000 MHz
GeForce RTX 2070 Super Mobile 2560 @ 1.14 - 1.38 GHz256 Bit @ 14002 MHz
GeForce RTX 2080 Super Max-Q 3072 @ 0.98 - 1.23 GHz256 Bit @ 11000 MHz
GeForce RTX 2060 Super (Desktop) 2176 @ 1.47 - 1.65 GHz256 Bit @ 14000 MHz
GeForce RTX 2070 Mobile 2304 @ 1.22 - 1.44 GHz256 Bit @ 14000 MHz
GeForce RTX 2080 Max-Q 2944 @ 0.74 - 1.1 GHz256 Bit @ 12000 MHz
GeForce RTX 2060 (Desktop) 1920 @ 1.32 - 1.62 GHz192 Bit @ 14000 MHz
GeForce RTX 2070 Super Max-Q 2560 @ 0.93 - 1.16 GHz256 Bit @ 11000 MHz
GeForce RTX 2070 Max-Q 2304 @ 0.89 - 1.19 GHz256 Bit @ 12000 MHz
GeForce RTX 2060 Mobile 1920 @ 0.96 - 1.2 GHz192 Bit @ 14000 MHz
GeForce RTX 2060 Max-Q 1920 @ 0.98 - 1.19 GHz192 Bit @ 11000 MHz
GeForce RTX 2050 Mobile 2048 @ 1.48 GHz64 Bit @ 14000 MHz
CodenameN17P-G1N18E-G2 TU106N18E-G3-A1 MAX-Q TU104
ArchitekturPascalTuringTuring
Pipelines768 - unified2304 - unified2944 - unified
Kerntakt1290 - 1392 (Boost) MHz1215 - 1440 (Boost) MHz735-990 - 1095-1230 (Boost) MHz
Speichertakt7008 MHz14000 MHz12000 MHz
Speicherbandbreite128 Bit256 Bit256 Bit
SpeichertypGDDR5GDDR6GDDR6
Max. Speichergröße4 GB8 GB8 GB
Shared Memoryneinneinnein
APIDirectX 12_1, OpenGL 4.5DirectX 12_1, OpenGL 4.6DirectX 12_1, OpenGL 4.6
Herstellungsprozess16 nm12 nm12 nm
FeaturesMulti-Projection, VR Ready, G-SYNC, Vulkan, Multi MonitorDLSS, Raytraycing, VR Ready, G-SYNC, Vulkan, Multi Monitor, 550 Watt system power recommendedNVLink, DLSS, Raytraycing, VR Ready, G-SYNC, Vulkan, Multi Monitor, 650 Watt system power recommended
Erscheinungsdatum25.10.2016 06.01.2019 06.01.2019
Stromverbrauch115 Watt80-90 Watt
Transistors10.8 Billion13.6 Billion
Notebookgrößegroß (17" z.B.)groß (17" z.B.)

Benchmarks

Performance Rating - 3DMark 11 + Fire Strike + Time Spy - GeForce RTX 2070 Mobile
9 pt (27%)
Performance Rating - 3DMark 11 + Fire Strike + Time Spy - GeForce RTX 2080 Max-Q
9.2 pt (28%)
3DMark - 3DMark Time Spy Score
min: 2474     avg: 2568     median: 2568 (7%)     max: 2662 Points
min: 6890     avg: 7537     median: 7499 (22%)     max: 8253 Points
min: 6399     avg: 7609     median: 7484 (22%)     max: 8604 Points
3DMark - 3DMark Time Spy Graphics
min: 2277     avg: 2309     median: 2308.5 (6%)     max: 2340 Points
min: 7006     avg: 7651     median: 7738 (20%)     max: 8028 Points
min: 6464     avg: 7903     median: 7923 (21%)     max: 8844 Points
3DMark - 3DMark Ice Storm Unlimited Graphics
352876 Points (36%)
min: 423684     avg: 445082     median: 444708 (45%)     max: 467230 Points
min: 364184     avg: 413236     median: 425550 (43%)     max: 444648 Points
3DMark - 3DMark Ice Storm Extreme Graphics
min: 150368     avg: 238420     median: 163308 (20%)     max: 401585 Points
min: 166342     avg: 280059     median: 342495 (43%)     max: 377016 Points
3DMark - 3DMark Cloud Gate Score
24195 Points (26%)
min: 25784     avg: 38327     median: 39206.5 (42%)     max: 50713 Points
min: 25513     avg: 35405     median: 34287 (37%)     max: 50705 Points
3DMark - 3DMark Cloud Gate Graphics
50939 Points (13%)
min: 64283     avg: 117543     median: 123004 (32%)     max: 135881 Points
min: 38256     avg: 111063     median: 117764 (31%)     max: 129506 Points
3DMark - 3DMark Fire Strike Standard Score
min: 6644     avg: 6783     median: 6816 (12%)     max: 6888 Points
min: 15686     avg: 17675     median: 17762 (31%)     max: 20183 Points
min: 15962     avg: 17836     median: 17504 (31%)     max: 22184 Points
3DMark - 3DMark Fire Strike Standard Graphics
min: 7293     avg: 7491     median: 7485 (8%)     max: 7696 Points
min: 18169     avg: 20123     median: 20392 (23%)     max: 21138 Points
min: 18048     avg: 20658     median: 20703 (23%)     max: 23032 Points
3DMark - 3DMark Ice Storm Graphics
min: 164562     avg: 304404     median: 303114 (35%)     max: 446824 Points
min: 69036     avg: 274353     median: 300340 (35%)     max: 419228 Points
3DMark - 3DMark Night Raid
36093 Points (34%)
39960 Points (38%)
3DMark - 3DMark Night Raid Graphics Score
64571 Points (25%)
90166 Points (35%)
3DMark 11 - 3DM11 Performance Score
min: 9151     avg: 9481     median: 9480.5 (13%)     max: 9810 Points
min: 17817     avg: 20620     median: 20935 (29%)     max: 23447 Points
min: 19220     avg: 21052     median: 21067 (29%)     max: 23774 Points
3DMark 11 - 3DM11 Performance GPU
min: 9212     avg: 9453     median: 9453 (8%)     max: 9694 Points
min: 23335     avg: 25775     median: 26005 (22%)     max: 27298 Points
min: 23386     avg: 27852     median: 27973 (24%)     max: 30910 Points
3DMark Vantage
3DM Vant. Perf. total + NVIDIA GeForce RTX 2070 Mobile
3DMark Vantage - 3DM Vant. Perf. total
64151 Points (19%)
3DM Vant. Perf. total + NVIDIA GeForce RTX 2080 Max-Q
51930 Points (15%)
3DM Vant. Perf. GPU no PhysX + NVIDIA GeForce RTX 2070 Mobile
3DMark Vantage - 3DM Vant. Perf. GPU no PhysX
68082 Points (37%)
3DM Vant. Perf. GPU no PhysX + NVIDIA GeForce RTX 2080 Max-Q
60439 Points (33%)
3DMark 06 3DMark 06 - Standard 1280x1024 + NVIDIA GeForce GTX 1050 Ti (Desktop)
3DMark 06
min: 36277     avg: 38484     median: 38483.5 (50%)     max: 40690 Points
3DMark 06 - Standard 1280x1024 + NVIDIA GeForce RTX 2070 Mobile
min: 39513     avg: 42028     median: 42409.5 (55%)     max: 43781 Points
3DMark 06 - Standard 1280x1024 + NVIDIA GeForce RTX 2080 Max-Q
min: 36228     avg: 37369     median: 37613 (49%)     max: 38435 Points
Unigine Valley 1.0 - Unigine Valley 1.0 DX
40.7 fps (13%)
SPECviewperf 12
specvp12 sw-03 + NVIDIA GeForce RTX 2080 Max-Q
SPECviewperf 12 - specvp12 sw-03
69.5 fps (17%)
specvp12 snx-02 + NVIDIA GeForce RTX 2080 Max-Q
SPECviewperf 12 - specvp12 snx-02
11.4 fps (2%)
specvp12 showcase-01 + NVIDIA GeForce RTX 2080 Max-Q
SPECviewperf 12 - specvp12 showcase-01
95.6 fps (21%)
specvp12 mediacal-01 + NVIDIA GeForce RTX 2080 Max-Q
SPECviewperf 12 - specvp12 mediacal-01
39.7 fps (10%)
specvp12 maya-04 + NVIDIA GeForce RTX 2080 Max-Q
SPECviewperf 12 - specvp12 maya-04
153.4 fps (42%)
specvp12 energy-01 + NVIDIA GeForce RTX 2080 Max-Q
SPECviewperf 12 - specvp12 energy-01
8.9 fps (8%)
specvp12 creo-01 + NVIDIA GeForce RTX 2080 Max-Q
SPECviewperf 12 - specvp12 creo-01
52.2 fps (21%)
specvp12 catia-04 + NVIDIA GeForce RTX 2080 Max-Q
SPECviewperf 12 - specvp12 catia-04
90.2 fps (15%)
specvp12 3dsmax-05 + NVIDIA GeForce RTX 2080 Max-Q
SPECviewperf 12 - specvp12 3dsmax-05
174.7 fps (31%)
SPECviewperf 13 specvp13 sw-04 + NVIDIA GeForce RTX 2070 Mobile
SPECviewperf 13 - specvp13 sw-04
81.2 fps (22%)
specvp13 sw-04 + NVIDIA GeForce RTX 2080 Max-Q
89.3 fps (24%)
specvp13 snx-03 + NVIDIA GeForce RTX 2070 Mobile
SPECviewperf 13 - specvp13 snx-03
15.6 fps (2%)
specvp13 snx-03 + NVIDIA GeForce RTX 2080 Max-Q
20.3 fps (2%)
specvp13 showcase-02 + NVIDIA GeForce RTX 2070 Mobile
SPECviewperf 13 - specvp13 showcase-02
101.5 fps (22%)
specvp13 showcase-02 + NVIDIA GeForce RTX 2080 Max-Q
95.5 fps (21%)
specvp13 medical-02 + NVIDIA GeForce RTX 2070 Mobile
SPECviewperf 13 - specvp13 medical-02
52.2 fps (11%)
specvp13 medical-02 + NVIDIA GeForce RTX 2080 Max-Q
55.9 fps (12%)
specvp13 maya-05 + NVIDIA GeForce RTX 2070 Mobile
SPECviewperf 13 - specvp13 maya-05
253.4 fps (29%)
specvp13 maya-05 + NVIDIA GeForce RTX 2080 Max-Q
256 fps (29%)
specvp13 energy-02 + NVIDIA GeForce RTX 2070 Mobile
SPECviewperf 13 - specvp13 energy-02
20.2 fps (7%)
specvp13 energy-02 + NVIDIA GeForce RTX 2080 Max-Q
16 fps (5%)
specvp13 creo-02 + NVIDIA GeForce RTX 2070 Mobile
SPECviewperf 13 - specvp13 creo-02
172.3 fps (25%)
specvp13 creo-02 + NVIDIA GeForce RTX 2080 Max-Q
177.1 fps (26%)
specvp13 catia-05 + NVIDIA GeForce RTX 2070 Mobile
SPECviewperf 13 - specvp13 catia-05
108.6 fps (12%)
specvp13 catia-05 + NVIDIA GeForce RTX 2080 Max-Q
128 fps (14%)
specvp13 3dsmax-06 + NVIDIA GeForce RTX 2070 Mobile
SPECviewperf 13 - specvp13 3dsmax-06
173.2 fps (30%)
specvp13 3dsmax-06 + NVIDIA GeForce RTX 2080 Max-Q
176.5 fps (31%)
Cinebench R10 Cinebench R10 Shading (32bit) + NVIDIA GeForce RTX 2070 Mobile
Cinebench R10 - Cinebench R10 Shading (32bit)
min: 3561     avg: 10562     median: 13457 (10%)     max: 14667 Points
Cinebench R10 Shading (32bit) + NVIDIA GeForce RTX 2080 Max-Q
min: 6820     avg: 9275     median: 8197.5 (6%)     max: 13884 Points
Cinebench R11.5 Cinebench R11.5 OpenGL 64 Bit + NVIDIA GeForce RTX 2070 Mobile
Cinebench R11.5 - Cinebench R11.5 OpenGL 64 Bit
min: 78.7     avg: 82.3     median: 82.3 (27%)     max: 85.8 fps
Cinebench R11.5 OpenGL 64 Bit + NVIDIA GeForce RTX 2080 Max-Q
min: 73.1     avg: 77.2     median: 78.4 (26%)     max: 80 fps
Cinebench R15
Cinebench R15 OpenGL 64 Bit + NVIDIA GeForce GTX 1050 Ti (Desktop)
Cinebench R15 - Cinebench R15 OpenGL 64 Bit
min: 134.7     avg: 150.4     median: 150.4 (9%)     max: 166 fps
Cinebench R15 OpenGL 64 Bit + NVIDIA GeForce RTX 2070 Mobile
min: 91.9     avg: 131.1     median: 133 (8%)     max: 186 fps
Cinebench R15 OpenGL 64 Bit + NVIDIA GeForce RTX 2080 Max-Q
min: 107.8     avg: 120.4     median: 119.7 (7%)     max: 138.6 fps
Cinebench R15 OpenGL Ref. Match 64 Bit + NVIDIA GeForce GTX 1050 Ti (Desktop)
Cinebench R15 - Cinebench R15 OpenGL Ref. Match 64 Bit
min: 99.6     avg: 99.8     median: 99.8 (100%)     max: 100 %
Cinebench R15 OpenGL Ref. Match 64 Bit + NVIDIA GeForce RTX 2070 Mobile
min: 99.2     avg: 99.6     median: 99.6 (100%)     max: 99.6 %
Cinebench R15 OpenGL Ref. Match 64 Bit + NVIDIA GeForce RTX 2080 Max-Q
GFXBench - GFXBench Car Chase Offscreen
329 fps (37%)
326 fps (37%)
LuxMark v2.0 64Bit - LuxMark v2.0 Room GPU
1175 Samples/s (5%)
3171 Samples/s (14%)
2006 Samples/s (9%)
LuxMark v2.0 64Bit - LuxMark v2.0 Sala GPU
2156 Samples/s (4%)
6570 Samples/s (12%)
5110 Samples/s (9%)
ComputeMark v2.1 - ComputeMark v2.1 Result
5493 Points (6%)
14446 Points (16%)
14673 Points (16%)
Power Consumption - Furmark Stress Test Power Consumption - external Monitor *
164 Watt (23%)
129 Watt (18%)
Power Consumption - The Witcher 3 Power Consumption - external Monitor *
155 Watt (22%)
131 Watt (18%)
Power Consumption - Witcher 3 Power Consumption *
99.5 Watt (22%)
min: 172     avg: 190.2     median: 186.9 (41%)     max: 238 Watt
min: 130     avg: 161.4     median: 161 (35%)     max: 185.8 Watt
Power Consumption - Witcher 3 ultra Power Efficiency
0.2 fps per Watt (22%)
min: 0.313     avg: 0.4     median: 0.4 (36%)     max: 0.4438 fps per Watt
min: 0.4198     avg: 0.5     median: 0.5 (44%)     max: 0.534 fps per Watt
Power Consumption - Witcher 3 ultra Power Efficiency - external Monitor
0.2 fps per Watt (15%)
0.6 fps per Watt (50%)
Emissions Witcher 3 Fan Noise + NVIDIA GeForce GTX 1050 Ti (Desktop)
Emissions - Witcher 3 Fan Noise
42 dB(A) (67%)
Witcher 3 Fan Noise + NVIDIA GeForce RTX 2070 Mobile
min: 49     avg: 53.5     median: 53.5 (86%)     max: 62 dB(A)
Witcher 3 Fan Noise + NVIDIA GeForce RTX 2080 Max-Q
min: 40.5     avg: 48     median: 48 (77%)     max: 56.6 dB(A)
Clock Speed - GPU Clock Witcher 3 ultra
min: 1395     avg: 1487     median: 1470 (58%)     max: 1650 MHz
min: 915     avg: 1241     median: 1260 (49%)     max: 1455 MHz
Clock Speed - GPU Clock Speed Furmark
1125 MHz (45%)
1003 MHz (40%)

Average Benchmarks NVIDIA GeForce GTX 1050 Ti (Desktop) → 100% n=15

Average Benchmarks NVIDIA GeForce RTX 2070 Mobile → 221% n=15

Average Benchmarks NVIDIA GeForce RTX 2080 Max-Q → 209% n=15

- Bereich der Benchmarkergebnisse für diese Grafikkarte
- Durchschnittliche Benchmarkergebnisse für diese Grafikkarte
* Smaller numbers mean a higher performance
1 This benchmark is not used for the average calculation

Spiele-Benchmarks

Die folgenden Benchmarks basieren auf unseren Spieletests mit Testnotebooks. Die Performance dieser Grafikkarte bei den gelisteten Spielen ist abhängig von der verwendeten CPU, Speicherausstattung, Treiber und auch Betriebssystem. Dadurch müssen die untenstehenden Werte nicht repräsentativ sein. Detaillierte Informationen über das verwendete System sehen Sie nach einem Klick auf den fps-Wert.

med. 1920x1080
100%
GeForce GTX 1050 Ti (Desktop):
13  fps
low 1920x1080
100%
GeForce GTX 1050 Ti (Desktop):
31  fps
ultra 1920x1080
100%
GeForce GTX 1050 Ti (Desktop):
18  fps
QHD 2560x1440
100%
GeForce GTX 1050 Ti (Desktop):
11  fps
4K 3840x2160
100%
GeForce GTX 1050 Ti (Desktop):
7  fps
F1 22

F1 22

2022
low 1920x1080
100%
GeForce GTX 1050 Ti (Desktop):
86.5  fps
med. 1920x1080
100%
GeForce GTX 1050 Ti (Desktop):
75.3  fps
high 1920x1080
100%
GeForce GTX 1050 Ti (Desktop):
52.5  fps
low 1280x720
100%
GeForce GTX 1050 Ti (Desktop):
65  fps
ultra 1920x1080
100%
GeForce GTX 1050 Ti (Desktop):
23.3  fps
QHD 2560x1440
100%
GeForce GTX 1050 Ti (Desktop):
15.8  fps
4K 3840x2160
100%
GeForce GTX 1050 Ti (Desktop):
7.7  fps
low 1280x720
100%
GeForce GTX 1050 Ti (Desktop):
55  fps
med. 1920x1080
100%
GeForce GTX 1050 Ti (Desktop):
37  fps
high 1920x1080
100%
GeForce GTX 1050 Ti (Desktop):
36  fps
ultra 1920x1080
100%
GeForce GTX 1050 Ti (Desktop):
35  fps
QHD 2560x1440
100%
GeForce GTX 1050 Ti (Desktop):
24  fps
4K 3840x2160
100%
GeForce GTX 1050 Ti (Desktop):
11  fps
F1 2021

F1 2021

2021
low 1280x720
100%
GeForce GTX 1050 Ti (Desktop):
185  fps
med. 1920x1080
100%
GeForce GTX 1050 Ti (Desktop):
88.8  fps
169%
GeForce RTX 2070 Mobile:
150  fps
high 1920x1080
100%
GeForce GTX 1050 Ti (Desktop):
71.7  fps
194%
GeForce RTX 2070 Mobile:
139  fps
ultra 1920x1080
GeForce RTX 2070 Mobile:
82  fps
QHD 2560x1440
GeForce RTX 2070 Mobile:
63  fps
4K 3840x2160
GeForce RTX 2070 Mobile:
34  fps
Days Gone

Days Gone

2021
med. 1920x1080
GeForce RTX 2070 Mobile:
115  fps
high 1920x1080
GeForce RTX 2070 Mobile:
101  fps
ultra 1920x1080
GeForce RTX 2070 Mobile:
74.9  fps
QHD 2560x1440
GeForce RTX 2070 Mobile:
55.4  fps
4K 3840x2160
GeForce RTX 2070 Mobile:
31.9  fps
low 1280x720
GeForce RTX 2070 Mobile:
116  fps
ultra 1920x1080
GeForce RTX 2070 Mobile:
112  fps
QHD 2560x1440
GeForce RTX 2070 Mobile:
106  fps
4K 3840x2160
GeForce RTX 2070 Mobile:
74  fps
med. 1920x1080
GeForce RTX 2070 Mobile:
126  fps
high 1920x1080
GeForce RTX 2070 Mobile:
126  fps
ultra 1920x1080
GeForce RTX 2070 Mobile:
110  fps
Outriders

Outriders

2021
med. 1920x1080
GeForce RTX 2070 Mobile:
106  fps
high 1920x1080
GeForce RTX 2070 Mobile:
94.3  fps
ultra 1920x1080
GeForce RTX 2070 Mobile:
81.7  fps
QHD 2560x1440
GeForce RTX 2070 Mobile:
60.5  fps
4K 3840x2160
GeForce RTX 2070 Mobile:
32.8  fps
Hitman 3

Hitman 3

2021
med. 1920x1080
GeForce RTX 2070 Mobile:
136  fps
high 1920x1080
GeForce RTX 2070 Mobile:
124  fps
ultra 1920x1080
GeForce RTX 2070 Mobile:
113  fps
QHD 2560x1440
GeForce RTX 2070 Mobile:
77.1  fps
4K 3840x2160
GeForce RTX 2070 Mobile:
41.4  fps
low 1280x720
100%
GeForce GTX 1050 Ti (Desktop):
41.3  fps
med. 1920x1080
100%
GeForce GTX 1050 Ti (Desktop):
21.3  fps
356%
GeForce RTX 2070 Mobile:
75.8  fps
high 1920x1080
100%
GeForce GTX 1050 Ti (Desktop):
17  fps
364%
GeForce RTX 2070 Mobile:
61.9  fps
ultra 1920x1080
GeForce RTX 2070 Mobile:
52.9  fps
QHD 2560x1440
GeForce RTX 2070 Mobile:
34.5  fps
4K 3840x2160
GeForce RTX 2070 Mobile:
16.3  fps
med. 1920x1080
GeForce RTX 2070 Mobile:
82  fps
high 1920x1080
GeForce RTX 2070 Mobile:
72  fps
ultra 1920x1080
GeForce RTX 2070 Mobile:
67  fps
QHD 2560x1440
GeForce RTX 2070 Mobile:
55  fps
4K 3840x2160
GeForce RTX 2070 Mobile:
36  fps
med. 1920x1080
GeForce RTX 2070 Mobile:
100  fps
high 1920x1080
GeForce RTX 2070 Mobile:
95.6  fps
ultra 1920x1080
GeForce RTX 2070 Mobile:
80.3  fps
QHD 2560x1440
GeForce RTX 2070 Mobile:
55.5  fps
4K 3840x2160
GeForce RTX 2070 Mobile:
28.6  fps
med. 1920x1080
GeForce RTX 2070 Mobile:
94.9  fps
high 1920x1080
GeForce RTX 2070 Mobile:
80.7  fps
ultra 1920x1080
GeForce RTX 2070 Mobile:
72.5  fps
QHD 2560x1440
GeForce RTX 2070 Mobile:
51.7  fps
4K 3840x2160
GeForce RTX 2070 Mobile:
27.7  fps
med. 1920x1080
GeForce RTX 2070 Mobile:
81  fps
high 1920x1080
GeForce RTX 2070 Mobile:
69  fps
ultra 1920x1080
GeForce RTX 2070 Mobile:
59  fps
QHD 2560x1440
GeForce RTX 2070 Mobile:
47  fps
4K 3840x2160
GeForce RTX 2070 Mobile:
28  fps
Dirt 5

Dirt 5

2020
med. 1920x1080
GeForce RTX 2070 Mobile:
88.2  fps
high 1920x1080
GeForce RTX 2070 Mobile:
69.4  fps
ultra 1920x1080
GeForce RTX 2070 Mobile:
41.3  fps
QHD 2560x1440
GeForce RTX 2070 Mobile:
35.3  fps
4K 3840x2160
GeForce RTX 2070 Mobile:
26.3  fps
med. 1920x1080
GeForce RTX 2070 Mobile:
93.1  fps
high 1920x1080
GeForce RTX 2070 Mobile:
81.6  fps
ultra 1920x1080
GeForce RTX 2070 Mobile:
56.1  fps
QHD 2560x1440
GeForce RTX 2070 Mobile:
41.6  fps
4K 3840x2160
GeForce RTX 2070 Mobile:
23.4  fps
FIFA 21

FIFA 21

2020
low 1280x720
GeForce RTX 2070 Mobile:
225  fps
med. 1920x1080
GeForce RTX 2070 Mobile:
223  fps
high 1920x1080
GeForce RTX 2070 Mobile:
211  fps
ultra 1920x1080
GeForce RTX 2070 Mobile:
210  fps
QHD 2560x1440
GeForce RTX 2070 Mobile:
206  fps
4K 3840x2160
GeForce RTX 2070 Mobile:
173  fps
low 1280x720
GeForce RTX 2070 Mobile:
265  fps
med. 1920x1080
GeForce RTX 2070 Mobile:
234  fps
high 1920x1080
GeForce RTX 2070 Mobile:
228  fps
ultra 1920x1080
GeForce RTX 2070 Mobile:
214  fps
QHD 2560x1440
GeForce RTX 2070 Mobile:
140  fps
4K 3840x2160
GeForce RTX 2070 Mobile:
78  fps
low 1280x720
GeForce RTX 2070 Mobile:
133  fps
med. 1920x1080
GeForce RTX 2070 Mobile:
98.1  fps
high 1920x1080
GeForce RTX 2070 Mobile:
89.6  fps
QHD 2560x1440
GeForce RTX 2070 Mobile:
60.5  fps
4K 3840x2160
GeForce RTX 2070 Mobile:
30.6  fps
low 1280x720
GeForce RTX 2070 Mobile:
119  fps
med. 1920x1080
GeForce RTX 2070 Mobile:
73.9  fps
high 1920x1080
GeForce RTX 2070 Mobile:
71.4  fps
ultra 1920x1080
GeForce RTX 2070 Mobile:
61.3  fps
QHD 2560x1440
GeForce RTX 2070 Mobile:
54.5  fps
med. 1920x1080
GeForce RTX 2070 Mobile:
133  fps
high 1920x1080
GeForce RTX 2070 Mobile:
70.8  fps
ultra 1920x1080
GeForce RTX 2070 Mobile:
50.2  fps
QHD 2560x1440
GeForce RTX 2070 Mobile:
32.6  fps
4K 3840x2160
GeForce RTX 2070 Mobile:
20.3  fps
low 1280x720
100%
GeForce GTX 1050 Ti (Desktop):
56.1  fps
126%
GeForce RTX 2070 Mobile:
70.6  fps
med. 1920x1080
100%
GeForce GTX 1050 Ti (Desktop):
25.6  fps
235%
GeForce RTX 2070 Mobile:
60.1  fps
high 1920x1080
100%
GeForce GTX 1050 Ti (Desktop):
18.1  fps
270%
GeForce RTX 2070 Mobile:
48.9  fps
ultra 1920x1080
100%
GeForce GTX 1050 Ti (Desktop):
12.1  fps
292%
GeForce RTX 2070 Mobile:
35.3  fps
QHD 2560x1440
100%
GeForce GTX 1050 Ti (Desktop):
8.6  fps
312%
GeForce RTX 2070 Mobile:
26.8  fps
4K 3840x2160
GeForce RTX 2070 Mobile:
16.3  fps
low 1280x720
GeForce RTX 2070 Mobile:
131  fps
med. 1920x1080
GeForce RTX 2070 Mobile:
100  fps
high 1920x1080
GeForce RTX 2070 Mobile:
85  fps
ultra 1920x1080
GeForce RTX 2070 Mobile:
67  fps
QHD 2560x1440
GeForce RTX 2070 Mobile:
51  fps
4K 3840x2160
GeForce RTX 2070 Mobile:
29  fps
low 1280x720
GeForce RTX 2070 Mobile:
149.3 156 ~ 153 fps
med. 1920x1080
GeForce RTX 2070 Mobile:
125 126 ~ 126 fps
high 1920x1080
GeForce RTX 2070 Mobile:
114.6 115 ~ 115 fps
ultra 1920x1080
GeForce RTX 2070 Mobile:
112 113 ~ 113 fps
QHD 2560x1440
GeForce RTX 2070 Mobile:
78.8  fps
4K 3840x2160
GeForce RTX 2070 Mobile:
42.6  fps
F1 2020

F1 2020

2020
low 1280x720
GeForce RTX 2070 Mobile:
182 230 ~ 206 fps
med. 1920x1080
GeForce RTX 2070 Mobile:
155 177 ~ 166 fps
high 1920x1080
GeForce RTX 2070 Mobile:
146 148 ~ 147 fps
ultra 1920x1080
100%
GeForce GTX 1050 Ti (Desktop):
44.7  fps
255%
GeForce RTX 2070 Mobile:
112 115 ~ 114 fps
QHD 2560x1440
100%
GeForce GTX 1050 Ti (Desktop):
32.3  fps
269%
GeForce RTX 2070 Mobile:
87  fps
4K 3840x2160
100%
GeForce GTX 1050 Ti (Desktop):
17.6  fps
284%
GeForce RTX 2070 Mobile:
50  fps
Valorant

Valorant

2020
low 1280x720
GeForce RTX 2070 Mobile:
237  fps
med. 1920x1080
GeForce RTX 2070 Mobile:
234  fps
high 1920x1080
GeForce RTX 2070 Mobile:
230  fps
QHD 2560x1440
GeForce RTX 2070 Mobile:
229  fps
4K 3840x2160
GeForce RTX 2070 Mobile:
202  fps
low 1280x720
100%
GeForce GTX 1050 Ti (Desktop):
200  fps
119%
GeForce RTX 2070 Mobile:
226.5 248 ~ 237 fps
med. 1920x1080
100%
GeForce GTX 1050 Ti (Desktop):
71.7  fps
245%
GeForce RTX 2070 Mobile:
169.9 182 ~ 176 fps
high 1920x1080
100%
GeForce GTX 1050 Ti (Desktop):
44.3   fps
273%
GeForce RTX 2070 Mobile:
115.2 119 128 ~ 121 fps
ultra 1920x1080
100%
GeForce GTX 1050 Ti (Desktop):
32.6  fps
267%
GeForce RTX 2070 Mobile:
85 85.8 90.9 ~ 87 fps
QHD 2560x1440
100%
GeForce GTX 1050 Ti (Desktop):
20.6  fps
291%
GeForce RTX 2070 Mobile:
59.9  fps
4K 3840x2160
GeForce RTX 2070 Mobile:
31.6  fps
low 1280x720
100%
GeForce GTX 1050 Ti (Desktop):
101  fps
236%
GeForce RTX 2070 Mobile:
217.6 259 ~ 238 fps
154%
GeForce RTX 2080 Max-Q:
156  fps
med. 1920x1080
100%
GeForce GTX 1050 Ti (Desktop):
62.9  fps
270%
GeForce RTX 2070 Mobile:
162 177 ~ 170 fps
223%
GeForce RTX 2080 Max-Q:
140  fps
high 1920x1080
100%
GeForce GTX 1050 Ti (Desktop):
55.5  fps
281%
GeForce RTX 2070 Mobile:
148.9 157 161 ~ 156 fps
249%
GeForce RTX 2080 Max-Q:
138  fps
ultra 1920x1080
100%
GeForce GTX 1050 Ti (Desktop):
52.9  fps
287%
GeForce RTX 2070 Mobile:
145.1 154 157 ~ 152 fps
253%
GeForce RTX 2080 Max-Q:
134  fps
QHD 2560x1440
100%
GeForce GTX 1050 Ti (Desktop):
39.3  fps
265%
GeForce RTX 2070 Mobile:
104  fps
4K 3840x2160
GeForce RTX 2070 Mobile:
54.7  fps
low 1280x720
100%
GeForce GTX 1050 Ti (Desktop):
109  fps
179%
GeForce RTX 2070 Mobile:
184.2 205 ~ 195 fps
169%
GeForce RTX 2080 Max-Q:
184  fps
med. 1920x1080
100%
GeForce GTX 1050 Ti (Desktop):
41.6  fps
298%
GeForce RTX 2070 Mobile:
123 124 ~ 124 fps
322%
GeForce RTX 2080 Max-Q:
134  fps
high 1920x1080
100%
GeForce GTX 1050 Ti (Desktop):
33.5  fps
307%
GeForce RTX 2070 Mobile:
101 101.7 105 ~ 103 fps
361%
GeForce RTX 2080 Max-Q:
121  fps
QHD 2560x1440
GeForce RTX 2070 Mobile:
65.8  fps
4K 3840x2160
GeForce RTX 2070 Mobile:
31.3  fps
low 1280x720
GeForce RTX 2070 Mobile:
121  fps
GeForce RTX 2080 Max-Q:
121  fps
med. 1920x1080
GeForce RTX 2070 Mobile:
121  fps
GeForce RTX 2080 Max-Q:
121  fps
high 1920x1080
100%
GeForce GTX 1050 Ti (Desktop):
50.9  fps
236%
GeForce RTX 2070 Mobile:
119 120 ~ 120 fps
236%
GeForce RTX 2080 Max-Q:
120  fps
ultra 1920x1080
100%
GeForce GTX 1050 Ti (Desktop):
40.2  fps
276%
GeForce RTX 2070 Mobile:
104 118 ~ 111 fps
291%
GeForce RTX 2080 Max-Q:
117  fps
QHD 2560x1440
100%
GeForce GTX 1050 Ti (Desktop):
32.4  fps
243%
GeForce RTX 2070 Mobile:
78.8  fps
4K 3840x2160
GeForce RTX 2070 Mobile:
37.8  fps
low 1280x720
100%
GeForce GTX 1050 Ti (Desktop):
75  fps
163%
GeForce RTX 2070 Mobile:
117 127.9 ~ 122 fps
161%
GeForce RTX 2080 Max-Q:
121  fps
med. 1920x1080
100%
GeForce GTX 1050 Ti (Desktop):
34.8  fps
282%
GeForce RTX 2070 Mobile:
97.5 99.2 ~ 98 fps
295%
GeForce RTX 2080 Max-Q:
102.6  fps
high 1920x1080
100%
GeForce GTX 1050 Ti (Desktop):
22.3  fps
300%
GeForce RTX 2070 Mobile:
66.4 66.8 67.4 ~ 67 fps
326%
GeForce RTX 2080 Max-Q:
72.8  fps
ultra 1920x1080
100%
GeForce GTX 1050 Ti (Desktop):
14.3  fps
301%
GeForce RTX 2070 Mobile:
42.4 42.6 43 ~ 43 fps
319%
GeForce RTX 2080 Max-Q:
45.6  fps
QHD 2560x1440
GeForce RTX 2070 Mobile:
35  fps
4K 3840x2160
GeForce RTX 2070 Mobile:
22.9  fps
med. 1920x1080
GeForce RTX 2070 Mobile:
106  fps
GeForce RTX 2080 Max-Q:
94.5  fps
high 1920x1080
GeForce RTX 2070 Mobile:
92.2 98.7 ~ 95 fps
GeForce RTX 2080 Max-Q:
84.2  fps
ultra 1920x1080
GeForce RTX 2070 Mobile:
90.7 93 ~ 92 fps
GeForce RTX 2080 Max-Q:
82.3  fps
QHD 2560x1440
GeForce RTX 2070 Mobile:
73.4  fps
4K 3840x2160
GeForce RTX 2070 Mobile:
37.3  fps
low 1280x720
GeForce RTX 2070 Mobile:
104  fps
GeForce RTX 2080 Max-Q:
85.6  fps
med. 1920x1080
GeForce RTX 2070 Mobile:
94.2  fps
GeForce RTX 2080 Max-Q:
66  fps
high 1920x1080
GeForce RTX 2070 Mobile:
83.5 88 ~ 86 fps
GeForce RTX 2080 Max-Q:
63.6  fps
ultra 1920x1080
GeForce RTX 2070 Mobile:
78.1 78.3 ~ 78 fps
GeForce RTX 2080 Max-Q:
57.2  fps
QHD 2560x1440
GeForce RTX 2070 Mobile:
63.9  fps
4K 3840x2160
GeForce RTX 2070 Mobile:
37.5  fps
low 1280x720
GeForce RTX 2070 Mobile:
199  fps
GeForce RTX 2080 Max-Q:
171.5  fps
med. 1920x1080
GeForce RTX 2070 Mobile:
132  fps
GeForce RTX 2080 Max-Q:
126.7  fps
high 1920x1080
100%
GeForce GTX 1050 Ti (Desktop):
43.2  fps
282%
GeForce RTX 2070 Mobile:
113 130 ~ 122 fps
243%
GeForce RTX 2080 Max-Q:
104.9  fps
ultra 1920x1080
100%
GeForce GTX 1050 Ti (Desktop):
33.9  fps
292%
GeForce RTX 2070 Mobile:
92.9 105 ~ 99 fps
267%
GeForce RTX 2080 Max-Q:
90.6  fps
QHD 2560x1440
100%
GeForce GTX 1050 Ti (Desktop):
24  fps
314%
GeForce RTX 2070 Mobile:
75.4  fps
4K 3840x2160
GeForce RTX 2070 Mobile:
42.5  fps
GRID 2019

GRID 2019

2019
low 1280x720
GeForce RTX 2070 Mobile:
187  fps
GeForce RTX 2080 Max-Q:
213.5  fps
med. 1920x1080
GeForce RTX 2070 Mobile:
152  fps
GeForce RTX 2080 Max-Q:
187.6  fps
high 1920x1080
GeForce RTX 2070 Mobile:
104 124 ~ 114 fps
GeForce RTX 2080 Max-Q:
120.7  fps
ultra 1920x1080
GeForce RTX 2070 Mobile:
75.4 83.5 ~ 79 fps
GeForce RTX 2080 Max-Q:
81.3  fps
QHD 2560x1440
GeForce RTX 2070 Mobile:
66  fps
4K 3840x2160
GeForce RTX 2070 Mobile:
39.3  fps
low 1280x720
GeForce RTX 2070 Mobile:
122  fps
GeForce RTX 2080 Max-Q:
105  fps
med. 1920x1080
GeForce RTX 2070 Mobile:
106  fps
GeForce RTX 2080 Max-Q:
95  fps
high 1920x1080
GeForce RTX 2070 Mobile:
89 98 ~ 94 fps
GeForce RTX 2080 Max-Q:
92  fps
ultra 1920x1080
GeForce RTX 2070 Mobile:
67 71 ~ 69 fps
GeForce RTX 2080 Max-Q:
71  fps
QHD 2560x1440
GeForce RTX 2070 Mobile:
52  fps
4K 3840x2160
GeForce RTX 2070 Mobile:
29  fps
FIFA 20

FIFA 20

2019
low 1280x720
GeForce RTX 2070 Mobile:
265  fps
GeForce RTX 2080 Max-Q:
214.6  fps
med. 1920x1080
GeForce RTX 2070 Mobile:
260  fps
GeForce RTX 2080 Max-Q:
208.1  fps
high 1920x1080
GeForce RTX 2070 Mobile:
190 240 ~ 215 fps
GeForce RTX 2080 Max-Q:
197.7  fps
ultra 1920x1080
100%
GeForce GTX 1050 Ti (Desktop):
141  fps
152%
GeForce RTX 2070 Mobile:
189 238 ~ 214 fps
140%
GeForce RTX 2080 Max-Q:
197.1  fps
QHD 2560x1440
100%
GeForce GTX 1050 Ti (Desktop):
107  fps
216%
GeForce RTX 2070 Mobile:
231  fps
4K 3840x2160
100%
GeForce GTX 1050 Ti (Desktop):
62  fps
289%
GeForce RTX 2070 Mobile:
179  fps
low 1280x720
100%
GeForce GTX 1050 Ti (Desktop):
115  fps
96%
GeForce RTX 2070 Mobile:
94 125 ~ 110 fps
112%
GeForce RTX 2080 Max-Q:
128.8  fps
med. 1920x1080
100%
GeForce GTX 1050 Ti (Desktop):
47.5  fps
204%
GeForce RTX 2070 Mobile:
84 110 ~ 97 fps
233%
GeForce RTX 2080 Max-Q:
110.8  fps
high 1920x1080
100%
GeForce GTX 1050 Ti (Desktop):
29.6  fps
264%
GeForce RTX 2070 Mobile:
71 81.4 83 ~ 78 fps
286%
GeForce RTX 2080 Max-Q:
84.7  fps
ultra 1920x1080
100%
GeForce GTX 1050 Ti (Desktop):
21.8  fps
289%
GeForce RTX 2070 Mobile:
61 63.3 64.5 ~ 63 fps
308%
GeForce RTX 2080 Max-Q:
67.1  fps
QHD 2560x1440
100%
GeForce GTX 1050 Ti (Desktop):
15  fps
301%
GeForce RTX 2070 Mobile:
45.1  fps
4K 3840x2160
GeForce RTX 2070 Mobile:
24.2  fps
Control

Control

2019
low 1280x720
100%
GeForce GTX 1050 Ti (Desktop):
94  fps
197%
GeForce RTX 2070 Mobile:
152 180 222 ~ 185 fps
247%
GeForce RTX 2080 Max-Q:
231.9  fps
med. 1920x1080
100%
GeForce GTX 1050 Ti (Desktop):
29.9  fps
311%
GeForce RTX 2070 Mobile:
90 93 97.3 ~ 93 fps
310%
GeForce RTX 2080 Max-Q:
92.8  fps
high 1920x1080
100%
GeForce GTX 1050 Ti (Desktop):
21.3  fps
324%
GeForce RTX 2070 Mobile:
68 68 72.3 ~ 69 fps
338%
GeForce RTX 2080 Max-Q:
71.9  fps
QHD 2560x1440
GeForce RTX 2070 Mobile:
46.9  fps
4K 3840x2160
GeForce RTX 2070 Mobile:
23  fps
F1 2019

F1 2019

2019
low 1280x720
100%
GeForce GTX 1050 Ti (Desktop):
164  fps
130%
GeForce RTX 2070 Mobile:
198 229 ~ 214 fps
115%
GeForce RTX 2080 Max-Q:
188  fps
med. 1920x1080
100%
GeForce GTX 1050 Ti (Desktop):
73  fps
249%
GeForce RTX 2070 Mobile:
168 195 ~ 182 fps
226%
GeForce RTX 2080 Max-Q:
165  fps
high 1920x1080
100%
GeForce GTX 1050 Ti (Desktop):
52.8  fps
286%
GeForce RTX 2070 Mobile:
139 162 ~ 151 fps
259%
GeForce RTX 2080 Max-Q:
137  fps
ultra 1920x1080
100%
GeForce GTX 1050 Ti (Desktop):
37.4  fps
291%
GeForce RTX 2070 Mobile:
95 123 ~ 109 fps
305%
GeForce RTX 2080 Max-Q:
114  fps
QHD 2560x1440
100%
GeForce GTX 1050 Ti (Desktop):
29.3  fps
307%
GeForce RTX 2070 Mobile:
90  fps
4K 3840x2160
100%
GeForce GTX 1050 Ti (Desktop):
18  fps
322%
GeForce RTX 2070 Mobile:
58  fps
low 1280x720
100%
GeForce GTX 1050 Ti (Desktop):
153  fps
152%
GeForce RTX 2070 Mobile:
232.7  fps
147%
GeForce RTX 2080 Max-Q:
224.8  fps
med. 1920x1080
100%
GeForce GTX 1050 Ti (Desktop):
51.4  fps
253%
GeForce RTX 2070 Mobile:
129.9  fps
245%
GeForce RTX 2080 Max-Q:
126.1  fps
high 1920x1080
100%
GeForce GTX 1050 Ti (Desktop):
31.5  fps
281%
GeForce RTX 2070 Mobile:
88.5  fps
282%
GeForce RTX 2080 Max-Q:
88.8  fps
ultra 1920x1080
100%
GeForce GTX 1050 Ti (Desktop):
21.4  fps
295%
GeForce RTX 2070 Mobile:
63.1  fps
306%
GeForce RTX 2080 Max-Q:
65.5  fps
QHD 2560x1440
100%
GeForce GTX 1050 Ti (Desktop):
12.8  fps
Rage 2

Rage 2

2019
low 1280x720
GeForce RTX 2070 Mobile:
180  fps
GeForce RTX 2080 Max-Q:
204.2 206.6 ~ 205 fps
med. 1920x1080
GeForce RTX 2070 Mobile:
122  fps
GeForce RTX 2080 Max-Q:
111 112.2 ~ 112 fps
high 1920x1080
GeForce RTX 2070 Mobile:
103 103 ~ 103 fps
GeForce RTX 2080 Max-Q:
93.5 96.1 ~ 95 fps
ultra 1920x1080
GeForce RTX 2070 Mobile:
100 101 ~ 101 fps
GeForce RTX 2080 Max-Q:
91.9 93.3 ~ 93 fps
Anno 1800

Anno 1800

2019
low 1280x720
GeForce RTX 2080 Max-Q:
98.5  fps
med. 1920x1080
GeForce RTX 2080 Max-Q:
93.9  fps
high 1920x1080
GeForce RTX 2070 Mobile:
68.5 76.8 ~ 73 fps
GeForce RTX 2080 Max-Q:
77.7  fps
ultra 1920x1080
GeForce RTX 2070 Mobile:
39.5 41.1 ~ 40 fps
GeForce RTX 2080 Max-Q:
41.2  fps
low 1280x720
100%
GeForce GTX 1050 Ti (Desktop):
156  fps
78%
GeForce RTX 2070 Mobile:
121  fps
85%
GeForce RTX 2080 Max-Q:
132  fps
med. 1920x1080
100%
GeForce GTX 1050 Ti (Desktop):
53.6  fps
209%
GeForce RTX 2070 Mobile:
111 113 ~ 112 fps
181%
GeForce RTX 2080 Max-Q:
97  fps
high 1920x1080
100%
GeForce GTX 1050 Ti (Desktop):
41.4  fps
232%
GeForce RTX 2070 Mobile:
94 95 98 ~ 96 fps
215%
GeForce RTX 2080 Max-Q:
84 93 ~ 89 fps
ultra 1920x1080
100%
GeForce GTX 1050 Ti (Desktop):
31.5  fps
244%
GeForce RTX 2070 Mobile:
73 78 79 ~ 77 fps
232%
GeForce RTX 2080 Max-Q:
69 77 ~ 73 fps
QHD 2560x1440
100%
GeForce GTX 1050 Ti (Desktop):
21.5  fps
279%
GeForce RTX 2070 Mobile:
60  fps
4K 3840x2160
100%
GeForce GTX 1050 Ti (Desktop):
10.2  fps
324%
GeForce RTX 2070 Mobile:
33  fps
255%
GeForce RTX 2080 Max-Q:
26  fps
low 1280x720
100%
GeForce GTX 1050 Ti (Desktop):
149  fps
106%
GeForce RTX 2080 Max-Q:
157.8  fps
med. 1920x1080
100%
GeForce GTX 1050 Ti (Desktop):
67  fps
213%
GeForce RTX 2070 Mobile:
143  fps
173%
GeForce RTX 2080 Max-Q:
116.1  fps
high 1920x1080
100%
GeForce GTX 1050 Ti (Desktop):
52.3  fps
228%
GeForce RTX 2070 Mobile:
117 121 ~ 119 fps
233%
GeForce RTX 2080 Max-Q:
101.1 143 ~ 122 fps
ultra 1920x1080
100%
GeForce GTX 1050 Ti (Desktop):
32.3  fps
232%
GeForce RTX 2070 Mobile:
75 75.2 ~ 75 fps
235%
GeForce RTX 2080 Max-Q:
66.3 85.1 ~ 76 fps
QHD 2560x1440
100%
GeForce GTX 1050 Ti (Desktop):
23.5  fps
264%
GeForce RTX 2070 Mobile:
62.1  fps
4K 3840x2160
100%
GeForce GTX 1050 Ti (Desktop):
13.4  fps
233%
GeForce RTX 2080 Max-Q:
31.2  fps
Anthem

Anthem

2019
low 1280x720
GeForce RTX 2080 Max-Q:
84.5  fps
med. 1920x1080
GeForce RTX 2070 Mobile:
88.8  fps
GeForce RTX 2080 Max-Q:
73.7  fps
high 1920x1080
GeForce RTX 2070 Mobile:
84 85.4 ~ 85 fps
GeForce RTX 2080 Max-Q:
72.1 86.1 ~ 79 fps
ultra 1920x1080
GeForce RTX 2070 Mobile:
79 79.8 ~ 79 fps
GeForce RTX 2080 Max-Q:
67.4 78.9 ~ 73 fps
QHD 2560x1440
GeForce RTX 2070 Mobile:
62  fps
4K 3840x2160
GeForce RTX 2070 Mobile:
35.5  fps
GeForce RTX 2080 Max-Q:
26.4  fps
low 1280x720
100%
GeForce GTX 1050 Ti (Desktop):
87  fps
125%
GeForce RTX 2080 Max-Q:
101 110 116 ~ 109 fps
med. 1920x1080
100%
GeForce GTX 1050 Ti (Desktop):
48  fps
196%
GeForce RTX 2070 Mobile:
94  fps
196%
GeForce RTX 2080 Max-Q:
88 95 98 ~ 94 fps
high 1920x1080
100%
GeForce GTX 1050 Ti (Desktop):
45  fps
204%
GeForce RTX 2070 Mobile:
91 92 ~ 92 fps
200%
GeForce RTX 2080 Max-Q:
82 90 92 94 ~ 90 fps
ultra 1920x1080
100%
GeForce GTX 1050 Ti (Desktop):
41  fps
202%
GeForce RTX 2070 Mobile:
82 83 ~ 83 fps
198%
GeForce RTX 2080 Max-Q:
74 81 82 85 ~ 81 fps
QHD 2560x1440
100%
GeForce GTX 1050 Ti (Desktop):
29  fps
255%
GeForce RTX 2070 Mobile:
74  fps
4K 3840x2160
100%
GeForce GTX 1050 Ti (Desktop):
14  fps
300%
GeForce RTX 2070 Mobile:
42  fps
257%
GeForce RTX 2080 Max-Q:
36  fps
low 1280x720
100%
GeForce GTX 1050 Ti (Desktop):
64.7  fps
147%
GeForce RTX 2070 Mobile:
91.1 98 ~ 95 fps
199%
GeForce RTX 2080 Max-Q:
116.7 121.7 150 ~ 129 fps
med. 1920x1080
100%
GeForce GTX 1050 Ti (Desktop):
32.8  fps
262%
GeForce RTX 2070 Mobile:
82.6 87 87.9 ~ 86 fps
274%
GeForce RTX 2080 Max-Q:
77.7 94.6 97 ~ 90 fps
high 1920x1080
100%
GeForce GTX 1050 Ti (Desktop):
24  fps
275%
GeForce RTX 2070 Mobile:
66 66.3 66.4 ~ 66 fps
283%
GeForce RTX 2080 Max-Q:
58.2 66.4 72.1 75 ~ 68 fps
ultra 1920x1080
100%
GeForce GTX 1050 Ti (Desktop):
19.8  fps
273%
GeForce RTX 2070 Mobile:
53.3 53.4 54.1 54.3 54.6 ~ 54 fps
288%
GeForce RTX 2080 Max-Q:
47.8 54 58.4 59 59 62 ~ 57 fps
QHD 2560x1440
GeForce RTX 2070 Mobile:
42  fps
4K 3840x2160
100%
GeForce GTX 1050 Ti (Desktop):
9.2  fps
284%
GeForce RTX 2070 Mobile:
26.1  fps
227%
GeForce RTX 2080 Max-Q:
20.9  fps
low 1280x720
100%
GeForce GTX 1050 Ti (Desktop):
128  fps
112%
GeForce RTX 2080 Max-Q:
143.7  fps
med. 1920x1080
100%
GeForce GTX 1050 Ti (Desktop):
55.6  fps
257%
GeForce RTX 2070 Mobile:
143  fps
247%
GeForce RTX 2080 Max-Q:
137.1  fps
high 1920x1080
100%
GeForce GTX 1050 Ti (Desktop):
46.7  fps
281%
GeForce RTX 2070 Mobile:
128 134 ~ 131 fps
259%
GeForce RTX 2080 Max-Q:
111.8 130 ~ 121 fps
ultra 1920x1080
100%
GeForce GTX 1050 Ti (Desktop):
45  fps
287%
GeForce RTX 2070 Mobile:
126 132 ~ 129 fps
264%
GeForce RTX 2080 Max-Q:
109.9 128 ~ 119 fps
QHD 2560x1440
100%
GeForce GTX 1050 Ti (Desktop):
28.8  fps
306%
GeForce RTX 2070 Mobile:
88.2  fps
4K 3840x2160
100%
GeForce GTX 1050 Ti (Desktop):
14.1  fps
322%
GeForce RTX 2070 Mobile:
45.4  fps
255%
GeForce RTX 2080 Max-Q:
36  fps
low 1280x720
GeForce RTX 2070 Mobile:
169.5  fps
med. 1920x1080
GeForce RTX 2070 Mobile:
124 129.3 ~ 127 fps
GeForce RTX 2080 Max-Q:
137 140 ~ 139 fps
high 1920x1080
100%
GeForce GTX 1050 Ti (Desktop):
41.9  fps
232%
GeForce RTX 2070 Mobile:
96.1 97.1 ~ 97 fps
248%
GeForce RTX 2080 Max-Q:
103 104 ~ 104 fps
ultra 1920x1080
100%
GeForce GTX 1050 Ti (Desktop):
40.1  fps
224%
GeForce RTX 2070 Mobile:
88.6 91.3 ~ 90 fps
249%
GeForce RTX 2080 Max-Q:
98.1 101 ~ 100 fps
QHD 2560x1440
GeForce RTX 2070 Mobile:
63.6  fps
GeForce RTX 2080 Max-Q:
67.6 69.9 ~ 69 fps
4K 3840x2160
GeForce RTX 2070 Mobile:
36.3  fps
GeForce RTX 2080 Max-Q:
39.5 39.9 ~ 40 fps
low 1280x720
GeForce RTX 2070 Mobile:
169.2  fps
GeForce RTX 2080 Max-Q:
137  fps
med. 1920x1080
GeForce RTX 2070 Mobile:
102.4 142 ~ 122 fps
GeForce RTX 2080 Max-Q:
103.5 126 130 ~ 120 fps
high 1920x1080
100%
GeForce GTX 1050 Ti (Desktop):
50.9  fps
214%
GeForce RTX 2070 Mobile:
98.5 119 ~ 109 fps
200%
GeForce RTX 2080 Max-Q:
84.5 94.3 110 121 ~ 102 fps
ultra 1920x1080
100%
GeForce GTX 1050 Ti (Desktop):
43.3  fps
233%
GeForce RTX 2070 Mobile:
94.7 108 ~ 101 fps
219%
GeForce RTX 2080 Max-Q:
81.4 84.8 103 112 ~ 95 fps
QHD 2560x1440
GeForce RTX 2070 Mobile:
76.7  fps
GeForce RTX 2080 Max-Q:
75.2 82.6 ~ 79 fps
4K 3840x2160
GeForce RTX 2070 Mobile:
37.8  fps
GeForce RTX 2080 Max-Q:
29.8 37.8 42.7 ~ 37 fps
low 1280x720
100%
GeForce GTX 1050 Ti (Desktop):
140  fps
80%
GeForce RTX 2070 Mobile:
111.6  fps
med. 1920x1080
100%
GeForce GTX 1050 Ti (Desktop):
63  fps
190%
GeForce RTX 2070 Mobile:
86 153 ~ 120 fps
217%
GeForce RTX 2080 Max-Q:
131 143 ~ 137 fps
high 1920x1080
100%
GeForce GTX 1050 Ti (Desktop):
51.9  fps
224%
GeForce RTX 2070 Mobile:
77.7 134 136 ~ 116 fps
243%
GeForce RTX 2080 Max-Q:
121 130 ~ 126 fps
ultra 1920x1080
100%
GeForce GTX 1050 Ti (Desktop):
50.9  fps
208%
GeForce RTX 2070 Mobile:
73 121 124 ~ 106 fps
230%
GeForce RTX 2080 Max-Q:
112 116 122 ~ 117 fps
QHD 2560x1440
100%
GeForce GTX 1050 Ti (Desktop):
35.6  fps
258%
GeForce RTX 2070 Mobile:
91.7  fps
264%
GeForce RTX 2080 Max-Q:
91.2 91.6 98.2 ~ 94 fps
4K 3840x2160
100%
GeForce GTX 1050 Ti (Desktop):
17.5  fps
298%
GeForce RTX 2070 Mobile:
52.1  fps
309%
GeForce RTX 2080 Max-Q:
52.4 52.5 57.8 ~ 54 fps
med. 1920x1080
GeForce RTX 2070 Mobile:
194  fps
GeForce RTX 2080 Max-Q:
144 161 ~ 153 fps
high 1920x1080
GeForce RTX 2070 Mobile:
162  fps
GeForce RTX 2080 Max-Q:
130 141 ~ 136 fps
ultra 1920x1080
100%
GeForce GTX 1050 Ti (Desktop):
60  fps
235%
GeForce RTX 2070 Mobile:
141  fps
210%
GeForce RTX 2080 Max-Q:
121 131 ~ 126 fps
QHD 2560x1440
GeForce RTX 2070 Mobile:
104  fps
GeForce RTX 2080 Max-Q:
107 113 ~ 110 fps
4K 3840x2160
100%
GeForce GTX 1050 Ti (Desktop):
20.3  fps
ultra 1920x1080
100%
GeForce GTX 1050 Ti (Desktop):
46.4  fps
QHD 2560x1440
100%
GeForce GTX 1050 Ti (Desktop):
30.7  fps
Hitman 2

Hitman 2

2018
med. 1920x1080
GeForce RTX 2070 Mobile:
94.5  fps
GeForce RTX 2080 Max-Q:
77.9 78.8 ~ 78 fps
high 1920x1080
GeForce RTX 2070 Mobile:
86.1  fps
GeForce RTX 2080 Max-Q:
70.3 70.9 ~ 71 fps
ultra 1920x1080
100%
GeForce GTX 1050 Ti (Desktop):
39.1  fps
213%
GeForce RTX 2070 Mobile:
83.3  fps
174%
GeForce RTX 2080 Max-Q:
67.1 69.1 ~ 68 fps
QHD 2560x1440
GeForce RTX 2070 Mobile:
72.4  fps
GeForce RTX 2080 Max-Q:
65.3 66 ~ 66 fps
4K 3840x2160
GeForce RTX 2070 Mobile:
37.9  fps
GeForce RTX 2080 Max-Q:
38.2  fps
med. 1920x1080
100%
GeForce GTX 1050 Ti (Desktop):
53  fps
268%
GeForce RTX 2070 Mobile:
142  fps
272%
GeForce RTX 2080 Max-Q:
140 142 151 ~ 144 fps
high 1920x1080
100%
GeForce GTX 1050 Ti (Desktop):
47.3  fps
285%
GeForce RTX 2070 Mobile:
135  fps
281%
GeForce RTX 2080 Max-Q:
128 132 138 ~ 133 fps
ultra 1920x1080
100%
GeForce GTX 1050 Ti (Desktop):
41.6  fps
286%
GeForce RTX 2070 Mobile:
119  fps
308%
GeForce RTX 2080 Max-Q:
125 128 131 ~ 128 fps
QHD 2560x1440
GeForce RTX 2070 Mobile:
77.9  fps
GeForce RTX 2080 Max-Q:
83.8 91.4 ~ 88 fps
4K 3840x2160
GeForce RTX 2070 Mobile:
39.2  fps
GeForce RTX 2080 Max-Q:
40.4 41.6 ~ 41 fps
med. 1920x1080
100%
GeForce GTX 1050 Ti (Desktop):
48  fps
208%
GeForce RTX 2070 Mobile:
100  fps
165%
GeForce RTX 2080 Max-Q:
68 81 87 ~ 79 fps
high 1920x1080
100%
GeForce GTX 1050 Ti (Desktop):
40  fps
210%
GeForce RTX 2070 Mobile:
84  fps
178%
GeForce RTX 2080 Max-Q:
64 72 76 ~ 71 fps
ultra 1920x1080
100%
GeForce GTX 1050 Ti (Desktop):
24  fps
242%
GeForce RTX 2070 Mobile:
58  fps
233%
GeForce RTX 2080 Max-Q:
53 56 59 ~ 56 fps
QHD 2560x1440
GeForce RTX 2070 Mobile:
48  fps
GeForce RTX 2080 Max-Q:
46 48 ~ 47 fps
4K 3840x2160
GeForce RTX 2070 Mobile:
31  fps
GeForce RTX 2080 Max-Q:
30 32 ~ 31 fps
low 1280x720
100%
GeForce GTX 1050 Ti (Desktop):
133  fps
103%
GeForce RTX 2070 Mobile:
137  fps
med. 1920x1080
100%
GeForce GTX 1050 Ti (Desktop):
69  fps
164%
GeForce RTX 2070 Mobile:
113  fps
high 1920x1080
100%
GeForce GTX 1050 Ti (Desktop):
64  fps
175%
GeForce RTX 2070 Mobile:
112  fps
ultra 1920x1080
100%
GeForce GTX 1050 Ti (Desktop):
45  fps
209%
GeForce RTX 2070 Mobile:
94  fps
4K 3840x2160
100%
GeForce GTX 1050 Ti (Desktop):
20  fps
FIFA 19

FIFA 19

2018
med. 1920x1080
GeForce RTX 2070 Mobile:
382  fps
GeForce RTX 2080 Max-Q:
203 271 272 ~ 249 fps
high 1920x1080
GeForce RTX 2070 Mobile:
287  fps
GeForce RTX 2080 Max-Q:
186 223 254 ~ 221 fps
ultra 1920x1080
100%
GeForce GTX 1050 Ti (Desktop):
105  fps
266%
GeForce RTX 2070 Mobile:
279  fps
206%
GeForce RTX 2080 Max-Q:
182 219 248 ~ 216 fps
QHD 2560x1440
100%
GeForce GTX 1050 Ti (Desktop):
75  fps
369%
GeForce RTX 2070 Mobile:
277  fps
299%
GeForce RTX 2080 Max-Q:
211 237 ~ 224 fps
4K 3840x2160
100%
GeForce GTX 1050 Ti (Desktop):
40.1  fps
399%
GeForce RTX 2070 Mobile:
160  fps
436%
GeForce RTX 2080 Max-Q:
161 188 ~ 175 fps
low 1280x720
GeForce RTX 2070 Mobile:
91.3 105 111 118 119 135 138 143 160 ~ 124 fps
GeForce RTX 2080 Max-Q:
114 131 132 133 142 ~ 130 fps
med. 1920x1080
100%
GeForce GTX 1050 Ti (Desktop):
31  fps
323%
GeForce RTX 2070 Mobile:
86 91 92 95 97 104 107 107 111 114 ~ 100 fps
316%
GeForce RTX 2080 Max-Q:
80 84 91 102 103 110 118 ~ 98 fps
high 1920x1080
100%
GeForce GTX 1050 Ti (Desktop):
29  fps
331%
GeForce RTX 2070 Mobile:
80.3 84 90 92 93 100 101 102 103 107 107 ~ 96 fps
324%
GeForce RTX 2080 Max-Q:
78 82 89 97 99 105 111 ~ 94 fps
ultra 1920x1080
100%
GeForce GTX 1050 Ti (Desktop):
25  fps
356%
GeForce RTX 2070 Mobile:
74.2 78 80 85 91 93 93 93 95 97 97 ~ 89 fps
348%
GeForce RTX 2080 Max-Q:
71 75 78 84 87 94 99 105 ~ 87 fps
QHD 2560x1440
GeForce RTX 2070 Mobile:
58  fps
GeForce RTX 2080 Max-Q:
57 58 61 ~ 59 fps
4K 3840x2160
GeForce RTX 2070 Mobile:
32 34 ~ 33 fps
GeForce RTX 2080 Max-Q:
33 33 37 40 ~ 36 fps
Strange Brigade

Strange Brigade

2018
low 1280x720
100%
GeForce GTX 1050 Ti (Desktop):
169  fps
185%
GeForce RTX 2070 Mobile:
313  fps
med. 1920x1080
100%
GeForce GTX 1050 Ti (Desktop):
66.6  fps
275%
GeForce RTX 2070 Mobile:
183  fps
high 1920x1080
100%
GeForce GTX 1050 Ti (Desktop):
49.8  fps
299%
GeForce RTX 2070 Mobile:
149  fps
ultra 1920x1080
100%
GeForce GTX 1050 Ti (Desktop):
42.5  fps
294%
GeForce RTX 2070 Mobile:
125  fps
QHD 2560x1440
100%
GeForce GTX 1050 Ti (Desktop):
30.2  fps
4K 3840x2160
100%
GeForce GTX 1050 Ti (Desktop):
17  fps
F1 2018

F1 2018

2018
low 1280x720
100%
GeForce GTX 1050 Ti (Desktop):
136  fps
med. 1920x1080
100%
GeForce GTX 1050 Ti (Desktop):
80  fps
233%
GeForce RTX 2070 Mobile:
186  fps
218%
GeForce RTX 2080 Max-Q:
169 178 ~ 174 fps
high 1920x1080
100%
GeForce GTX 1050 Ti (Desktop):
63  fps
241%
GeForce RTX 2070 Mobile:
152  fps
211%
GeForce RTX 2080 Max-Q:
130 136 ~ 133 fps
ultra 1920x1080
100%
GeForce GTX 1050 Ti (Desktop):
42.4  fps
243%
GeForce RTX 2070 Mobile:
103  fps
241%
GeForce RTX 2080 Max-Q:
102 102 ~ 102 fps
QHD 2560x1440
100%
GeForce GTX 1050 Ti (Desktop):
29.5  fps
285%
GeForce RTX 2070 Mobile:
84  fps
295%
GeForce RTX 2080 Max-Q:
86 87 ~ 87 fps
4K 3840x2160
100%
GeForce GTX 1050 Ti (Desktop):
18.3  fps
279%
GeForce RTX 2070 Mobile:
51  fps
295%
GeForce RTX 2080 Max-Q:
51 56 ~ 54 fps
med. 1920x1080
GeForce RTX 2070 Mobile:
117  fps
GeForce RTX 2080 Max-Q:
117 123 ~ 120 fps
high 1920x1080
GeForce RTX 2070 Mobile:
103  fps
GeForce RTX 2080 Max-Q:
105 111 ~ 108 fps
ultra 1920x1080
GeForce RTX 2070 Mobile:
81  fps
GeForce RTX 2080 Max-Q:
84.8 90.9 ~ 88 fps
QHD 2560x1440
GeForce RTX 2070 Mobile:
51.9  fps
GeForce RTX 2080 Max-Q:
52.5 58.4 ~ 55 fps
4K 3840x2160
GeForce RTX 2070 Mobile:
25.1  fps
GeForce RTX 2080 Max-Q:
27.1 29.7 ~ 28 fps
med. 1920x1080
GeForce RTX 2070 Mobile:
60  fps
GeForce RTX 2080 Max-Q:
60 60 ~ 60 fps
high 1920x1080
GeForce RTX 2070 Mobile:
60  fps
GeForce RTX 2080 Max-Q:
60 60 ~ 60 fps
ultra 1920x1080
GeForce RTX 2070 Mobile:
60  fps
GeForce RTX 2080 Max-Q:
60 60 ~ 60 fps
QHD 2560x1440
GeForce RTX 2070 Mobile:
60  fps
GeForce RTX 2080 Max-Q:
60 60 ~ 60 fps
4K 3840x2160
GeForce RTX 2070 Mobile:
38.8  fps
GeForce RTX 2080 Max-Q:
37.4 39.9 ~ 39 fps
Far Cry 5

Far Cry 5

2018
low 1280x720
GeForce RTX 2070 Mobile:
147  fps
GeForce RTX 2080 Max-Q:
114 122 123 ~ 120 fps
med. 1920x1080
GeForce RTX 2070 Mobile:
119 125 ~ 122 fps
GeForce RTX 2080 Max-Q:
94 101 103 107 109 109 ~ 104 fps
high 1920x1080
GeForce RTX 2070 Mobile:
110 115 ~ 113 fps
GeForce RTX 2080 Max-Q:
68 88 97 97 99 99 106 ~ 93 fps
ultra 1920x1080
100%
GeForce GTX 1050 Ti (Desktop):
36  fps
294%
GeForce RTX 2070 Mobile:
103 109 ~ 106 fps
247%
GeForce RTX 2080 Max-Q:
66 84 92 93 93 95 100 ~ 89 fps
QHD 2560x1440
GeForce RTX 2070 Mobile:
76  fps
GeForce RTX 2080 Max-Q:
72 79 ~ 76 fps
4K 3840x2160
GeForce RTX 2070 Mobile:
40  fps
GeForce RTX 2080 Max-Q:
34 40 44 ~ 39 fps
low 1280x720
100%
GeForce GTX 1050 Ti (Desktop):
94 102 ~ 98 fps
110%
GeForce RTX 2070 Mobile:
96.1 102 103 105 107 110 112 128.4 ~ 108 fps
98%
GeForce RTX 2080 Max-Q:
82.9 91 101.9 108 ~ 96 fps
med. 1920x1080
100%
GeForce GTX 1050 Ti (Desktop):
86 92 ~ 89 fps
107%
GeForce RTX 2070 Mobile:
85 87.3 90.5 91.7 92.3 95.5 102 114.1 ~ 95 fps
94%
GeForce RTX 2080 Max-Q:
68.9 80.5 89.2 97.4 ~ 84 fps
high 1920x1080
100%
GeForce GTX 1050 Ti (Desktop):
74 79 ~ 77 fps
104%
GeForce RTX 2070 Mobile:
71.9 76 77.5 77.5 79.6 81.1 82.9 92.5 ~ 80 fps
91%
GeForce RTX 2080 Max-Q:
55.8 67.2 74.8 81.6 ~ 70 fps
4K 3840x2160
100%
GeForce GTX 1050 Ti (Desktop):
41.7  fps
106%
GeForce RTX 2080 Max-Q:
36.5 51.8 ~ 44 fps
med. 1920x1080
GeForce RTX 2070 Mobile:
125  fps
GeForce RTX 2080 Max-Q:
115 118 ~ 117 fps
high 1920x1080
100%
GeForce GTX 1050 Ti (Desktop):
35.2  fps
276%
GeForce RTX 2070 Mobile:
97.3  fps
256%
GeForce RTX 2080 Max-Q:
89.5 90.5 ~ 90 fps
ultra 1920x1080
100%
GeForce GTX 1050 Ti (Desktop):
26.6  fps
275%
GeForce RTX 2070 Mobile:
73.2  fps
252%
GeForce RTX 2080 Max-Q:
64.9 68.4 ~ 67 fps
QHD 2560x1440
GeForce RTX 2070 Mobile:
52.4  fps
GeForce RTX 2080 Max-Q:
50.2 52.2 ~ 51 fps
4K 3840x2160
GeForce RTX 2070 Mobile:
26.2  fps
GeForce RTX 2080 Max-Q:
26.7 27.5 ~ 27 fps
low 1280x720
100%
GeForce GTX 1050 Ti (Desktop):
62  fps
250%
GeForce RTX 2070 Mobile:
151 158 ~ 155 fps
203%
GeForce RTX 2080 Max-Q:
125.2 127.4 ~ 126 fps
med. 1920x1080
100%
GeForce GTX 1050 Ti (Desktop):
33.3  fps
309%
GeForce RTX 2070 Mobile:
100 103 106 ~ 103 fps
309%
GeForce RTX 2080 Max-Q:
100.1 100.7 103 103 106 ~ 103 fps
high 1920x1080
100%
GeForce GTX 1050 Ti (Desktop):
22.7  fps
348%
GeForce RTX 2070 Mobile:
77 78.1 80.6 ~ 79 fps
344%
GeForce RTX 2080 Max-Q:
74 75.9 77.3 79.7 81.4 ~ 78 fps
4K 3840x2160
GeForce RTX 2070 Mobile:
32.2  fps
GeForce RTX 2080 Max-Q:
32.7 35.9 ~ 34 fps
Fortnite

Fortnite

2018
low 1280x720
GeForce RTX 2070 Mobile:
236  fps
med. 1920x1080
GeForce RTX 2070 Mobile:
185 190 ~ 188 fps
GeForce RTX 2080 Max-Q:
139 143 147 ~ 143 fps
high 1920x1080
100%
GeForce GTX 1050 Ti (Desktop):
65  fps
229%
GeForce RTX 2070 Mobile:
140 158 ~ 149 fps
208%
GeForce RTX 2080 Max-Q:
128 138 140 ~ 135 fps
ultra 1920x1080
100%
GeForce GTX 1050 Ti (Desktop):
44.8  fps
315%
GeForce RTX 2070 Mobile:
132 149 ~ 141 fps
277%
GeForce RTX 2080 Max-Q:
116 121 136 ~ 124 fps
QHD 2560x1440
GeForce RTX 2070 Mobile:
93.5  fps
GeForce RTX 2080 Max-Q:
97.7 105 ~ 101 fps
4K 3840x2160
100%
GeForce GTX 1050 Ti (Desktop):
12.5  fps
364%
GeForce RTX 2070 Mobile:
45.5  fps
392%
GeForce RTX 2080 Max-Q:
46.7 50.4 ~ 49 fps
med. 1920x1080
GeForce RTX 2070 Mobile:
163  fps
GeForce RTX 2080 Max-Q:
143 145 160 ~ 149 fps
high 1920x1080
GeForce RTX 2070 Mobile:
140  fps
GeForce RTX 2080 Max-Q:
129 131 140 ~ 133 fps
ultra 1920x1080
GeForce RTX 2070 Mobile:
106  fps
GeForce RTX 2080 Max-Q:
110 111 117 ~ 113 fps
QHD 2560x1440
GeForce RTX 2070 Mobile:
75.3  fps
GeForce RTX 2080 Max-Q:
76.5 80.9 ~ 79 fps
4K 3840x2160
GeForce RTX 2070 Mobile:
39.8  fps
GeForce RTX 2080 Max-Q:
39.3 42.7 ~ 41 fps
med. 1920x1080
GeForce RTX 2070 Mobile:
157  fps
GeForce RTX 2080 Max-Q:
111 118 127 ~ 119 fps
high 1920x1080
GeForce RTX 2070 Mobile:
141  fps
GeForce RTX 2080 Max-Q:
108 112 120 ~ 113 fps
ultra 1920x1080
GeForce RTX 2070 Mobile:
135  fps
GeForce RTX 2080 Max-Q:
104 111 115 ~ 110 fps
QHD 2560x1440
GeForce RTX 2070 Mobile:
90.1  fps
GeForce RTX 2080 Max-Q:
88.2 95.6 ~ 92 fps
4K 3840x2160
GeForce RTX 2070 Mobile:
48  fps
GeForce RTX 2080 Max-Q:
47.2 54.3 ~ 51 fps
low 1280x720
GeForce RTX 2070 Mobile:
84  fps
med. 1920x1080
GeForce RTX 2070 Mobile:
72  fps
GeForce RTX 2080 Max-Q:
82  fps
high 1920x1080
GeForce RTX 2070 Mobile:
71  fps
GeForce RTX 2080 Max-Q:
65 80 ~ 73 fps
ultra 1920x1080
GeForce RTX 2070 Mobile:
64  fps
GeForce RTX 2080 Max-Q:
62 69 ~ 66 fps
QHD 2560x1440
GeForce RTX 2080 Max-Q:
61  fps
4K 3840x2160
GeForce RTX 2080 Max-Q:
39  fps
Destiny 2

Destiny 2

2017
low 1280x720
GeForce RTX 2070 Mobile:
206.1  fps
med. 1920x1080
GeForce RTX 2070 Mobile:
181.2  fps
high 1920x1080
GeForce RTX 2070 Mobile:
169.5  fps
ultra 1920x1080
GeForce RTX 2070 Mobile:
144.5  fps
ELEX

ELEX

2017
med. 1920x1080
GeForce RTX 2070 Mobile:
121  fps
GeForce RTX 2080 Max-Q:
117 120 ~ 119 fps
high 1920x1080
GeForce RTX 2070 Mobile:
119  fps
GeForce RTX 2080 Max-Q:
112 115 ~ 114 fps
ultra 1920x1080
GeForce RTX 2070 Mobile:
94.1  fps
GeForce RTX 2080 Max-Q:
92.7 99 ~ 96 fps
QHD 2560x1440
GeForce RTX 2070 Mobile:
62.7  fps
GeForce RTX 2080 Max-Q:
63.2 68.1 ~ 66 fps
4K 3840x2160
GeForce RTX 2070 Mobile:
33.1  fps
GeForce RTX 2080 Max-Q:
33 35.7 ~ 34 fps
med. 1920x1080
GeForce RTX 2070 Mobile:
161  fps
GeForce RTX 2080 Max-Q:
150 157 ~ 154 fps
high 1920x1080
GeForce RTX 2070 Mobile:
127  fps
GeForce RTX 2080 Max-Q:
119 125 ~ 122 fps
ultra 1920x1080
GeForce RTX 2070 Mobile:
96  fps
GeForce RTX 2080 Max-Q:
93 99 ~ 96 fps
4K 3840x2160
GeForce RTX 2070 Mobile:
39  fps
GeForce RTX 2080 Max-Q:
40 44 ~ 42 fps
low 1280x720
GeForce RTX 2080 Max-Q:
160.9  fps
med. 1920x1080
GeForce RTX 2080 Max-Q:
87.9  fps
high 1920x1080
GeForce RTX 2080 Max-Q:
63.5  fps
ultra 1920x1080
GeForce RTX 2080 Max-Q:
43.9  fps
low 1280x720
100%
GeForce GTX 1050 Ti (Desktop):
127  fps
med. 1920x1080
100%
GeForce GTX 1050 Ti (Desktop):
55.1  fps
356%
GeForce RTX 2070 Mobile:
196  fps
361%
GeForce RTX 2080 Max-Q:
190 207 ~ 199 fps
high 1920x1080
100%
GeForce GTX 1050 Ti (Desktop):
49.5  fps
349%
GeForce RTX 2070 Mobile:
173  fps
354%
GeForce RTX 2080 Max-Q:
174 175 ~ 175 fps
ultra 1920x1080
100%
GeForce GTX 1050 Ti (Desktop):
35.5  fps
366%
GeForce RTX 2070 Mobile:
130  fps
383%
GeForce RTX 2080 Max-Q:
133 139 ~ 136 fps
4K 3840x2160
100%
GeForce GTX 1050 Ti (Desktop):
11.4  fps
406%
GeForce RTX 2070 Mobile:
46.3  fps
439%
GeForce RTX 2080 Max-Q:
48.4 51.5 ~ 50 fps
Dirt 4

Dirt 4

2017
med. 1920x1080
GeForce RTX 2070 Mobile:
242  fps
GeForce RTX 2080 Max-Q:
212 225 ~ 219 fps
high 1920x1080
GeForce RTX 2070 Mobile:
175  fps
GeForce RTX 2080 Max-Q:
150 164 ~ 157 fps
ultra 1920x1080
GeForce RTX 2070 Mobile:
104  fps
GeForce RTX 2080 Max-Q:
102 105 ~ 104 fps
low 1280x720
GeForce RTX 2080 Max-Q:
248.7 249 ~ 249 fps
med. 1920x1080
GeForce RTX 2070 Mobile:
249  fps
GeForce RTX 2080 Max-Q:
239.3 247.7 248 249 ~ 246 fps
high 1920x1080
100%
GeForce GTX 1050 Ti (Desktop):
52.2  fps
473%
GeForce RTX 2070 Mobile:
247  fps
446%
GeForce RTX 2080 Max-Q:
218 218.5 248 248.4 ~ 233 fps
4K 3840x2160
100%
GeForce GTX 1050 Ti (Desktop):
30.7  fps
384%
GeForce RTX 2070 Mobile:
118  fps
384%
GeForce RTX 2080 Max-Q:
112 123 ~ 118 fps
Prey

Prey

2017
low 1280x720
100%
GeForce GTX 1050 Ti (Desktop):
143  fps
med. 1920x1080
GeForce RTX 2070 Mobile:
143  fps
GeForce RTX 2080 Max-Q:
142 142 ~ 142 fps
high 1920x1080
100%
GeForce GTX 1050 Ti (Desktop):
82  fps
171%
GeForce RTX 2070 Mobile:
140  fps
172%
GeForce RTX 2080 Max-Q:
140 141 ~ 141 fps
ultra 1920x1080
100%
GeForce GTX 1050 Ti (Desktop):
66.6  fps
209%
GeForce RTX 2070 Mobile:
139  fps
209%
GeForce RTX 2080 Max-Q:
139 139 ~ 139 fps
4K 3840x2160
100%
GeForce GTX 1050 Ti (Desktop):
23  fps
273%
GeForce RTX 2070 Mobile:
62.8  fps
287%
GeForce RTX 2080 Max-Q:
63.4 69.5 ~ 66 fps
high 1920x1080
100%
GeForce GTX 1050 Ti (Desktop):
30  fps
ultra 1920x1080
100%
GeForce GTX 1050 Ti (Desktop):
25.9  fps
med. 1920x1080
100%
GeForce GTX 1050 Ti (Desktop):
52.7  fps
high 1920x1080
100%
GeForce GTX 1050 Ti (Desktop):
34.8  fps
ultra 1920x1080
100%
GeForce GTX 1050 Ti (Desktop):
31.4  fps
4K 3840x2160
100%
GeForce GTX 1050 Ti (Desktop):
13.2  fps
med. 1920x1080
GeForce RTX 2070 Mobile:
106  fps
GeForce RTX 2080 Max-Q:
89.8 94.4 105 ~ 96 fps
high 1920x1080
GeForce RTX 2070 Mobile:
98.9  fps
GeForce RTX 2080 Max-Q:
87 89.8 98.2 ~ 92 fps
ultra 1920x1080
GeForce RTX 2070 Mobile:
56.8  fps
GeForce RTX 2080 Max-Q:
57.2 57.7 58 ~ 58 fps
4K 3840x2160
GeForce RTX 2070 Mobile:
39.1  fps
GeForce RTX 2080 Max-Q:
39.1 42 ~ 41 fps
For Honor

For Honor

2017
low 1280x720
100%
GeForce GTX 1050 Ti (Desktop):
198  fps
135%
GeForce RTX 2080 Max-Q:
267.2  fps
med. 1920x1080
100%
GeForce GTX 1050 Ti (Desktop):
71.4  fps
230%
GeForce RTX 2070 Mobile:
164  fps
232%
GeForce RTX 2080 Max-Q:
163 165.2 166 171 ~ 166 fps
high 1920x1080
100%
GeForce GTX 1050 Ti (Desktop):
68  fps
229%
GeForce RTX 2070 Mobile:
156  fps
234%
GeForce RTX 2080 Max-Q:
156 156.5 158 164 ~ 159 fps
ultra 1920x1080
100%
GeForce GTX 1050 Ti (Desktop):
48.9  fps
241%
GeForce RTX 2070 Mobile:
118  fps
260%
GeForce RTX 2080 Max-Q:
122 123.4 130 131 ~ 127 fps
4K 3840x2160
100%
GeForce GTX 1050 Ti (Desktop):
19.7  fps
257%
GeForce RTX 2070 Mobile:
50.6  fps
279%
GeForce RTX 2080 Max-Q:
52.9 57.2 ~ 55 fps
med. 1920x1080
GeForce RTX 2070 Mobile:
349  fps
GeForce RTX 2080 Max-Q:
352 360 ~ 356 fps
high 1920x1080
100%
GeForce GTX 1050 Ti (Desktop):
70  fps
277%
GeForce RTX 2070 Mobile:
194  fps
296%
GeForce RTX 2080 Max-Q:
194 220 ~ 207 fps
ultra 1920x1080
100%
GeForce GTX 1050 Ti (Desktop):
58.4  fps
277%
GeForce RTX 2070 Mobile:
162  fps
296%
GeForce RTX 2080 Max-Q:
163 182 ~ 173 fps
4K 3840x2160
100%
GeForce GTX 1050 Ti (Desktop):
18.6  fps
300%
GeForce RTX 2070 Mobile:
55.8  fps
333%
GeForce RTX 2080 Max-Q:
58.6 65.1 ~ 62 fps
high 1920x1080
100%
GeForce GTX 1050 Ti (Desktop):
45.4  fps
ultra 1920x1080
100%
GeForce GTX 1050 Ti (Desktop):
28.5  fps
4K 3840x2160
100%
GeForce GTX 1050 Ti (Desktop):
15.2  fps
low 1280x720
100%
GeForce GTX 1050 Ti (Desktop):
82  fps
med. 1366x768
100%
GeForce GTX 1050 Ti (Desktop):
73  fps
high 1920x1080
100%
GeForce GTX 1050 Ti (Desktop):
41.1  fps
285%
GeForce RTX 2070 Mobile:
117  fps
253%
GeForce RTX 2080 Max-Q:
98.8 109 ~ 104 fps
ultra 1920x1080
100%
GeForce GTX 1050 Ti (Desktop):
38.7  fps
271%
GeForce RTX 2070 Mobile:
105  fps
240%
GeForce RTX 2080 Max-Q:
92.8 94 ~ 93 fps
4K 3840x2160
100%
GeForce GTX 1050 Ti (Desktop):
21.9  fps
243%
GeForce RTX 2070 Mobile:
53.3  fps
265%
GeForce RTX 2080 Max-Q:
54.4 61.1 ~ 58 fps
ultra 1920x1080
100%
GeForce GTX 1050 Ti (Desktop):
60.5  fps
4K 3840x2160
100%
GeForce GTX 1050 Ti (Desktop):
26.1  fps
high 1920x1080
100%
GeForce GTX 1050 Ti (Desktop):
62  fps
ultra 1920x1080
100%
GeForce GTX 1050 Ti (Desktop):
56.6  fps
4K 3840x2160
100%
GeForce GTX 1050 Ti (Desktop):
18.5  fps
ultra 1920x1080
100%
GeForce GTX 1050 Ti (Desktop):
113  fps
4K 3840x2160
100%
GeForce GTX 1050 Ti (Desktop):
51.1  fps
low 1280x720
100%
GeForce GTX 1050 Ti (Desktop):
199  fps
83%
GeForce RTX 2070 Mobile:
165.4  fps
med. 1366x768
100%
GeForce GTX 1050 Ti (Desktop):
144  fps
98%
GeForce RTX 2070 Mobile:
141.5  fps
high 1920x1080
100%
GeForce GTX 1050 Ti (Desktop):
69  fps
175%
GeForce RTX 2070 Mobile:
120.6  fps
203%
GeForce RTX 2080 Max-Q:
134 146 ~ 140 fps
ultra 1920x1080
100%
GeForce GTX 1050 Ti (Desktop):
62.4  fps
182%
GeForce RTX 2070 Mobile:
113.3  fps
212%
GeForce RTX 2080 Max-Q:
129 134 ~ 132 fps
4K 3840x2160
100%
GeForce GTX 1050 Ti (Desktop):
25.2  fps
258%
GeForce RTX 2080 Max-Q:
65  fps
low 1024x768
GeForce RTX 2070 Mobile:
224.1  fps
med. 1366x768
GeForce RTX 2070 Mobile:
163.6  fps
high 1920x1080
100%
GeForce GTX 1050 Ti (Desktop):
57.5  fps
226%
GeForce RTX 2070 Mobile:
129.8  fps
ultra 1920x1080
100%
GeForce GTX 1050 Ti (Desktop):
47.3  fps
256%
GeForce RTX 2070 Mobile:
121.1  fps
4K 3840x2160
100%
GeForce GTX 1050 Ti (Desktop):
36.3  fps
Mafia 3

Mafia 3

2016
low 1280x720
100%
GeForce GTX 1050 Ti (Desktop):
68.2  fps
med. 1366x768
100%
GeForce GTX 1050 Ti (Desktop):
41.8  fps
high 1920x1080
100%
GeForce GTX 1050 Ti (Desktop):
22.1  fps
FIFA 17

FIFA 17

2016
ultra 1920x1080
100%
GeForce GTX 1050 Ti (Desktop):
187  fps
4K 3840x2160
100%
GeForce GTX 1050 Ti (Desktop):
72  fps
med. 1366x768
100%
GeForce GTX 1050 Ti (Desktop):
61.4  fps
high 1920x1080
100%
GeForce GTX 1050 Ti (Desktop):
32.7  fps
315%
GeForce RTX 2070 Mobile:
103  fps
321%
GeForce RTX 2080 Max-Q:
103 107 ~ 105 fps
ultra 1920x1080
100%
GeForce GTX 1050 Ti (Desktop):
22.8  fps
262%
GeForce RTX 2070 Mobile:
59.8  fps
272%
GeForce RTX 2080 Max-Q:
59.7 63.5 ~ 62 fps
4K 3840x2160
GeForce RTX 2070 Mobile:
36.9  fps
GeForce RTX 2080 Max-Q:
37.4 40.6 ~ 39 fps
low 1280x720
100%
GeForce GTX 1050 Ti (Desktop):
79  fps
high 1920x1080
100%
GeForce GTX 1050 Ti (Desktop):
44.6  fps
ultra 1920x1080
100%
GeForce GTX 1050 Ti (Desktop):
20.7  fps
high 1920x1080
GeForce RTX 2070 Mobile:
131  fps
GeForce RTX 2080 Max-Q:
120 121 135 ~ 125 fps
ultra 1920x1080
100%
GeForce GTX 1050 Ti (Desktop):
46.5  fps
258%
GeForce RTX 2070 Mobile:
120  fps
247%
GeForce RTX 2080 Max-Q:
110 113 123 ~ 115 fps
4K 3840x2160
GeForce RTX 2070 Mobile:
45.5  fps
GeForce RTX 2080 Max-Q:
45.6 50.2 ~ 48 fps
Overwatch

Overwatch

2016
high 1920x1080
100%
GeForce GTX 1050 Ti (Desktop):
114  fps
255%
GeForce RTX 2070 Mobile:
291  fps
239%
GeForce RTX 2080 Max-Q:
238 289 292 ~ 273 fps
ultra 1920x1080
100%
GeForce GTX 1050 Ti (Desktop):
68  fps
271%
GeForce RTX 2070 Mobile:
184  fps
271%
GeForce RTX 2080 Max-Q:
178 179 196 ~ 184 fps
4K 3840x2160
100%
GeForce GTX 1050 Ti (Desktop):
35.6  fps
284%
GeForce RTX 2070 Mobile:
101  fps
301%
GeForce RTX 2080 Max-Q:
102 111 ~ 107 fps
Doom

Doom

2016
high 1920x1080
GeForce RTX 2070 Mobile:
184  fps
GeForce RTX 2080 Max-Q:
131 134 ~ 133 fps
ultra 1920x1080
100%
GeForce GTX 1050 Ti (Desktop):
69  fps
230%
GeForce RTX 2070 Mobile:
159  fps
186%
GeForce RTX 2080 Max-Q:
127 129 ~ 128 fps
4K 3840x2160
100%
GeForce GTX 1050 Ti (Desktop):
23.3  fps
289%
GeForce RTX 2070 Mobile:
67.4  fps
322%
GeForce RTX 2080 Max-Q:
71.1 79.3 ~ 75 fps
low 1280x768
GeForce RTX 2070 Mobile:
112.4  fps
GeForce RTX 2080 Max-Q:
82.5  fps
med. 1920x1080
100%
GeForce GTX 1050 Ti (Desktop):
40.4 42.9 43.9 ~ 42 fps
243%
GeForce RTX 2070 Mobile:
102  fps
192%
GeForce RTX 2080 Max-Q:
80.7  fps
high 1920x1080
100%
GeForce GTX 1050 Ti (Desktop):
37.9 39.1 ~ 39 fps
253%
GeForce RTX 2070 Mobile:
98.6  fps
208%
GeForce RTX 2080 Max-Q:
81.3  fps
4K 3840x2160
100%
GeForce GTX 1050 Ti (Desktop):
12.8  fps
med. 1366x768
100%
GeForce GTX 1050 Ti (Desktop):
88  fps
high 1920x1080
100%
GeForce GTX 1050 Ti (Desktop):
34.5  fps
ultra 1920x1080
100%
GeForce GTX 1050 Ti (Desktop):
32.7  fps
high 1920x1080
GeForce RTX 2070 Mobile:
118  fps
GeForce RTX 2080 Max-Q:
113 117 127 ~ 119 fps
ultra 1920x1080
GeForce RTX 2070 Mobile:
93.1  fps
GeForce RTX 2080 Max-Q:
93 93.9 100 ~ 96 fps
4K 3840x2160
GeForce RTX 2070 Mobile:
46.3  fps
GeForce RTX 2080 Max-Q:
45.6 51.7 ~ 49 fps
low 1280x720
100%
GeForce GTX 1050 Ti (Desktop):
135  fps
med. 1920x1080
100%
GeForce GTX 1050 Ti (Desktop):
61  fps
high 1920x1080
100%
GeForce GTX 1050 Ti (Desktop):
54  fps
ultra 1920x1080
100%
GeForce GTX 1050 Ti (Desktop):
41  fps
low 1024x768
GeForce RTX 2070 Mobile:
120 210.5 211.8 218.2 ~ 190 fps
GeForce RTX 2080 Max-Q:
196.4 215 223.3 239.5 246 253.4 ~ 229 fps
med. 1366x768
GeForce RTX 2070 Mobile:
111.3 145.3 158.6 201.7 ~ 154 fps
GeForce RTX 2080 Max-Q:
163.6 165.7 174.7 176.7 182.8 185 ~ 175 fps
high 1920x1080
100%
GeForce GTX 1050 Ti (Desktop):
48.9  fps
258%
GeForce RTX 2070 Mobile:
92.2 130.7 132.8 148.5 ~ 126 fps
286%
GeForce RTX 2080 Max-Q:
131.9 138.8 139 139.8 143.8 146.5 ~ 140 fps
ultra 1920x1080
100%
GeForce GTX 1050 Ti (Desktop):
40.7  fps
268%
GeForce RTX 2070 Mobile:
89.4 109 115.2 122 ~ 109 fps
290%
GeForce RTX 2080 Max-Q:
108.6 109 113.1 124 126 126 ~ 118 fps
4K 3840x2160
GeForce RTX 2080 Max-Q:
52.4  fps
low 1024x768
100%
GeForce GTX 1050 Ti (Desktop):
272  fps
med. 1366x768
100%
GeForce GTX 1050 Ti (Desktop):
181  fps
high 1920x1080
100%
GeForce GTX 1050 Ti (Desktop):
95  fps
246%
GeForce RTX 2070 Mobile:
234  fps
207%
GeForce RTX 2080 Max-Q:
152 210 230 ~ 197 fps
ultra 1920x1080
100%
GeForce GTX 1050 Ti (Desktop):
79  fps
273%
GeForce RTX 2070 Mobile:
216  fps
239%
GeForce RTX 2080 Max-Q:
148 201 217 ~ 189 fps
4K 3840x2160
GeForce RTX 2070 Mobile:
93.3  fps
GeForce RTX 2080 Max-Q:
90.8 98.2 ~ 95 fps
ultra 1920x1080
100%
GeForce GTX 1050 Ti (Desktop):
61  fps
4K 3840x2160
100%
GeForce GTX 1050 Ti (Desktop):
21.6  fps
high 1920x1080
100%
GeForce GTX 1050 Ti (Desktop):
52.6  fps
ultra 1920x1080
100%
GeForce GTX 1050 Ti (Desktop):
22.9  fps
Fallout 4

Fallout 4

2015
ultra 1920x1080
100%
GeForce GTX 1050 Ti (Desktop):
46.4  fps
Anno 2205

Anno 2205

2015
high 1920x1080
100%
GeForce GTX 1050 Ti (Desktop):
61.8  fps
ultra 1920x1080
100%
GeForce GTX 1050 Ti (Desktop):
20.7  fps
ultra 1920x1080
100%
GeForce GTX 1050 Ti (Desktop):
113  fps
4K 3840 x 2160
100%
GeForce GTX 1050 Ti (Desktop):
35.7  fps
Mad Max

Mad Max

2015
ultra 1920x1080
100%
GeForce GTX 1050 Ti (Desktop):
79  fps
4K 3840x2160
100%
GeForce GTX 1050 Ti (Desktop):
26.9  fps
low 1280x720
100%
GeForce GTX 1050 Ti (Desktop):
178  fps
81%
GeForce RTX 2070 Mobile:
129.7 137.3 137.4 142 147.2 149 152 152 153 ~ 144 fps
81%
GeForce RTX 2080 Max-Q:
144.9  fps
med. 1366x768
100%
GeForce GTX 1050 Ti (Desktop):
161  fps
81%
GeForce RTX 2070 Mobile:
120.7 126.5 127.2 129.4 130 133 136 139 140 ~ 131 fps
82%
GeForce RTX 2080 Max-Q:
132.2  fps
high 1920x1080
100%
GeForce GTX 1050 Ti (Desktop):
141  fps
87%
GeForce RTX 2070 Mobile:
104.1 115 121.8 122.1 124 125 128 130 131 ~ 122 fps
90%
GeForce RTX 2080 Max-Q:
126.4  fps
ultra 1920x1080
100%
GeForce GTX 1050 Ti (Desktop):
125  fps
93%
GeForce RTX 2070 Mobile:
98.4 109.2 115 117 117.1 120 120 122 124 ~ 116 fps
96%
GeForce RTX 2080 Max-Q:
119.6  fps
4K 3840x2160
100%
GeForce GTX 1050 Ti (Desktop):
63  fps
low 1280x720
GeForce RTX 2070 Mobile:
214  fps
GeForce RTX 2080 Max-Q:
172  fps
med. 1366x768
GeForce RTX 2070 Mobile:
202  fps
GeForce RTX 2080 Max-Q:
161  fps
high 1920x1080
GeForce RTX 2070 Mobile:
159  fps
GeForce RTX 2080 Max-Q:
134  fps
ultra 1920x1080
GeForce RTX 2070 Mobile:
108  fps
GeForce RTX 2080 Max-Q:
92  fps
low 1024x768
GeForce RTX 2070 Mobile:
193.9 236.1 255.3 258 286.3 290.1 303.3 317.7 326.4 329.3 331.2 356.7 ~ 290 fps
GeForce RTX 2080 Max-Q:
255 263.4 273.9 274.5 277.6 279 286.3 287.9 292.5 294.7 295.5 299 305.4 325 326.6 ~ 289 fps
med. 1366x768
GeForce RTX 2070 Mobile:
154 197 204.1 208 223.1 226.7 227.2 241.3 244.5 244.8 245.5 249.9 ~ 222 fps
GeForce RTX 2080 Max-Q:
192.7 215.2 215.4 216 217.2 221.1 222.4 225.7 227.6 230.3 234 236.6 237.3 239.3 258.7 ~ 226 fps
high 1920x1080
100%
GeForce GTX 1050 Ti (Desktop):
49.4  fps
283%
GeForce RTX 2070 Mobile:
115.7 128.4 130 130 131.3 133.6 136 137 142 142 144.5 145.1 147.1 149.8 152.3 155.8 160.8 ~ 140 fps
291%
GeForce RTX 2080 Max-Q:
117.3 125.5 135 136 138 138.2 139 142 144.2 144.5 145 145.1 146.6 146.6 149.6 151 152.2 153.2 179.9 ~ 144 fps
ultra 1920x1080
100%
GeForce GTX 1050 Ti (Desktop):
24 27.5 ~ 26 fps
285%
GeForce RTX 2070 Mobile:
64 67 70.2 70.9 71.8 71.8 72 72.8 73 73 73.8 74.4 74.5 74.8 75.9 78.2 78.4 79.9 80.6 81 82.1 ~ 74 fps
304%
GeForce RTX 2080 Max-Q:
65.7 66.9 73.1 75.4 75.7 76.5 76.9 77.4 77.5 77.6 78 78.3 80.3 80.7 81 81.2 81.3 81.7 85.3 87.4 90.8 92.7 ~ 79 fps
4K 3840x2160
GeForce RTX 2070 Mobile:
49.5 50 57.4 ~ 52 fps
GeForce RTX 2080 Max-Q:
39.6 50.6 53 53.3 57.6 65.5 ~ 53 fps
low 1024x768
GeForce RTX 2070 Mobile:
254.5  fps
med. 1366x768
GeForce RTX 2070 Mobile:
160.6  fps
high 1920x1080
GeForce RTX 2070 Mobile:
199.7  fps
ultra 1920x1080
100%
GeForce GTX 1050 Ti (Desktop):
62.1  fps
183%
GeForce RTX 2070 Mobile:
113.6  fps
4K 3840x2160
100%
GeForce GTX 1050 Ti (Desktop):
52.7  fps
GTA V

GTA V

2015
low 1024x768
100%
GeForce GTX 1050 Ti (Desktop):
176  fps
98%
GeForce RTX 2070 Mobile:
163.4 178 179 ~ 173 fps
89%
GeForce RTX 2080 Max-Q:
140 171 ~ 156 fps
med. 1366x768
100%
GeForce GTX 1050 Ti (Desktop):
169  fps
98%
GeForce RTX 2070 Mobile:
155.7 170 172 ~ 166 fps
89%
GeForce RTX 2080 Max-Q:
135.3 166 ~ 151 fps
high 1920x1080
100%
GeForce GTX 1050 Ti (Desktop):
88.8  fps
163%
GeForce RTX 2070 Mobile:
126.6 148 160 ~ 145 fps
146%
GeForce RTX 2080 Max-Q:
115.4 144 ~ 130 fps
ultra 1920x1080
100%
GeForce GTX 1050 Ti (Desktop):
36.4 41.2 ~ 39 fps
205%
GeForce RTX 2070 Mobile:
71.4 82 87 ~ 80 fps
179%
GeForce RTX 2080 Max-Q:
62.6 77.2 ~ 70 fps
QHD 2560x1440
100%
GeForce GTX 1050 Ti (Desktop):
29.4  fps
4K 3840x2160
100%
GeForce GTX 1050 Ti (Desktop):
27.8  fps
266%
GeForce RTX 2080 Max-Q:
74  fps
ultra 1920x1080
100%
GeForce GTX 1050 Ti (Desktop):
39.9  fps
ultra 1920x1080
100%
GeForce GTX 1050 Ti (Desktop):
84  fps
ultra 1920x1080
100%
GeForce GTX 1050 Ti (Desktop):
58.2  fps
ultra 1920x1080
100%
GeForce GTX 1050 Ti (Desktop):
66  fps
4K 3840x2160
100%
GeForce GTX 1050 Ti (Desktop):
30.2  fps
low 1280x720
100%
GeForce GTX 1050 Ti (Desktop):
303.5  fps
112%
GeForce RTX 2070 Mobile:
231 304.5 325 332.8 352 355 362.2 391.4 400.7 ~ 339 fps
106%
GeForce RTX 2080 Max-Q:
276.8 280.1 297.6 306.4 307.6 312.6 314.6 316.8 323.8 326.9 330 331.1 349.6 350.6 396.1 ~ 321 fps
med. 1366x768
GeForce RTX 2070 Mobile:
208.9 249.3 294.5 305.3 305.4 309.3 316 345.6 346 ~ 298 fps
GeForce RTX 2080 Max-Q:
197.5 246.7 268 271 273 273.1 280.2 282.2 283.4 285.6 289.6 295 306 311.9 337.3 ~ 280 fps
high 1366x768
100%
GeForce GTX 1050 Ti (Desktop):
208  fps
133%
GeForce RTX 2070 Mobile:
193.1 229.8 272.2 276.3 288.9 291.9 292.5 320.2 320.9 ~ 276 fps
122%
GeForce RTX 2080 Max-Q:
172.5 187.8 232.3 239.6 251.7 252.1 252.3 254.1 255.1 262 263.6 272 278 284.1 285.9 321 ~ 254 fps
ultra 1920x1080
100%
GeForce GTX 1050 Ti (Desktop):
77.2 79 ~ 78 fps
214%
GeForce RTX 2070 Mobile:
136.9 154.3 163.7 164.6 167.4 170 172.9 181.3 187.8 ~ 167 fps
210%
GeForce RTX 2080 Max-Q:
118.9 137.6 156.9 161.5 163.7 164.7 165.6 165.7 166 166 166.5 170 176.5 177.7 179 189.5 ~ 164 fps
Crysis 3

Crysis 3

2013
ultra 1920x1080
100%
GeForce GTX 1050 Ti (Desktop):
35.8  fps
ultra 1920x1080
100%
GeForce GTX 1050 Ti (Desktop):
55.1  fps

Average Gaming NVIDIA GeForce GTX 1050 Ti (Desktop) → 100%

Average Gaming 30-70 fps → 100%

Average Gaming NVIDIA GeForce RTX 2070 Mobile → 246%

Average Gaming 30-70 fps → 294%

Average Gaming NVIDIA GeForce RTX 2080 Max-Q → 239%

Average Gaming 30-70 fps → 279%

NVIDIA GeForce GTX 1050 Ti (Desktop)lowmed.highultraQHD4K
Black Myth: Wukong13
Call of Duty Modern Warfare 2 20223118117
F1 2286.575.352.5
Halo Infinite6523.315.87.72
Guardians of the Galaxy553736352411
F1 202118588.871.7
Cyberpunk 2077 1.041.321.317
Flight Simulator 202056.125.618.112.18.6
F1 202044.732.317.6
Gears Tactics20071.744.332.620.6
Doom Eternal10162.955.552.939.3
Hunt Showdown10941.633.5
Escape from Tarkov50.940.232.4
Red Dead Redemption 27534.822.314.3
Call of Duty Modern Warfare 201943.233.924
FIFA 2014110762
Borderlands 311547.529.621.815
Control9429.921.3
F1 20191647352.837.429.318
Total War: Three Kingdoms15351.431.521.412.8
The Division 215653.641.431.521.510.2
Dirt Rally 2.01496752.332.323.513.4
Far Cry New Dawn874845412914
Metro Exodus64.732.82419.89.2
Apex Legends12855.646.74528.814.1
Just Cause 441.940.1
Darksiders III50.943.3
Battlefield V1406351.950.935.617.5
Farming Simulator 196020.3
Fallout 7646.430.7
Hitman 239.1
Call of Duty Black Ops 45347.341.6
Assassin´s Creed Odyssey484024
Forza Horizon 413369644520
FIFA 191057540.1
Shadow of the Tomb Raider312925
Strange Brigade16966.649.842.530.217
F1 2018136806342.429.518.3
Far Cry 536
X-Plane 11.1198897741.7
Kingdom Come: Deliverance35.226.6
Final Fantasy XV Benchmark6233.322.7
Fortnite6544.812.5
Playerunknown's Battlegrounds (PUBG)12755.149.535.511.4
Rocket League52.230.7
Prey1438266.623
Warhammer 40.000: Dawn of War III3025.9
Mass Effect Andromeda52.734.831.413.2
For Honor19871.46848.919.7
Resident Evil 77058.418.6
Watch Dogs 245.428.515.2
Dishonored 2827341.138.721.9
Call of Duty Infinite Warfare60.526.1
Titanfall 26256.618.5
Farming Simulator 1711351.1
Battlefield 11991446962.425.2
Civilization VI57.547.336.3
Mafia 368.241.822.1
FIFA 1718772
Deus Ex Mankind Divided61.432.722.8
No Man's Sky7944.620.7
Mirror's Edge Catalyst46.5
Overwatch1146835.6
Doom6923.3
Ashes of the Singularity423912.8
Hitman 20168834.532.7
Far Cry Primal135615441
Rise of the Tomb Raider48.940.7
Rainbow Six Siege2721819579
Star Wars Battlefront6121.6
Assassin's Creed Syndicate52.622.9
Fallout 446.4
Anno 220561.820.7
World of Warships11335.7
Mad Max7926.9
Dota 2 Reborn17816114112563
The Witcher 349.426
Dirt Rally62.152.7
GTA V17616988.83929.427.8
Dragon Age: Inquisition39.9
Alien: Isolation84
Middle-earth: Shadow of Mordor58.2
Battlefield 46630.2
BioShock Infinite303.520878
Crysis 335.8
Metro 203355.1
< 30 fps
< 60 fps
< 120 fps
≥ 120 fps

4
14
20
4
17
16
4
9
35
14
2
17
39
16
3
15
6
2
31
9
3
NVIDIA GeForce RTX 2070 Mobilelowmed.highultraQHD4K
F1 2021150139826334
Days Gone11510174.955.431.9
Mass Effect Legendary Edition11611210674
Resident Evil Village126126110
Outriders10694.381.760.532.8
Hitman 313612411377.141.4
Cyberpunk 2077 1.075.861.952.934.516.3
Immortals Fenyx Rising8272675536
Yakuza Like a Dragon10095.680.355.528.6
Call of Duty Black Ops Cold War94.980.772.551.727.7
Assassin´s Creed Valhalla8169594728
Dirt 588.269.441.335.326.3
Watch Dogs Legion93.181.656.141.623.4
FIFA 21225223211210206173
Star Wars Squadrons26523422821414078
Mafia Definitive Edition13398.189.660.530.6
Serious Sam 411973.971.461.354.5
Crysis Remastered13370.850.232.620.3
Flight Simulator 202070.660.148.935.326.816.3
Horizon Zero Dawn13110085675129
Death Stranding15312611511378.842.6
F1 20202061661471148750
Valorant237234230229202
Gears Tactics2371761218759.931.6
Doom Eternal23817015615210454.7
Hunt Showdown19512410365.831.3
Escape from Tarkov12112112011178.837.8
Red Dead Redemption 21229867433522.9
Star Wars Jedi Fallen Order106959273.437.3
Need for Speed Heat10494.2867863.937.5
Call of Duty Modern Warfare 20191991321229975.442.5
GRID 2019187152114796639.3
Ghost Recon Breakpoint12210694695229
FIFA 20265260215214231179
Borderlands 311097786345.124.2
Control185936946.923
F1 20192141821511099058
Total War: Three Kingdoms232.7129.988.563.1
Rage 2180122103101
Anno 18007340
The Division 212111296776033
Dirt Rally 2.01431197562.1
Anthem88.885796235.5
Far Cry New Dawn9492837442
Metro Exodus958666544226.1
Apex Legends14313112988.245.4
Just Cause 4169.5127979063.636.3
Darksiders III169.212210910176.737.8
Battlefield V111.612011610691.752.1
Farming Simulator 19194162141104
Hitman 294.586.183.372.437.9
Call of Duty Black Ops 414213511977.939.2
Assassin´s Creed Odyssey10084584831
Forza Horizon 413711311294
FIFA 19382287279277160
Shadow of the Tomb Raider12410096895833
Strange Brigade313183149125
F1 20181861521038451
Monster Hunter World1171038151.925.1
The Crew 26060606038.8
Far Cry 51471221131067640
X-Plane 11.111089580
Kingdom Come: Deliverance12597.373.252.426.2
Final Fantasy XV Benchmark1551037932.2
Fortnite23618814914193.545.5
Star Wars Battlefront 216314010675.339.8
Need for Speed Payback15714113590.148
Assassin´s Creed Origins84727164
Destiny 2206.1181.2169.5144.5
ELEX12111994.162.733.1
Middle-earth: Shadow of War1611279639
Playerunknown's Battlegrounds (PUBG)19617313046.3
Dirt 4242175104
Rocket League249247118
Prey14314013962.8
Ghost Recon Wildlands10698.956.839.1
For Honor16415611850.6
Resident Evil 734919416255.8
Dishonored 211710553.3
Battlefield 1165.4141.5120.6113.3
Civilization VI224.1163.6129.8121.1
Deus Ex Mankind Divided10359.836.9
Mirror's Edge Catalyst13112045.5
Overwatch291184101
Doom18415967.4
Ashes of the Singularity112.410298.6
The Division11893.146.3
Rise of the Tomb Raider190154126109
Rainbow Six Siege23421693.3
Dota 2 Reborn144131122116
Batman: Arkham Knight214202159108
The Witcher 32902221407452
Dirt Rally254.5160.6199.7113.6
GTA V17316614580
BioShock Infinite339298276167
< 30 fps
< 60 fps
< 120 fps
≥ 120 fps


10
39


34
52

1
50
43

12
55
20
1
21
33
5
16
46
7
4
NVIDIA GeForce RTX 2080 Max-Qlowmed.highultraQHD4K
Doom Eternal156140138134
Hunt Showdown184134121
Escape from Tarkov121121120117
Red Dead Redemption 2121102.672.845.6
Star Wars Jedi Fallen Order94.584.282.3
Need for Speed Heat85.66663.657.2
Call of Duty Modern Warfare 2019171.5126.7104.990.6
GRID 2019213.5187.6120.781.3
Ghost Recon Breakpoint105959271
FIFA 20214.6208.1197.7197.1
Borderlands 3128.8110.884.767.1
Control231.992.871.9
F1 2019188165137114
Total War: Three Kingdoms224.8126.188.865.5
Rage 22051129593
Anno 180098.593.977.741.2
The Division 213297897326
Dirt Rally 2.0157.8116.11227631.2
Anthem84.573.7797326.4
Far Cry New Dawn10994908136
Metro Exodus12990685720.9
Apex Legends143.7137.112111936
Just Cause 41391041006940
Darksiders III137120102957937
Battlefield V1371261179454
Farming Simulator 19153136126110
Hitman 27871686638.2
Call of Duty Black Ops 41441331288841
Assassin´s Creed Odyssey7971564731
FIFA 19249221216224175
Shadow of the Tomb Raider1309894875936
F1 20181741331028754
Monster Hunter World120108885528
The Crew 26060606039
Far Cry 512010493897639
X-Plane 11.1196847044
Kingdom Come: Deliverance11790675127
Final Fantasy XV Benchmark1261037834
Fortnite14313512410149
Star Wars Battlefront 21491331137941
Need for Speed Payback1191131109251
Assassin´s Creed Origins8273666139
ELEX119114966634
Middle-earth: Shadow of War1541229642
Ark Survival Evolved160.987.963.543.9
Playerunknown's Battlegrounds (PUBG)19917513650
Dirt 4219157104
Rocket League249246233118
Prey14214113966
Ghost Recon Wildlands96925841
For Honor267.216615912755
Resident Evil 735620717362
Dishonored 21049358
Battlefield 114013265
Deus Ex Mankind Divided1056239
Mirror's Edge Catalyst12511548
Overwatch273184107
Doom13312875
Ashes of the Singularity82.580.781.3
The Division1199649
Rise of the Tomb Raider22917514011852.4
Rainbow Six Siege19718995
Dota 2 Reborn144.9132.2126.4119.6
Batman: Arkham Knight17216113492
The Witcher 32892261447953
GTA V1561511307074
BioShock Infinite321280254164
< 30 fps
< 60 fps
< 120 fps
≥ 120 fps


7
29


27
32


34
33

7
39
15

4
14
1
5
30
8
1

Eine Liste mit weiteren Spielen und allen Grafikkarten finden Sie auf unserer Seite: Welches Spiel ist mit welcher Grafikkarte spielbar?

v1.28
log 20. 00:10:08

#0 ran 0s before starting gpusingle class +0s ... 0s

#1 checking url part for id 7582 +0s ... 0s

#2 checking url part for id 9551 +0s ... 0s

#3 checking url part for id 9621 +0s ... 0s

#4 redirected to Ajax server, took 1726783808s time from redirect:0 +0s ... 0s

#5 did not recreate cache, as it is less than 5 days old! Created at Thu, 19 Sep 2024 05:16:33 +0200 +0s ... 0s

#6 composed specs +0.005s ... 0.005s

#7 did output specs +0s ... 0.005s

#8 start showIntegratedCPUs +0s ... 0.005s

#9 getting avg benchmarks for device 7582 +0.02s ... 0.025s

#10 got single benchmarks 7582 +0.001s ... 0.026s

#11 getting avg benchmarks for device 9551 +0.004s ... 0.03s

#12 got single benchmarks 9551 +0.031s ... 0.061s

#13 getting avg benchmarks for device 9621 +0.004s ... 0.065s

#14 got single benchmarks 9621 +0.022s ... 0.088s

#15 got avg benchmarks for devices +0s ... 0.088s

#16 min, max, avg, median took s +0.052s ... 0.139s

#17 before gaming benchmark output +0s ... 0.14s

#18 Got 1775 rows for game benchmarks. +0.067s ... 0.206s

#19 composed SQL query for gamebenchmarks +0s ... 0.206s

#20 got data and put it in $dataArray +0.008s ... 0.214s

#21 benchmarks composed for output. +0.042s ... 0.257s

#22 calculated avg scores. +0s ... 0.257s

#23 return log +0.003s ... 0.259s

Teilen Sie diesen Artikel, um uns zu unterstützen. Jeder Link hilft!
> Notebook Test, Laptop Test und News > Benchmarks / Technik > Benchmarks / Technik > Grafikkarten Vergleich - Head 2 Head
Autor: Klaus Hinum,  8.09.2017 (Update:  1.07.2023)