NVIDIA GeForce GTX 1050 Max-Q vs NVIDIA GeForce GTX 1660 Ti Max-Q
NVIDIA GeForce GTX 1050 Max-Q ► remove from comparison
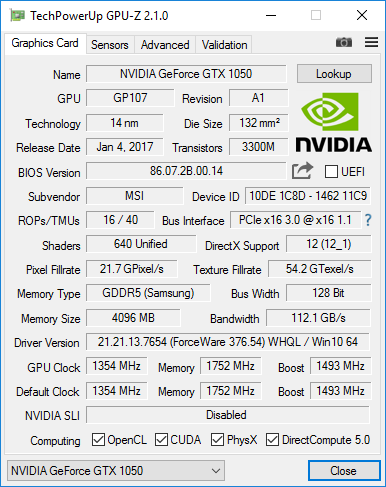
Die Nvidia GeForce GTX 1050 mit Max-Q Design ist eine Mittelklasse-GPU basierend auf der Pascal-Architektur und wurde im Januar 2018 vorgestellt. Je nach Kühlungsdesign ist sie 10-15% langsamer als eine GTX 1050 . Wie die GTX 1050, basiert die Max-Q Variante auf den GP107 Chp, der in 14 nm bei Samsung produziert wird.
Im Vergleich zur normalen GTX 1050 gibt es noch weitere Unterschiede als den Takt. Der Treiber wurde auf Effizienz (und nicht Leistung) optimiert (nur für die Max-Q Modelle), optimierte Spannungswandler für 1V Betreib, high-end Kühlungsmethoden und eine 40 dB Grenze für die Lüfterlautstärke (mit Taktanpasssungen um dies jederzeit zu gewährleisten) zeichnen die Max-Q Variante aus.
Features
Der GP107-Chip wird in einem 14-nm-FinFET-Prozess bei Samsung gefertigt und bietet eine Reihe neuer Features, unter anderem Support für DisplayPort 1.4 (ready), HDMI 2.0b, HDR, Simultaneous Multi-Projection (SMP) sowie verbessertes H.265 Video De- und Encoding (PlayReady 3.0). Eine genaue Auflistung der Verbesserungen und Features der neuen Pascal Desktop-GPUs finden Sie in unserem Pascal-Architektur-Artikel .
Performance
Die exakte Performance der GeForce GTX 1050 Max-Q kann sich in Abhängigkeit von der Kühlung des jeweiligen Notebooks stark unterscheiden. Nvidia gibt an das die durchschnittliche GTX 1050 mit Max-Q Design etwa 10 bis 15 Prozent langsamer ist als eine GTX 1050. Dadurch eignet sich die Grafikkarte am besten für Full HD und hoher (aber nicht maximaler) Detailstufe.
Leistungsaufnahme
Die Leistungsaufnahme der GeForce GTX 1050 Max-Q ist von Nvidia mit 34 bis 40 Watt angegeben (je nach Taktung) und damit deutlich geringer als die 53 Watt der normalen GeForce GTX 1050 . Dadurch eignet sich die Grafikkarte auch für dünne und leichte Notebooks.
NVIDIA GeForce GTX 1660 Ti Max-Q ► remove from comparison
Die Nvidia GeForce GTX 1660 Ti mit Max-Q Design für Laptops ist eine mobile Grafikkarte basierend auf der Turing Architektur. Sie ist gedacht für dünne und leichte Notebook und je nach Kühlungsdesign etwa 10-15% langsamer als eine normale GTX 1660 Ti für Laptops (22% geringerer Basis-Takt und 16% geringerer Boost-Takt). Sie basiert wie die Desktop-Version auf den TU116 Chip und wurde Ende April 2019 vorgestellt. Die GTX 1660 Serie bietet im Unterschied zu den stärkeren RTX 2000er Karten (z.B. RTX 2060 ) keine Raytracing und Tensor Kerne. Die Leistung sollte vergleichbar mit einer GTX 1070 Max-Q sein, jedoch bei deutlich geringerem Stromverbrauch von 60 Watt TGP (versus 80 Watt der Laptop 1660 Ti und 115 Watt der Desktop-Version).
Im April 2020 gab es einen Refresh der GeFroce GTX 1660 Ti Max-Q mit dem Codenamen N18E-G0-A1. Die Specs bleiben aber vergleichbar, der Chip ist im selben Package erhältlich wie die neuen RTX Chips (z.b. RTX 2070 Super ).
Bei der Turing Architektur gab es auch auf der Ebene der CUDA-Kerne deutliche Verbesserungen. Float und INT Operationen können nun gleichzeitig ausgeführt werden, der Cache wurde vereinheitlicht und verbessert und Adaptive Shading eingeführt. Nvidia spricht dadurch von einer bis zu 50% höheren Leistung pro Kern im Vergleich zu Pascal.
Der Stromverbrauch ist mit 60 Watt TGP (Total Graphics Power) von Nvidia spezifiziert und damit 20 Watt unterhalb der normalen (Max-P) Version . Dadurch eignet sich die GPU auch für dünnere Gaming-Laptops. Der verbaute TU116 Chip wird bei TSMC im 12nm FFN Verfahren gefertigt.
NVIDIA GeForce GTX 1050 Max-Q NVIDIA GeForce GTX 1660 Ti Max-Q GeForce GTX 1600 Serie Codename N17P-G0 Max-Q N18E-G0 Architektur Pascal Turing Pipelines 640 - unified 1536 - unified Kerntakt 999 - 1189 - 1139 - 1328 (Boost) MHz 1140 - 1335 (Boost) MHz Speichertakt 7000 MHz 12000 MHz Speicherbandbreite 128 Bit 192 Bit Speichertyp GDDR5 GDDR6 Max. Speichergröße 4 GB 6 GB Shared Memory nein nein API DirectX 12_1, OpenGL 4.5 DirectX 12_1, OpenGL 4.6 Stromverbrauch 34 - 40 Watt 60 Watt Herstellungsprozess 14 nm 12 nm Notebookgröße groß (17" z.B.) mittel (15.4" z.B.) Erscheinungsdatum 03.01.2018 23.04.2019 Herstellerseite www.nvidia.com www.nvidia.com
Benchmarks Performance Rating - 3DMark 11 + Fire Strike + Time Spy - GeForce GTX 1050 Max-Q
2.5 pt (8%)
...
NVIDIA GeForce GTX 1050 Max-Q
...
max:
Performance Rating - 3DMark 11 + Fire Strike + Time Spy - GeForce GTX 1660 Ti Max-Q
5.9 pt (18%)
...
NVIDIA GeForce GTX 1660 Ti Max-Q
...
max:
3DMark - 3DMark Time Spy Score
min: 1709 avg: 1754 median: 1753.5 (5%) max: 1798 Points
min: 4547 avg: 5197 median: 5072 (15%) max: 6395 Points
3DMark - 3DMark Time Spy Graphics
min: 1596 avg: 1615 median: 1615 (4%) max: 1634 Points
min: 4867 avg: 5089 median: 5084.5 (13%) max: 5440 Points
3DMark - 3DMark Ice Storm Unlimited Graphics
318811 Points (32%)
min: 220799 avg: 314100 median: 306910 (31%) max: 414592 Points
3DMark - 3DMark Ice Storm Extreme Graphics
22530 Points (3%)
min: 76153 avg: 110626 median: 110626 (13%) max: 145099 Points
3DMark - 3DMark Cloud Gate Score
min: 14739 avg: 17501 median: 18259.5 (17%) max: 18746 Points
min: 16807 avg: 29350 median: 33027 (31%) max: 39942 Points
3DMark - 3DMark Cloud Gate Graphics
min: 27059 avg: 33618 median: 35392 (9%) max: 36630 Points
min: 38321 avg: 63736 median: 63086 (16%) max: 89505 Points
3DMark - 3DMark Fire Strike Standard Score
min: 5114 avg: 5213 median: 5223 (9%) max: 5292 Points
min: 10103 avg: 11548 median: 11615 (20%) max: 12739 Points
3DMark - 3DMark Fire Strike Standard Graphics
min: 5616 avg: 5677 median: 5649.5 (6%) max: 5792 Points
min: 12903 avg: 13356 median: 13355 (15%) max: 13870 Points
3DMark - 3DMark Ice Storm Graphics
min: 36552 avg: 43792 median: 43792 (5%) max: 51032 Points
min: 59373 avg: 104094 median: 86295 (10%) max: 166615 Points
3DMark 11 - 3DM11 Performance Score
min: 7116 avg: 7354 median: 7347.5 (9%) max: 7603 Points
min: 12279 avg: 15364 median: 15913 (21%) max: 17377 Points
3DMark 11 - 3DM11 Performance GPU
min: 6874 avg: 7142 median: 7153.5 (6%) max: 7385 Points
min: 17010 avg: 17711 median: 17439 (15%) max: 18653 Points
3DMark Vantage + NVIDIA GeForce GTX 1050 Max-Q 3DMark Vantage - 3DM Vant. Perf. total
min: 26044 avg: 26081 median: 26080.5 (8%) max: 26117 Points
3DM Vant. Perf. total + NVIDIA GeForce GTX 1660 Ti Max-Q
31845 Points (9%)
3DM Vant. Perf. GPU no PhysX + NVIDIA GeForce GTX 1050 Max-Q 3DMark Vantage - 3DM Vant. Perf. GPU no PhysX
min: 25008 avg: 25293 median: 25292.5 (14%) max: 25577 Points
3DM Vant. Perf. GPU no PhysX + NVIDIA GeForce GTX 1660 Ti Max-Q
34951 Points (19%)
3DMark 06 3DMark 06 - Standard 1280x1024 + NVIDIA GeForce GTX 1050 Max-Q
min: 9694 avg: 19691 median: 19690.5 (26%) max: 29687 Points
3DMark 06 - Standard 1280x1024 + NVIDIA GeForce GTX 1660 Ti Max-Q
min: 24029 avg: 28247 median: 25211 (33%) max: 38536 Points
Unigine Valley 1.0 - Unigine Valley 1.0 DX
30.8 fps (9%)
Unigine Heaven 3.0 - Unigine Heaven 3.0 DX 11
70.2 fps (23%)
Unigine Heaven 3.0 - Unigine Heaven 3.0 OpenGL
65 fps (29%)
Unigine Heaven 2.1 - Heaven 2.1 high
min: 100.9 avg: 101.2 median: 101.2 (19%) max: 101.4 fps
Cinebench R10 Cinebench R10 Shading (32bit) + NVIDIA GeForce GTX 1050 Max-Q Cinebench R10 - Cinebench R10 Shading (32bit)
min: 1803 avg: 5147 median: 6811 (5%) max: 6828 Points
Cinebench R10 Shading (32bit) + NVIDIA GeForce GTX 1660 Ti Max-Q
min: 6820 avg: 9290 median: 8562.5 (6%) max: 13213 Points
Cinebench R11.5 Cinebench R11.5 OpenGL 64 Bit + NVIDIA GeForce GTX 1050 Max-Q Cinebench R11.5 - Cinebench R11.5 OpenGL 64 Bit
min: 20.54 avg: 47.4 median: 47.4 (16%) max: 74.3 fps
Cinebench R11.5 OpenGL 64 Bit + NVIDIA GeForce GTX 1660 Ti Max-Q
min: 49.83 avg: 59.5 median: 59.5 (20%) max: 69.2 fps
Cinebench R15 + NVIDIA GeForce GTX 1050 Max-Q Cinebench R15 - Cinebench R15 OpenGL 64 Bit
min: 64.5 avg: 100.9 median: 109.5 (6%) max: 119.9 fps
Cinebench R15 OpenGL 64 Bit + NVIDIA GeForce GTX 1660 Ti Max-Q
min: 78.2 avg: 100.5 median: 96.9 (6%) max: 130.7 fps
Cinebench R15 OpenGL Ref. Match 64 Bit + NVIDIA GeForce GTX 1050 Max-Q Cinebench R15 - Cinebench R15 OpenGL Ref. Match 64 Bit
99.6 % (100%)
Cinebench R15 OpenGL Ref. Match 64 Bit + NVIDIA GeForce GTX 1660 Ti Max-Q
99.6 % (100%)
GFXBench - GFXBench 5.0 Aztec Ruins High Tier Offscreen
48.1 fps (9%)
110.2 fps (20%)
GFXBench - GFXBench 5.0 Aztec Ruins Normal Tier Offscreen
128.3 fps (10%)
253.8 fps (19%)
GFXBench - GFXBench Car Chase Offscreen
108.1 fps (12%)
227.4 fps (26%)
GFXBench 3.1 - GFXBench Manhattan ES 3.1 Offscreen
165.2 fps (3%)
345.8 fps (7%)
GFXBench 3.0 - GFXBench 3.0 Manhattan Offscreen
223 fps (13%)
360.6 fps (21%)
GFXBench (DX / GLBenchmark) 2.7 + NVIDIA GeForce GTX 1050 Max-Q GFXBench (DX / GLBenchmark) 2.7 - GFXBench T-Rex HD Offscreen C24Z16
441.6 fps (4%)
GFXBench T-Rex HD Offscreen C24Z16 + NVIDIA GeForce GTX 1660 Ti Max-Q
943 fps (8%)
LuxMark v2.0 64Bit - LuxMark v2.0 Room GPU
min: 967 avg: 968 median: 967.5 (3%) max: 968 Samples/s
2141 Samples/s (8%)
LuxMark v2.0 64Bit - LuxMark v2.0 Sala GPU
min: 1692 avg: 1702 median: 1702 (3%) max: 1712 Samples/s
4254 Samples/s (7%)
ComputeMark v2.1 - ComputeMark v2.1 Result
min: 4236 avg: 4343 median: 4342.5 (5%) max: 4449 Points
10027 Points (11%)
Power Consumption - Furmark Stress Test Power Consumption - external Monitor *
min: 77.6 avg: 86.3 median: 86.3 (12%) max: 95 Watt
Power Consumption - The Witcher 3 Power Consumption - external Monitor *
min: 92 avg: 96.6 median: 96.6 (13%) max: 101.2 Watt
Power Consumption - Witcher 3 Power Consumption *
68 Watt (15%)
min: 94.2 avg: 104.8 median: 106.9 (24%) max: 121 Watt
Power Consumption - Witcher 3 ultra Power Efficiency
0.3 fps per Watt (28%)
min: 0.4388 avg: 0.5 median: 0.5 (43%) max: 0.537 fps per Watt
Power Consumption - Witcher 3 ultra Power Efficiency - external Monitor
min: 0.4822 avg: 0.5 median: 0.5 (44%) max: 0.578 fps per Watt
Emissions Witcher 3 Fan Noise + NVIDIA GeForce GTX 1050 Max-Q Emissions - Witcher 3 Fan Noise
37.4 dB(A) (60%)
Witcher 3 Fan Noise + NVIDIA GeForce GTX 1660 Ti Max-Q
min: 34 avg: 43.4 median: 43.7 (70%) max: 53.8 dB(A)
Clock Speed - GPU Clock Witcher 3 ultra
1501 MHz (59%)
Clock Speed - GPU Clock Speed Furmark
1062 MHz (42%)
Average Benchmarks NVIDIA GeForce GTX 1050 Max-Q → 100% n=27 Average Benchmarks NVIDIA GeForce GTX 1660 Ti Max-Q → 201% n=27
- Bereich der Benchmarkergebnisse für diese Grafikkarte
- Durchschnittliche Benchmarkergebnisse für diese Grafikkarte
* Smaller numbers mean a higher performance
1 This benchmark is not used for the average calculation
Spiele-Benchmarks Die folgenden Benchmarks basieren auf unseren Spieletests mit Testnotebooks. Die Performance dieser Grafikkarte bei den gelisteten Spielen ist abhängig von der verwendeten CPU, Speicherausstattung, Treiber und auch Betriebssystem. Dadurch müssen die untenstehenden Werte nicht repräsentativ sein. Detaillierte Informationen über das verwendete System sehen Sie nach einem Klick auf den fps-Wert.
GeForce GTX 1660 Ti Max-Q:
55.1 fps
GeForce GTX 1660 Ti Max-Q:
49.4 fps
GeForce GTX 1660 Ti Max-Q:
37.1 fps
GeForce GTX 1660 Ti Max-Q:
25.3 fps
GeForce GTX 1660 Ti Max-Q:
119 fps
GeForce GTX 1660 Ti Max-Q:
78 fps
GeForce GTX 1660 Ti Max-Q:
65 fps
GeForce GTX 1660 Ti Max-Q:
51 fps
GeForce GTX 1660 Ti Max-Q:
136.1 fps
GeForce GTX 1660 Ti Max-Q:
87.7 fps
GeForce GTX 1660 Ti Max-Q:
81.3 fps
GeForce GTX 1660 Ti Max-Q:
78.4 fps
GeForce GTX 1660 Ti Max-Q:
219 fps
GeForce GTX 1660 Ti Max-Q:
130 fps
GeForce GTX 1660 Ti Max-Q:
112 fps
GeForce GTX 1660 Ti Max-Q:
79 fps
GeForce GTX 1660 Ti Max-Q:
214.7 fps
GeForce GTX 1660 Ti Max-Q:
130.2 fps
GeForce GTX 1660 Ti Max-Q:
79.9 fps
GeForce GTX 1660 Ti Max-Q:
56.1 fps
GeForce GTX 1660 Ti Max-Q:
168.9 fps
GeForce GTX 1660 Ti Max-Q:
101.7 fps
GeForce GTX 1660 Ti Max-Q:
95.4 fps
GeForce GTX 1660 Ti Max-Q:
93.4 fps
100%
GeForce GTX 1050 Max-Q:
83.1 fps
213%
GeForce GTX 1660 Ti Max-Q:
176.8 fps
100%
GeForce GTX 1050 Max-Q:
32.5 fps
250%
GeForce GTX 1660 Ti Max-Q:
81.2 fps
100%
GeForce GTX 1050 Max-Q:
26.4 fps
240%
GeForce GTX 1660 Ti Max-Q:
63.3 fps
100%
GeForce GTX 1050 Max-Q:
15.4 fps
100%
GeForce GTX 1050 Max-Q:
7.5 fps
GeForce GTX 1660 Ti Max-Q:
121.2 fps
GeForce GTX 1660 Ti Max-Q:
98.3 fps
GeForce GTX 1660 Ti Max-Q:
90.5 fps
GeForce GTX 1660 Ti Max-Q:
87.7 fps
100%
GeForce GTX 1050 Max-Q:
35.1 fps
328%
GeForce GTX 1660 Ti Max-Q:
115.1 fps
100%
GeForce GTX 1050 Max-Q:
25.3 fps
283%
GeForce GTX 1660 Ti Max-Q:
71.7 fps
100%
GeForce GTX 1050 Max-Q:
16.1 fps
293%
GeForce GTX 1660 Ti Max-Q:
47.2 fps
100%
GeForce GTX 1050 Max-Q:
9.8 fps
300%
GeForce GTX 1660 Ti Max-Q:
29.4 fps
100%
GeForce GTX 1050 Max-Q:
43.6 fps
210%
GeForce GTX 1660 Ti Max-Q:
91.5 fps
100%
GeForce GTX 1050 Max-Q:
35.8 fps
218%
GeForce GTX 1660 Ti Max-Q:
78.1 fps
100%
GeForce GTX 1050 Max-Q:
31.1 fps
233%
GeForce GTX 1660 Ti Max-Q:
72.4 fps
100%
GeForce GTX 1050 Max-Q:
19.9 fps
100%
GeForce GTX 1050 Max-Q:
9.9 fps
100%
GeForce GTX 1050 Max-Q:
61.3 fps
156%
GeForce GTX 1660 Ti Max-Q:
95.8 fps
100%
GeForce GTX 1050 Max-Q:
34.4 fps
241%
GeForce GTX 1660 Ti Max-Q:
83 fps
100%
GeForce GTX 1050 Max-Q:
29.8 fps
248%
GeForce GTX 1660 Ti Max-Q:
73.9 fps
100%
GeForce GTX 1050 Max-Q:
27.7 fps
242%
GeForce GTX 1660 Ti Max-Q:
66.9 fps
100%
GeForce GTX 1050 Max-Q:
19.5 fps
100%
GeForce GTX 1050 Max-Q:
10 fps
100%
GeForce GTX 1050 Max-Q:
56.4 fps
240%
GeForce GTX 1660 Ti Max-Q:
135.2 fps
100%
GeForce GTX 1050 Max-Q:
36.1 fps
244%
GeForce GTX 1660 Ti Max-Q:
88 fps
100%
GeForce GTX 1050 Max-Q:
28.7 fps
253%
GeForce GTX 1660 Ti Max-Q:
72.6 fps
100%
GeForce GTX 1050 Max-Q:
25.7 fps
244%
GeForce GTX 1660 Ti Max-Q:
62.6 fps
100%
GeForce GTX 1050 Max-Q:
17.3 fps
100%
GeForce GTX 1050 Max-Q:
9.1 fps
100%
GeForce GTX 1050 Max-Q:
89.1 fps
127%
GeForce GTX 1660 Ti Max-Q:
112.9 fps
100%
GeForce GTX 1050 Max-Q:
41.2 fps
210%
GeForce GTX 1660 Ti Max-Q:
86.5 fps
100%
GeForce GTX 1050 Max-Q:
29.2 fps
247%
GeForce GTX 1660 Ti Max-Q:
72 fps
100%
GeForce GTX 1050 Max-Q:
21.3 fps
276%
GeForce GTX 1660 Ti Max-Q:
58.7 fps
100%
GeForce GTX 1050 Max-Q:
11.7 fps
100%
GeForce GTX 1050 Max-Q:
7.3 fps
100%
GeForce GTX 1050 Max-Q:
56 fps
177%
GeForce GTX 1660 Ti Max-Q:
83 114 ~ 99 fps
100%
GeForce GTX 1050 Max-Q:
31 fps
226%
GeForce GTX 1660 Ti Max-Q:
68 72 ~ 70 fps
100%
GeForce GTX 1050 Max-Q:
29 fps
228%
GeForce GTX 1660 Ti Max-Q:
65 66 ~ 66 fps
100%
GeForce GTX 1050 Max-Q:
19 fps
263%
GeForce GTX 1660 Ti Max-Q:
48 51 ~ 50 fps
100%
GeForce GTX 1050 Max-Q:
11 fps
100%
GeForce GTX 1050 Max-Q:
6 fps
100%
GeForce GTX 1050 Max-Q:
200.7 fps
74%
GeForce GTX 1660 Ti Max-Q:
147.9 fps
100%
GeForce GTX 1050 Max-Q:
105.2 fps
138%
GeForce GTX 1660 Ti Max-Q:
145.4 fps
100%
GeForce GTX 1050 Max-Q:
100.7 fps
140%
GeForce GTX 1660 Ti Max-Q:
141 fps
100%
GeForce GTX 1050 Max-Q:
86.4 fps
161%
GeForce GTX 1660 Ti Max-Q:
139.3 fps
100%
GeForce GTX 1050 Max-Q:
69.4 fps
100%
GeForce GTX 1050 Max-Q:
47.1 fps
100%
GeForce GTX 1050 Max-Q:
81.3 fps
125%
GeForce GTX 1660 Ti Max-Q:
87 116.5 ~ 102 fps
100%
GeForce GTX 1050 Max-Q:
35.3 fps
218%
GeForce GTX 1660 Ti Max-Q:
72.1 81.5 ~ 77 fps
100%
GeForce GTX 1050 Max-Q:
22.5 fps
240%
GeForce GTX 1660 Ti Max-Q:
52.9 54.9 ~ 54 fps
100%
GeForce GTX 1050 Max-Q:
16.5 fps
255%
GeForce GTX 1660 Ti Max-Q:
41.5 42.3 ~ 42 fps
100%
GeForce GTX 1050 Max-Q:
11.6 fps
100%
GeForce GTX 1050 Max-Q:
4.9 fps
100%
GeForce GTX 1050 Max-Q:
67.8 fps
233%
GeForce GTX 1660 Ti Max-Q:
158.3 fps
100%
GeForce GTX 1050 Max-Q:
23 fps
277%
GeForce GTX 1660 Ti Max-Q:
63.7 fps
100%
GeForce GTX 1050 Max-Q:
16.8 fps
280%
GeForce GTX 1660 Ti Max-Q:
47.1 fps
100%
GeForce GTX 1050 Max-Q:
10.5 fps
100%
GeForce GTX 1050 Max-Q:
5.1 fps
100%
GeForce GTX 1050 Max-Q:
134 fps
126%
GeForce GTX 1660 Ti Max-Q:
155 183 ~ 169 fps
100%
GeForce GTX 1050 Max-Q:
58 fps
224%
GeForce GTX 1660 Ti Max-Q:
119 140 ~ 130 fps
100%
GeForce GTX 1050 Max-Q:
49 fps
229%
GeForce GTX 1660 Ti Max-Q:
106 117 ~ 112 fps
100%
GeForce GTX 1050 Max-Q:
43 fps
172%
GeForce GTX 1660 Ti Max-Q:
71 77 ~ 74 fps
100%
GeForce GTX 1050 Max-Q:
27 fps
100%
GeForce GTX 1050 Max-Q:
15 fps
100%
GeForce GTX 1050 Max-Q:
119.3 fps
148%
GeForce GTX 1660 Ti Max-Q:
144.1 209.4 ~ 177 fps
100%
GeForce GTX 1050 Max-Q:
38.5 fps
221%
GeForce GTX 1660 Ti Max-Q:
76.5 93.1 ~ 85 fps
100%
GeForce GTX 1050 Max-Q:
23.2 fps
241%
GeForce GTX 1660 Ti Max-Q:
54.7 57.1 ~ 56 fps
100%
GeForce GTX 1050 Max-Q:
16.9 fps
243%
GeForce GTX 1660 Ti Max-Q:
41.1 41.6 ~ 41 fps
100%
GeForce GTX 1050 Max-Q:
6.5 fps
100%
GeForce GTX 1050 Max-Q:
3.3 fps
100%
GeForce GTX 1050 Max-Q:
69.5 fps
217%
GeForce GTX 1660 Ti Max-Q:
146.4 154.7 ~ 151 fps
100%
GeForce GTX 1050 Max-Q:
31.1 fps
238%
GeForce GTX 1660 Ti Max-Q:
70.9 76.2 ~ 74 fps
100%
GeForce GTX 1050 Max-Q:
26.6 fps
233%
GeForce GTX 1660 Ti Max-Q:
58.7 65.8 ~ 62 fps
100%
GeForce GTX 1050 Max-Q:
26 fps
238%
GeForce GTX 1660 Ti Max-Q:
58.2 64.8 ~ 62 fps
100%
GeForce GTX 1050 Max-Q:
16.3 fps
100%
GeForce GTX 1050 Max-Q:
4.9 fps
100%
GeForce GTX 1050 Max-Q:
73.2 fps
101%
GeForce GTX 1660 Ti Max-Q:
59.6 87.9 ~ 74 fps
100%
GeForce GTX 1050 Max-Q:
45.8 fps
155%
GeForce GTX 1660 Ti Max-Q:
58.7 83.2 ~ 71 fps
100%
GeForce GTX 1050 Max-Q:
26.5 fps
208%
GeForce GTX 1660 Ti Max-Q:
45.3 64.1 ~ 55 fps
100%
GeForce GTX 1050 Max-Q:
14.1 fps
213%
GeForce GTX 1660 Ti Max-Q:
26 33.2 ~ 30 fps
100%
GeForce GTX 1050 Max-Q:
10.1 fps
100%
GeForce GTX 1050 Max-Q:
6.1 fps
100%
GeForce GTX 1050 Max-Q:
73 fps
173%
GeForce GTX 1660 Ti Max-Q:
110 142 ~ 126 fps
100%
GeForce GTX 1050 Max-Q:
34 fps
247%
GeForce GTX 1660 Ti Max-Q:
80 87 ~ 84 fps
100%
GeForce GTX 1050 Max-Q:
27 fps
252%
GeForce GTX 1660 Ti Max-Q:
66 69 ~ 68 fps
100%
GeForce GTX 1050 Max-Q:
19 fps
263%
GeForce GTX 1660 Ti Max-Q:
49 50 ~ 50 fps
100%
GeForce GTX 1050 Max-Q:
12 fps
100%
GeForce GTX 1050 Max-Q:
6 fps
100%
GeForce GTX 1050 Max-Q:
142.1 fps
132%
GeForce GTX 1660 Ti Max-Q:
181.2 194.2 ~ 188 fps
100%
GeForce GTX 1050 Max-Q:
45.7 fps
265%
GeForce GTX 1660 Ti Max-Q:
102.6 139.9 ~ 121 fps
100%
GeForce GTX 1050 Max-Q:
38.8 fps
247%
GeForce GTX 1660 Ti Max-Q:
88.7 103.2 ~ 96 fps
100%
GeForce GTX 1050 Max-Q:
21.8 fps
266%
GeForce GTX 1660 Ti Max-Q:
57.3 59.2 ~ 58 fps
100%
GeForce GTX 1050 Max-Q:
16.1 fps
100%
GeForce GTX 1050 Max-Q:
8.8 fps
100%
GeForce GTX 1050 Max-Q:
58.2 fps
92%
GeForce GTX 1660 Ti Max-Q:
53.6 fps
100%
GeForce GTX 1050 Max-Q:
29.9 fps
164%
GeForce GTX 1660 Ti Max-Q:
48.9 fps
100%
GeForce GTX 1050 Max-Q:
28.6 fps
171%
GeForce GTX 1660 Ti Max-Q:
48.8 fps
100%
GeForce GTX 1050 Max-Q:
23.5 fps
197%
GeForce GTX 1660 Ti Max-Q:
46.4 fps
100%
GeForce GTX 1050 Max-Q:
13.5 fps
100%
GeForce GTX 1050 Max-Q:
6.9 fps
100%
GeForce GTX 1050 Max-Q:
69 fps
141%
GeForce GTX 1660 Ti Max-Q:
97 fps
100%
GeForce GTX 1050 Max-Q:
39 fps
208%
GeForce GTX 1660 Ti Max-Q:
81 fps
100%
GeForce GTX 1050 Max-Q:
37 fps
211%
GeForce GTX 1660 Ti Max-Q:
78 fps
100%
GeForce GTX 1050 Max-Q:
34 fps
209%
GeForce GTX 1660 Ti Max-Q:
71 fps
100%
GeForce GTX 1050 Max-Q:
24 fps
100%
GeForce GTX 1050 Max-Q:
12 fps
100%
GeForce GTX 1050 Max-Q:
52.1 fps
100%
GeForce GTX 1050 Max-Q:
24.9 fps
241%
GeForce GTX 1660 Ti Max-Q:
53.9 60 66.5 ~ 60 fps
100%
GeForce GTX 1050 Max-Q:
18.7 fps
100%
GeForce GTX 1050 Max-Q:
14.6 fps
100%
GeForce GTX 1050 Max-Q:
11.4 fps
100%
GeForce GTX 1050 Max-Q:
7.1 fps
100%
GeForce GTX 1050 Max-Q:
107.9 fps
133%
GeForce GTX 1660 Ti Max-Q:
144 144 ~ 144 fps
100%
GeForce GTX 1050 Max-Q:
44.4 fps
270%
GeForce GTX 1660 Ti Max-Q:
105.3 133.9 ~ 120 fps
100%
GeForce GTX 1050 Max-Q:
35.3 fps
269%
GeForce GTX 1660 Ti Max-Q:
90.1 99.6 ~ 95 fps
100%
GeForce GTX 1050 Max-Q:
35.3 fps
266%
GeForce GTX 1660 Ti Max-Q:
89 99.6 ~ 94 fps
100%
GeForce GTX 1050 Max-Q:
24.8 fps
100%
GeForce GTX 1050 Max-Q:
12.7 fps
GeForce GTX 1660 Ti Max-Q:
135.6 fps
100%
GeForce GTX 1050 Max-Q:
33.6 fps
255%
GeForce GTX 1660 Ti Max-Q:
85.8 fps
100%
GeForce GTX 1050 Max-Q:
37.2 fps
208%
GeForce GTX 1660 Ti Max-Q:
77.4 fps
100%
GeForce GTX 1050 Max-Q:
31.5 fps
231%
GeForce GTX 1660 Ti Max-Q:
72.8 fps
100%
GeForce GTX 1050 Max-Q:
46.1 fps
100%
GeForce GTX 1050 Max-Q:
39.7 fps
100%
GeForce GTX 1050 Max-Q:
36.5 fps
200%
GeForce GTX 1660 Ti Max-Q:
61 73 85 ~ 73 fps
GeForce GTX 1660 Ti Max-Q:
37.9 fps
100%
GeForce GTX 1050 Max-Q:
183.8 fps
100%
GeForce GTX 1050 Max-Q:
104.8 fps
100%
GeForce GTX 1050 Max-Q:
64.7 fps
100%
GeForce GTX 1050 Max-Q:
46.6 fps
100%
GeForce GTX 1050 Max-Q:
31.5 fps
100%
GeForce GTX 1050 Max-Q:
15.5 fps
GeForce GTX 1660 Ti Max-Q:
115.2 fps
GeForce GTX 1660 Ti Max-Q:
87.9 fps
GeForce GTX 1660 Ti Max-Q:
84.6 fps
GeForce GTX 1660 Ti Max-Q:
83.1 fps
100%
GeForce GTX 1050 Max-Q:
56 fps
120%
GeForce GTX 1660 Ti Max-Q:
48 64 90 ~ 67 fps
100%
GeForce GTX 1050 Max-Q:
37 fps
154%
GeForce GTX 1660 Ti Max-Q:
43 56 71 ~ 57 fps
100%
GeForce GTX 1050 Max-Q:
31 fps
161%
GeForce GTX 1660 Ti Max-Q:
39 51 60 ~ 50 fps
100%
GeForce GTX 1050 Max-Q:
16 fps
250%
GeForce GTX 1660 Ti Max-Q:
33 42 44 ~ 40 fps
100%
GeForce GTX 1050 Max-Q:
10 fps
100%
GeForce GTX 1050 Max-Q:
6 fps
100%
GeForce GTX 1050 Max-Q:
96.5 fps
100%
GeForce GTX 1050 Max-Q:
100.8 fps
100%
GeForce GTX 1050 Max-Q:
44 57 ~ 51 fps
188%
GeForce GTX 1660 Ti Max-Q:
62 82 113 126 ~ 96 fps
100%
GeForce GTX 1050 Max-Q:
27 33 ~ 30 fps
233%
GeForce GTX 1660 Ti Max-Q:
53 57 83 85 ~ 70 fps
100%
GeForce GTX 1050 Max-Q:
25 26 ~ 26 fps
246%
GeForce GTX 1660 Ti Max-Q:
52 53 74 75 ~ 64 fps
100%
GeForce GTX 1050 Max-Q:
22 23 ~ 23 fps
248%
GeForce GTX 1660 Ti Max-Q:
49 49 64 67 ~ 57 fps
100%
GeForce GTX 1050 Max-Q:
16 fps
100%
GeForce GTX 1050 Max-Q:
8 fps
100%
GeForce GTX 1050 Max-Q:
104 fps
100%
GeForce GTX 1050 Max-Q:
63 fps
100%
GeForce GTX 1050 Max-Q:
47 fps
100%
GeForce GTX 1050 Max-Q:
29 fps
100%
GeForce GTX 1050 Max-Q:
13 fps
100%
GeForce GTX 1050 Max-Q:
73.7 fps
91%
GeForce GTX 1660 Ti Max-Q:
66.9 fps
100%
GeForce GTX 1050 Max-Q:
32 fps
185%
GeForce GTX 1660 Ti Max-Q:
59.3 fps
100%
GeForce GTX 1050 Max-Q:
24 fps
248%
GeForce GTX 1660 Ti Max-Q:
59.5 fps
100%
GeForce GTX 1050 Max-Q:
20 fps
254%
GeForce GTX 1660 Ti Max-Q:
50.8 fps
100%
GeForce GTX 1050 Max-Q:
5.8 fps
100%
GeForce GTX 1050 Max-Q:
42 fps
100%
GeForce GTX 1050 Max-Q:
37 fps
100%
GeForce GTX 1050 Max-Q:
33.4 fps
100%
GeForce GTX 1050 Max-Q:
10.4 fps
100%
GeForce GTX 1050 Max-Q:
66 71 ~ 69 fps
125%
GeForce GTX 1660 Ti Max-Q:
68 103 ~ 86 fps
100%
GeForce GTX 1050 Max-Q:
35 38 ~ 37 fps
186%
GeForce GTX 1660 Ti Max-Q:
54 84 ~ 69 fps
100%
GeForce GTX 1050 Max-Q:
33 35 ~ 34 fps
194%
GeForce GTX 1660 Ti Max-Q:
53 79 ~ 66 fps
100%
GeForce GTX 1050 Max-Q:
30 32 ~ 31 fps
200%
GeForce GTX 1660 Ti Max-Q:
50 74 ~ 62 fps
100%
GeForce GTX 1050 Max-Q:
22 fps
100%
GeForce GTX 1050 Max-Q:
10 11 ~ 11 fps
273%
GeForce GTX 1660 Ti Max-Q:
30 fps
100%
GeForce GTX 1050 Max-Q:
429.1 fps
88%
GeForce GTX 1660 Ti Max-Q:
376.8 fps
100%
GeForce GTX 1050 Max-Q:
132.4 fps
163%
GeForce GTX 1660 Ti Max-Q:
215.9 fps
100%
GeForce GTX 1050 Max-Q:
51.4 fps
228%
GeForce GTX 1660 Ti Max-Q:
117.3 fps
100%
GeForce GTX 1050 Max-Q:
32.5 fps
100%
GeForce GTX 1050 Max-Q:
16 fps
100%
GeForce GTX 1050 Max-Q:
88.8 fps
100%
GeForce GTX 1050 Max-Q:
80.9 fps
100%
GeForce GTX 1050 Max-Q:
65.1 fps
100%
GeForce GTX 1050 Max-Q:
30.3 fps
100%
GeForce GTX 1050 Max-Q:
82.1 fps
153%
GeForce GTX 1660 Ti Max-Q:
125.6 fps
100%
GeForce GTX 1050 Max-Q:
36.8 fps
249%
GeForce GTX 1660 Ti Max-Q:
91.7 fps
100%
GeForce GTX 1050 Max-Q:
29.5 fps
262%
GeForce GTX 1660 Ti Max-Q:
77.3 fps
100%
GeForce GTX 1050 Max-Q:
21.5 fps
250%
GeForce GTX 1660 Ti Max-Q:
53.7 fps
100%
GeForce GTX 1050 Max-Q:
6 fps
100%
GeForce GTX 1050 Max-Q:
56.9 fps
100%
GeForce GTX 1050 Max-Q:
29.3 fps
100%
GeForce GTX 1050 Max-Q:
20.6 fps
243%
GeForce GTX 1660 Ti Max-Q:
44.9 50 54.6 ~ 50 fps
100%
GeForce GTX 1050 Max-Q:
7.9 fps
100%
GeForce GTX 1050 Max-Q:
142.8 fps
97%
GeForce GTX 1660 Ti Max-Q:
138 fps
100%
GeForce GTX 1050 Max-Q:
111.8 fps
82%
GeForce GTX 1660 Ti Max-Q:
92.2 fps
100%
GeForce GTX 1050 Max-Q:
49.4 fps
181%
GeForce GTX 1660 Ti Max-Q:
89.5 fps
100%
GeForce GTX 1050 Max-Q:
36.5 fps
215%
GeForce GTX 1660 Ti Max-Q:
78.6 fps
100%
GeForce GTX 1050 Max-Q:
9.3 fps
100%
GeForce GTX 1050 Max-Q:
82.5 fps
100%
GeForce GTX 1050 Max-Q:
56.5 fps
100%
GeForce GTX 1050 Max-Q:
48.8 fps
100%
GeForce GTX 1050 Max-Q:
32.7 fps
100%
GeForce GTX 1050 Max-Q:
7.4 fps
100%
GeForce GTX 1050 Max-Q:
144.8 fps
100%
GeForce GTX 1050 Max-Q:
99.6 fps
100%
GeForce GTX 1050 Max-Q:
46.7 fps
100%
GeForce GTX 1050 Max-Q:
36.7 fps
100%
GeForce GTX 1050 Max-Q:
16.1 fps
100%
GeForce GTX 1050 Max-Q:
59 fps
100%
GeForce GTX 1050 Max-Q:
40 fps
100%
GeForce GTX 1050 Max-Q:
35 fps
100%
GeForce GTX 1050 Max-Q:
28 fps
100%
GeForce GTX 1050 Max-Q:
11 fps
100%
GeForce GTX 1050 Max-Q:
82.2 fps
100%
GeForce GTX 1050 Max-Q:
57.4 fps
100%
GeForce GTX 1050 Max-Q:
51.6 fps
100%
GeForce GTX 1050 Max-Q:
38.1 fps
100%
GeForce GTX 1050 Max-Q:
13.5 fps
100%
GeForce GTX 1050 Max-Q:
97 fps
94%
GeForce GTX 1660 Ti Max-Q:
91 fps
100%
GeForce GTX 1050 Max-Q:
44 fps
186%
GeForce GTX 1660 Ti Max-Q:
82 fps
100%
GeForce GTX 1050 Max-Q:
31 fps
232%
GeForce GTX 1660 Ti Max-Q:
72 fps
100%
GeForce GTX 1050 Max-Q:
24 fps
254%
GeForce GTX 1660 Ti Max-Q:
61 fps
100%
GeForce GTX 1050 Max-Q:
10 fps
100%
GeForce GTX 1050 Max-Q:
254.7 fps
100%
GeForce GTX 1050 Max-Q:
153.2 fps
100%
GeForce GTX 1050 Max-Q:
127.5 fps
100%
GeForce GTX 1050 Max-Q:
127 fps
100%
GeForce GTX 1050 Max-Q:
55.5 fps
100%
GeForce GTX 1050 Max-Q:
51.4 fps
100%
GeForce GTX 1050 Max-Q:
33.6 fps
100%
GeForce GTX 1050 Max-Q:
11.3 fps
100%
GeForce GTX 1050 Max-Q:
136 fps
100%
GeForce GTX 1050 Max-Q:
128 fps
100%
GeForce GTX 1050 Max-Q:
120 fps
100%
GeForce GTX 1050 Max-Q:
118 fps
100%
GeForce GTX 1050 Max-Q:
55 fps
100%
GeForce GTX 1050 Max-Q:
191.1 fps
100%
GeForce GTX 1050 Max-Q:
88 fps
100%
GeForce GTX 1050 Max-Q:
47.1 fps
100%
GeForce GTX 1050 Max-Q:
26.2 fps
100%
GeForce GTX 1050 Max-Q:
15.4 fps
100%
GeForce GTX 1050 Max-Q:
240.3 fps
94%
GeForce GTX 1660 Ti Max-Q:
206.7 247.4 ~ 227 fps
100%
GeForce GTX 1050 Max-Q:
155.4 fps
120%
GeForce GTX 1660 Ti Max-Q:
160.8 212.1 ~ 186 fps
100%
GeForce GTX 1050 Max-Q:
98.8 fps
160%
GeForce GTX 1660 Ti Max-Q:
141.7 173.7 ~ 158 fps
100%
GeForce GTX 1050 Max-Q:
36.7 fps
100%
GeForce GTX 1050 Max-Q:
80.6 fps
162%
GeForce GTX 1660 Ti Max-Q:
130.4 fps
100%
GeForce GTX 1050 Max-Q:
35.7 fps
219%
GeForce GTX 1660 Ti Max-Q:
78.1 fps
100%
GeForce GTX 1050 Max-Q:
32.5 fps
223%
GeForce GTX 1660 Ti Max-Q:
72.4 fps
100%
GeForce GTX 1050 Max-Q:
17.1 fps
243%
GeForce GTX 1660 Ti Max-Q:
41.5 fps
100%
GeForce GTX 1050 Max-Q:
10.5 fps
100%
GeForce GTX 1050 Max-Q:
52.7 53.5 ~ 53 fps
100%
GeForce GTX 1050 Max-Q:
49.8 49.8 ~ 50 fps
100%
GeForce GTX 1050 Max-Q:
38.1 38.2 ~ 38 fps
100%
GeForce GTX 1050 Max-Q:
14.7 15 ~ 15 fps
100%
GeForce GTX 1050 Max-Q:
144.7 fps
100%
GeForce GTX 1050 Max-Q:
89.2 fps
100%
GeForce GTX 1050 Max-Q:
45 fps
100%
GeForce GTX 1050 Max-Q:
41.3 fps
100%
GeForce GTX 1050 Max-Q:
15.9 fps
100%
GeForce GTX 1050 Max-Q:
141 fps
100%
GeForce GTX 1050 Max-Q:
82.7 fps
100%
GeForce GTX 1050 Max-Q:
35 fps
100%
GeForce GTX 1050 Max-Q:
28.6 fps
100%
GeForce GTX 1050 Max-Q:
23 fps
100%
GeForce GTX 1050 Max-Q:
70.5 71.5 ~ 71 fps
100%
GeForce GTX 1050 Max-Q:
52.6 54.8 ~ 54 fps
100%
GeForce GTX 1050 Max-Q:
28.3 30.1 ~ 29 fps
100%
GeForce GTX 1050 Max-Q:
20.3 21.4 ~ 21 fps
100%
GeForce GTX 1050 Max-Q:
9 9.6 ~ 9 fps
100%
GeForce GTX 1050 Max-Q:
256.9 fps
75%
GeForce GTX 1660 Ti Max-Q:
193.7 fps
100%
GeForce GTX 1050 Max-Q:
160 fps
100%
GeForce GTX 1050 Max-Q:
80.5 fps
175%
GeForce GTX 1660 Ti Max-Q:
140.7 fps
100%
GeForce GTX 1050 Max-Q:
48.9 fps
237%
GeForce GTX 1660 Ti Max-Q:
116 fps
100%
GeForce GTX 1050 Max-Q:
26 fps
100%
GeForce GTX 1050 Max-Q:
53.8 fps
100%
GeForce GTX 1050 Max-Q:
33.5 fps
127%
GeForce GTX 1660 Ti Max-Q:
42.4 fps
100%
GeForce GTX 1050 Max-Q:
29.1 fps
140%
GeForce GTX 1660 Ti Max-Q:
40.7 fps
100%
GeForce GTX 1050 Max-Q:
18.9 fps
100%
GeForce GTX 1050 Max-Q:
109.9 fps
100%
GeForce GTX 1050 Max-Q:
69.8 fps
100%
GeForce GTX 1050 Max-Q:
32.3 fps
100%
GeForce GTX 1050 Max-Q:
24.8 fps
100%
GeForce GTX 1050 Max-Q:
10.9 fps
100%
GeForce GTX 1050 Max-Q:
98 105.5 ~ 102 fps
92%
GeForce GTX 1660 Ti Max-Q:
93.7 fps
100%
GeForce GTX 1050 Max-Q:
41.4 56 62 ~ 53 fps
208%
GeForce GTX 1660 Ti Max-Q:
72.7 fps
222%
GeForce GTX 1660 Ti Max-Q:
64.5 fps
100%
GeForce GTX 1050 Max-Q:
12.9 fps
100%
GeForce GTX 1050 Max-Q:
108 170.3 ~ 139 fps
167%
GeForce GTX 1660 Ti Max-Q:
232.8 fps
100%
GeForce GTX 1050 Max-Q:
93.5 127.3 ~ 110 fps
182%
GeForce GTX 1660 Ti Max-Q:
200.1 fps
100%
GeForce GTX 1050 Max-Q:
67.5 80.4 ~ 74 fps
221%
GeForce GTX 1660 Ti Max-Q:
163.6 fps
100%
GeForce GTX 1050 Max-Q:
62.8 67 ~ 65 fps
229%
GeForce GTX 1660 Ti Max-Q:
148.8 fps
100%
GeForce GTX 1050 Max-Q:
22.1 26.1 ~ 24 fps
100%
GeForce GTX 1050 Max-Q:
174.8 fps
100%
GeForce GTX 1050 Max-Q:
140.9 fps
100%
GeForce GTX 1050 Max-Q:
109.3 fps
100%
GeForce GTX 1050 Max-Q:
83.3 fps
100%
GeForce GTX 1050 Max-Q:
26.1 fps
GeForce GTX 1660 Ti Max-Q:
60 fps
GeForce GTX 1660 Ti Max-Q:
60 fps
GeForce GTX 1660 Ti Max-Q:
60 fps
100%
GeForce GTX 1050 Max-Q:
149.5 fps
72%
GeForce GTX 1660 Ti Max-Q:
93.3 113 119 ~ 108 fps
100%
GeForce GTX 1050 Max-Q:
134.1 fps
100%
GeForce GTX 1050 Max-Q:
115.5 fps
100%
GeForce GTX 1050 Max-Q:
104.1 fps
100%
GeForce GTX 1050 Max-Q:
37.1 fps
GeForce GTX 1660 Ti Max-Q:
89 fps
GeForce GTX 1660 Ti Max-Q:
69 fps
GeForce GTX 1660 Ti Max-Q:
51 fps
100%
GeForce GTX 1050 Max-Q:
34 34.5 41 ~ 37 fps
100%
GeForce GTX 1050 Max-Q:
12 13.1 ~ 13 fps
238%
GeForce GTX 1660 Ti Max-Q:
30.9 fps
119%
GeForce GTX 1660 Ti Max-Q:
161.3 fps
120%
GeForce GTX 1660 Ti Max-Q:
151.5 fps
100%
GeForce GTX 1050 Max-Q:
61.8 62.1 ~ 62 fps
185%
GeForce GTX 1660 Ti Max-Q:
114.6 fps
100%
GeForce GTX 1050 Max-Q:
27 27.7 ~ 27 fps
221%
GeForce GTX 1660 Ti Max-Q:
59.6 fps
100%
GeForce GTX 1050 Max-Q:
26.1 29.1 ~ 28 fps
100%
GeForce GTX 1050 Max-Q:
106 fps
100%
GeForce GTX 1050 Max-Q:
56.5 76 ~ 66 fps
100%
GeForce GTX 1050 Max-Q:
57.2 66 ~ 62 fps
100%
GeForce GTX 1050 Max-Q:
38 38.8 ~ 38 fps
100%
GeForce GTX 1050 Max-Q:
79.7 fps
100%
GeForce GTX 1050 Max-Q:
71.8 fps
100%
GeForce GTX 1050 Max-Q:
48.7 fps
100%
GeForce GTX 1050 Max-Q:
21.9 fps
100%
GeForce GTX 1050 Max-Q:
333.8 fps
103%
GeForce GTX 1660 Ti Max-Q:
343.8 fps
100%
GeForce GTX 1050 Max-Q:
216.6 fps
149%
GeForce GTX 1660 Ti Max-Q:
322.9 fps
100%
GeForce GTX 1050 Max-Q:
157.8 fps
188%
GeForce GTX 1660 Ti Max-Q:
296.9 fps
100%
GeForce GTX 1050 Max-Q:
73.8 fps
225%
GeForce GTX 1660 Ti Max-Q:
166.1 fps
100%
GeForce GTX 1050 Max-Q:
316 fps
100%
GeForce GTX 1050 Max-Q:
296.3 fps
100%
GeForce GTX 1050 Max-Q:
233.3 fps
100%
GeForce GTX 1050 Max-Q:
143.8 fps
100%
GeForce GTX 1050 Max-Q:
93.5 fps
100%
GeForce GTX 1050 Max-Q:
53.4 fps
Average Gaming NVIDIA GeForce GTX 1050 Max-Q → 100% Average Gaming 30-70 fps → 100%
Average Gaming NVIDIA GeForce GTX 1660 Ti Max-Q → 197% Average Gaming 30-70 fps → 219%
 Deutsch
 English
 Español
 Français
 Italiano
 Nederlands
 Polski
 Português
 Русский
 Türkçe
 Svenska
 Chinese
 Magyar