

NVIDIA GeForce GT 710 vs Intel HD Graphics (Broadwell) vs Intel HD Graphics 2500
NVIDIA GeForce GT 710
► remove from comparison
Die Nvidia GeForce GT 710 ist Einstiegs-Desktop-Grafikkarte basierend auf dem GK208 Chip der Kepler-Architektur. Sie wird in 28nm von TSMC gefertigt und kann maximal mit 2 GB DDR3-VRAM bestückt werden, welcher über ein 64 Bit Speicherbus angebunden ist (24,4 GB/s).
Die Performance ist im Schnitt leicht unterhalb der Radeon MX 250 angesiedelt und daher eignet sie sich am besten für aktuelle Spiele in niedriger - mittlerer Detailstufe.
Der Stromverbrauch ist relativ gering und laut Nvidia mit 19 Watt spezifiziert.
Intel HD Graphics (Broadwell)
► remove from comparison
Die Intel HD Graphics (Broadwell) (GT1) ist eine Prozessorgrafikkarte in den CPUs der Broadwell-Generation. Die GPU wird in einigen Pentium- und Celeron-Modellen der Serie verbaut und bietet 12 EUs (Execution Units bzw. Ausführungseinheiten). Die maximale Turbo-Taktrate und damit auch die Performance kann sich von Modell zu Modell leicht unterscheiden, insgesamt siedelt sich die Grafikkarte aber nur im Low-End-Segment an und ist für neuere Spiele kaum ausreichend.
Architektur und Features
Broadwell integriert eine Grafikeinheit auf Basis der Intel-Gen8-Architektur, die gegenüber dem Vorgänger Intel Gen7.5 (Haswell) in verschiedenen Punkten weiterentwickelt wurde. So hat Intel unter anderem die "Subslice" genannten Shader-Arrays umorganisiert, die bei diesem Modell nun jeweils 6 Execution Units (EUs) beinhalten. Zwei Subslices bilden wiederum einen Slice mit insgesamt 12 EUs. Hinzu kommen größere L1-Caches und Verbesserungen im Front-End, die die Leistung zusätzlich steigern sollen.
Die HD Graphics (Broadwell) repräsentiert die kleinste, auch "GT1" bezeichnete Ausbaustufe mit einem Slice und 12 EUs. Daneben existieren auch schnellere Varianten wie die GT2 (24 EUs) sowie die GT3/GT3e (48 EUs) ohne/mit zusätzlichem eDRAM-Cache.
Alle Broadwell-GPUs unterstützen OpenCL 2.0 sowie DirectX 12 (FL 11_1). Zudem kann der Videodecoder nun auch den H.265-Codec verarbeiten, greift dafür allerdings nur teilweise auf besonders sparsame Fixed-Function-Einheiten zurück. Die Bildausgabe erfolgt über DP 1.2/eDP 1.3 (max. 3.840 x 2.160 @ 60 Hz) oder HDMI 1.4a (max. 3.840 x 2.160 @ 24 Hz), HDMI 2.0 steht dagegen nicht zur Verfügung. Es können maximal drei Displays parallel angesteuert werden.
Performance
Obwohl der maximale GPU-Takt etwas niedriger ausfällt, dürfte die HD Graphics (Broadwell) die ältere HD Graphics (Haswell) klar übertrumpfen und etwa das Niveau der HD Graphics 4000 erreichen. Nur sehr wenige aktuelle Spiele wie das anspruchslose Dota 2 lassen sich in niedrigen Einstellungen flüssig darstellen.
Leistungsaufnahme
Die bislang vorgestellten Celeron- und Pentium-Prozessoren gehören ausschließlich der sparsamen 15-Watt-Klasse an, später dürften auch weitere Dual-Core-Modelle mit 37 Watt TDP folgen. Abhängig davon ist die HD Graphics (Broadwell) sowohl in kleinen Subnotebooks als auch deutlich größeren Geräten zu finden.
Intel HD Graphics 2500
► remove from comparison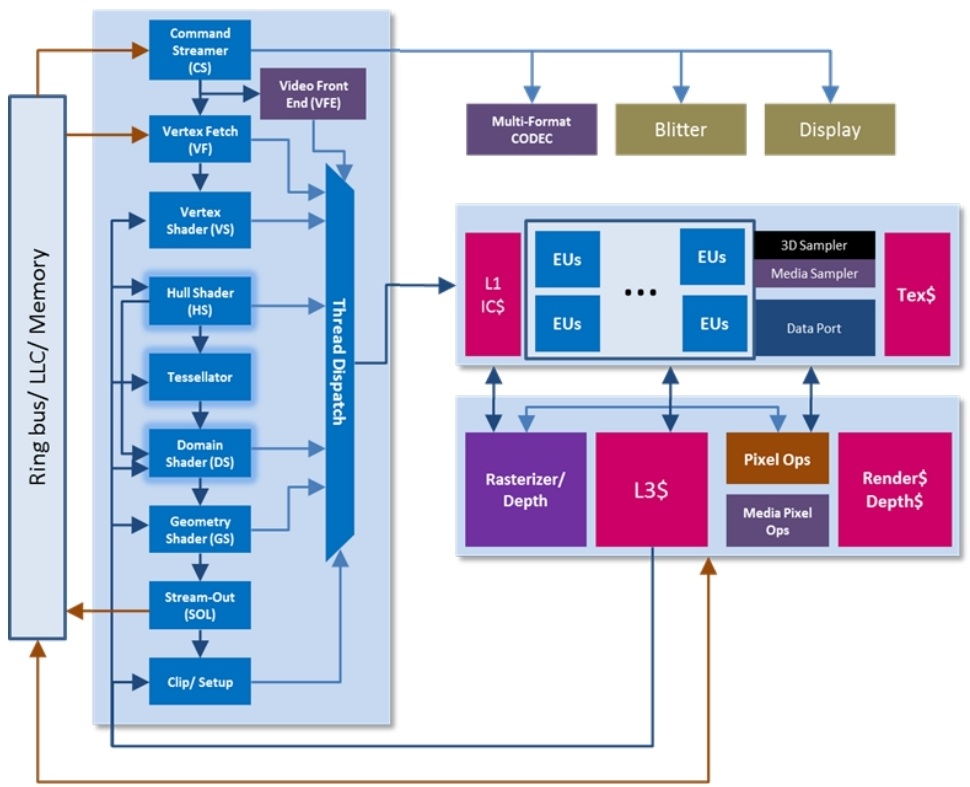
Die Intel HD Graphics 2500 (oder Ivy Bridge GT1) ist eine in den Ivy Bridge Prozessoren integrierte Grafikkarte. Sie kommt ausschließlich in Desktop CPUs zum Einsatz. Das mobile Pendant nennt sich schlicht Intel HD Graphics. Im Vergleich zur stärkeren Intel HD Graphics 4000 ist die HD 2500 deutlich abgespeckt und bietet weniger Execution Units (6 EUs) und Texture Sampler (nur einer). Daher ist die Performance deutlich geringer und nur etwas oberhalb der alten Intel HD Graphics 2000. Je nach Prozessor weist die HD Graphics 2500 eine unterschiedliche Basis- und Turbo-Taktrate auf.
Da die Leistung nur zwischen der HD Graphics 2000 und 3000 liegt (siehe Benchmarks), reicht die HD Graphics 2500 nur für ältere und anspruchslose Spiele aus. Im Konkurrenzvergleich entspricht die Performance etwa den integrierten Einstiegslösungen von AMD, zum Beispiel der Radeon HD 8210.
Eine Besonderheit der Ivy Bride Grafikkerne ist, das nur 4x MSAA von der Hardware unterstützt wird. 2x MSAA wird per Software berechnet und geht durch die 4x MSAA Pipeline. Daher empfiehlt sich der Einsatz des gleich schnellen 4x MSAA.
Auch der integrierte Videodecoder genannt Multi Format Codec Engine (MFX) wurde kräftig überarbeitet und soll nun sogar mehrere 4K Videos parallel dekodieren können (ev. nur in den High-End Modellen). DXVA Checker gibt weiterhin die Formate MPEG2, VC1, WMV9 und H264 als unterstütz an. QuickSync zum schnellen Transkodieren von Videos wurde ebenfalls verbessert und soll nun schneller bei gleichzeitig höherer Qualität laufen.
Ebenfalls neu ist die Unterstützung für drei unabhängige Bildschirme. Bis Sandy Bridge waren nur zwei möglich und lediglich die AMD Grafikkarten mit Eyefinity Support bieten mehr als zwei Anschlüsse für Notebooks (jedoch nur mit DisplayPorts).
Aufgrund der Integration in den mit 22nm gefertigten Prozessor und die halbierte Shaderzahl ist der Stromverbrauch relativ gering.
| NVIDIA GeForce GT 710 | Intel HD Graphics (Broadwell) | Intel HD Graphics 2500 | |||||||||||||||||||||||||||||||||||||||||||||||||||||||||||||||||||||||||||||||||||||||||||||||||||||||||||||||||||||||||||||||||||||||||||
| Codename | GK208B | Broadwell GT1 | Ivy Bridge GT1 | ||||||||||||||||||||||||||||||||||||||||||||||||||||||||||||||||||||||||||||||||||||||||||||||||||||||||||||||||||||||||||||||||||||||||||
| Architektur | Kepler | Gen. 8 Broadwell | Gen. 7 Ivy Bridge | ||||||||||||||||||||||||||||||||||||||||||||||||||||||||||||||||||||||||||||||||||||||||||||||||||||||||||||||||||||||||||||||||||||||||||
| Pipelines | 192 - unified | 12 - unified | 6 - unified | ||||||||||||||||||||||||||||||||||||||||||||||||||||||||||||||||||||||||||||||||||||||||||||||||||||||||||||||||||||||||||||||||||||||||||
| Kerntakt | 954 MHz | 100 - 850 (Boost) MHz | 650 - 1150 (Boost) MHz | ||||||||||||||||||||||||||||||||||||||||||||||||||||||||||||||||||||||||||||||||||||||||||||||||||||||||||||||||||||||||||||||||||||||||||
| Speichertakt | 1800 MHz | ||||||||||||||||||||||||||||||||||||||||||||||||||||||||||||||||||||||||||||||||||||||||||||||||||||||||||||||||||||||||||||||||||||||||||||
| Speicherbandbreite | 64 Bit | 64/128 Bit | 64/128 Bit | ||||||||||||||||||||||||||||||||||||||||||||||||||||||||||||||||||||||||||||||||||||||||||||||||||||||||||||||||||||||||||||||||||||||||||
| Speichertyp | DDR3 | ||||||||||||||||||||||||||||||||||||||||||||||||||||||||||||||||||||||||||||||||||||||||||||||||||||||||||||||||||||||||||||||||||||||||||||
| Max. Speichergröße | 2 GB MB | ||||||||||||||||||||||||||||||||||||||||||||||||||||||||||||||||||||||||||||||||||||||||||||||||||||||||||||||||||||||||||||||||||||||||||||
| Shared Memory | nein | ja | ja | ||||||||||||||||||||||||||||||||||||||||||||||||||||||||||||||||||||||||||||||||||||||||||||||||||||||||||||||||||||||||||||||||||||||||||
| API | DirectX 12 (11_0), Shader 5.1, OpenGL 4.6 | DirectX 12 (FL 11_1), OpenGL 4.3 | DirectX 11.0, Shader 5.0 | ||||||||||||||||||||||||||||||||||||||||||||||||||||||||||||||||||||||||||||||||||||||||||||||||||||||||||||||||||||||||||||||||||||||||||
| Stromverbrauch | 19 Watt | ||||||||||||||||||||||||||||||||||||||||||||||||||||||||||||||||||||||||||||||||||||||||||||||||||||||||||||||||||||||||||||||||||||||||||||
| Transistors | 1,020 Million | ||||||||||||||||||||||||||||||||||||||||||||||||||||||||||||||||||||||||||||||||||||||||||||||||||||||||||||||||||||||||||||||||||||||||||||
| Herstellungsprozess | 28 nm | 14 nm | 22 nm | ||||||||||||||||||||||||||||||||||||||||||||||||||||||||||||||||||||||||||||||||||||||||||||||||||||||||||||||||||||||||||||||||||||||||||
| Erscheinungsdatum | 27.03.2014 | 05.01.2015 | 01.04.2012 | ||||||||||||||||||||||||||||||||||||||||||||||||||||||||||||||||||||||||||||||||||||||||||||||||||||||||||||||||||||||||||||||||||||||||||
| HD Graphics Serie |
|
| |||||||||||||||||||||||||||||||||||||||||||||||||||||||||||||||||||||||||||||||||||||||||||||||||||||||||||||||||||||||||||||||||||||||||||
| Features | QuickSync | ||||||||||||||||||||||||||||||||||||||||||||||||||||||||||||||||||||||||||||||||||||||||||||||||||||||||||||||||||||||||||||||||||||||||||||
| Notebookgröße | groß (17" z.B.) |
|
| |||||||||||||||||||||||||||||||||||||||||||||
Benchmarks

3DM Vant. Perf. total + Intel HD Graphics (Broadwell)
specvp11 snx-01 + Intel HD Graphics 2500
Cinebench R15 OpenGL 64 Bit + NVIDIA GeForce GT 710
GFXBench T-Rex HD Offscreen C24Z16 + Intel HD Graphics (Broadwell)
Average Benchmarks NVIDIA GeForce GT 710 → 100% n=7
Average Benchmarks Intel HD Graphics (Broadwell) → 54% n=7
Average Benchmarks Intel HD Graphics 2500 → 43% n=7
* Smaller numbers mean a higher performance
1 This benchmark is not used for the average calculation
Spiele-Benchmarks
Die folgenden Benchmarks basieren auf unseren Spieletests mit Testnotebooks. Die Performance dieser Grafikkarte bei den gelisteten Spielen ist abhängig von der verwendeten CPU, Speicherausstattung, Treiber und auch Betriebssystem. Dadurch müssen die untenstehenden Werte nicht repräsentativ sein. Detaillierte Informationen über das verwendete System sehen Sie nach einem Klick auf den fps-Wert.

Vampire Bloodhunt
2022
Ghostwire Tokyo
2022

Elden Ring
2022

God of War
2022
Halo Infinite
2021
Farming Simulator 22
2021
Battlefield 2042
2021
Forza Horizon 5
2021

Riders Republic
2021

Alan Wake Remastered
2021


F1 2021
2021


Outriders
2021


Crysis Remastered
2020
Borderlands 3
2019
Far Cry New Dawn
2019
Metro Exodus
2019
Strange Brigade
2018
Far Cry 5
2018
X-Plane 11.11
2018


FIFA 16
2015
World of Warships
2015Dota 2 Reborn
2015
The Witcher 3
2015
Dirt Rally
2015
GTA V
2015
Battlefield Hardline
2015
F1 2014
2014
Sims 4
2014
GRID: Autosport
2014
Metro: Last Light
2013BioShock Infinite
2013
Tomb Raider
2013Dead Space 3
2013
Far Cry 3
2012
Assassin´s Creed III
2012
Hitman: Absolution
2012
Fifa 13
2012
F1 2012
2012
Guild Wars 2
2012Counter-Strike: GO
2012Sleeping Dogs
2012
Diablo III
2012
Anno 2070
2011
Battlefield 3
2011
Supreme Commander - FA Bench
2007
Crysis - GPU Benchmark
2007
Average Gaming NVIDIA GeForce GT 710 → 100%
Average Gaming 30-70 fps → 100%
| NVIDIA GeForce GT 710 | low | med. | high | ultra | QHD | 4K |
|---|---|---|---|---|---|---|
| Vampire Bloodhunt | 11.9 | 5.96 | ||||
| Ghostwire Tokyo | 4.56 | 4.38 | ||||
| Tiny Tina's Wonderlands | 5.94 | 4.72 | ||||
| Elden Ring | ||||||
| Rainbow Six Extraction | 5 | |||||
| God of War | ||||||
| Halo Infinite | ||||||
| Farming Simulator 22 | 18 | 7.67 | ||||
| Battlefield 2042 | ||||||
| Forza Horizon 5 | 11 | |||||
| Call of Duty Vanguard | ||||||
| Riders Republic | 12 | 5 | 3 | |||
| Far Cry 6 | ||||||
| Alan Wake Remastered | ||||||
| New World | 9.76 | 5.01 | ||||
| Deathloop | ||||||
| F1 2021 | 21.4 | 8.93 | 7.05 | 4.06 | ||
| Monster Hunter Stories 2 | 40.2 | 20.3 | 17.4 | |||
| Days Gone | 10.1 | 5.52 | ||||
| Mass Effect Legendary Edition | 19.1 | 9.1 | ||||
| Resident Evil Village | ||||||
| Outriders | 23.4 | 12.2 | 8.6 | |||
| Hitman 3 | 12.2 | 4.6 | ||||
| Immortals Fenyx Rising | 19 | 9 | 5 | |||
| Assassin´s Creed Valhalla | ||||||
| Dirt 5 | ||||||
| Crysis Remastered | 16.3 | 5.39 | ||||
| Borderlands 3 | 14 | 5 | 3 | 2.37 | ||
| Far Cry New Dawn | 11 | 5 | 5 | |||
| Metro Exodus | 7.67 | 3.81 | 2.97 | 2.42 | ||
| Strange Brigade | 19.6 | 7.7 | 5.4 | 5.1 | 5 | 5 |
| Far Cry 5 | 11 | 5 | 4 | 4 | ||
| X-Plane 11.11 | 27.9 | 16.3 | 14.8 | 14.7 | ||
| Final Fantasy XV Benchmark | 8.41 | 3.68 | 2.93 | 1.89 | 1.89 | |
| Dota 2 Reborn | 113.8 | 49.5 | 19.5 | 18.1 | 7.3 | |
| The Witcher 3 | 15.8 | 9.63 | 5.39 | 2.82 | ||
| GTA V | 58.5 | 48.6 | 11.5 | 5.9 | ||
| < 30 fps < 60 fps < 120 fps ≥ 120 fps | 23 2 1 | 21 2 | 15 | 9 | 2 | 4 |
| Intel HD Graphics (Broadwell) | low | med. | high | ultra | QHD | 4K |
|---|---|---|---|---|---|---|
| Star Wars Battlefront | 15.3 | 8.5 | ||||
| FIFA 16 | 38.1 | 20.6 | ||||
| World of Warships | 29 | 20.8 | ||||
| Dirt Rally | 50 | 13.5 | ||||
| Battlefield Hardline | 23.9 | 16.4 | ||||
| Dragon Age: Inquisition | 13.9 | 9.4 | ||||
| F1 2014 | 34 | 24 | ||||
| Sims 4 | 113.6 | 26.3 | ||||
| GRID: Autosport | 57.6 | 22.6 | ||||
| Metro: Last Light | 13.7 | 10.7 | 7 | |||
| BioShock Infinite | 25.3 | 14.1 | 11.7 | |||
| Tomb Raider | 34.7 | 17.7 | 11.7 | |||
| Hitman: Absolution | 15.6 | 11.4 | 5.3 | |||
| Counter-Strike: GO | 43.7 | 31.5 | 23.9 | |||
| Diablo III | 38.4 | 24.9 | 19.7 | |||
| < 30 fps < 60 fps < 120 fps ≥ 120 fps | 7 7 1 | 13 1 | 7 | | | |
| Intel HD Graphics 2500 | low | med. | high | ultra | QHD | 4K |
|---|---|---|---|---|---|---|
| Metro: Last Light | 11.07 | 9.84 | 9.64 | |||
| BioShock Infinite | 17.66 | 8 | 6.96 | |||
| StarCraft II: Heart of the Swarm | 145 | 26 | 13.7 | 4.3 | ||
| SimCity | 14.8 | 8 | ||||
| Tomb Raider | 20.1 | 10.9 | 7.1 | |||
| Crysis 3 | 13.8 | |||||
| Dead Space 3 | 45 | 18.8 | 13.5 | 7.3 | ||
| Far Cry 3 | 19 | 11.9 | ||||
| Assassin´s Creed III | 13.8 | |||||
| Hitman: Absolution | 19 | 11 | 3.8 | 1.9 | ||
| Call of Duty: Black Ops 2 | 18 | |||||
| Fifa 13 | 77 | 47 | 27 | 14.5 | ||
| F1 2012 | 39 | 24 | 22 | 12 | ||
| Guild Wars 2 | 37 | 8 | ||||
| Counter-Strike: GO | 80 | 38 | 19 | 11.7 | ||
| Sleeping Dogs | 21.7 | 15.5 | ||||
| Anno 2070 | 23.15 | 9.78 | 5.23 | |||
| Battlefield 3 | 16.8 | 11 | ||||
| Supreme Commander - FA Bench | 46 | 22.2 | 18.7 | 7.6 | ||
| Crysis - GPU Benchmark | 51 | 21 | 12 | 3 | ||
| World of Warcraft | 104 | 29 | ||||
| < 30 fps < 60 fps < 120 fps ≥ 120 fps | 11 5 3 1 | 16 2 | 13 | 8 | | |
Eine Liste mit weiteren Spielen und allen Grafikkarten finden Sie auf unserer Seite: Welches Spiel ist mit welcher Grafikkarte spielbar?