Notebookcheck Logo

MediaTek Dimensity 8050 vs MediaTek Dimensity 7050

MediaTek Dimensity 8050

► remove from comparison Mediatek Dimensity 8050

Der MediaTek Dimensity 8050 ist ein ARM-basiertes SoC (System-on-a-Chip), welches bei TSMC im 6-nm-Prozess gefertigt wird. Es unterstützt alle aktuellen Mobilfunkstandards inklusive Dual-SIM-5G (5G SA & NSA, max 4.7 Gbps Download und 2.5 Gbps Upload). Außerdem unterstützt das SoC Wi-Fi 6 und Bluetooth 5.2.

Der MediaTek Dimensity 8050 wurde speziell für den Einsatz in Android-Smartphones entworfen und sortiert sich leistungstechnisch in die obere Mittelklasse ein.

Der CPU-Teil besteht aus drei Clustern: Einem schnellen Performance-Kern, basierend auf der ARM-Cortex-A78-Architektur und getaktet mit bis zu 3 GHz. Der zweite Cluster besteht aus drei Cortex-A78-Kernen mit bis zu 2,6 GHz. Als Stromspar-Cluster sind vier ARM Cortex-A55 Kerne mit bis zu 2 GHz verbaut. Die integrierte Grafikeinheit ARM Mali-G77 MC9 kann Displays mit einer Auflösung von bis zu 2.560 x 1.080 und einer Bildwiederholrate von bis zu 144 Hz befeuern (ev. nur bei Full HD+).

Technisch ist das SoC ähnlich zum älteren Dimensity 1300. 

MediaTek Dimensity 7050

► remove from comparison Mediatek Dimensity 7050
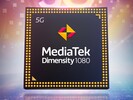
Der MediaTek Dimensity 7050 (Mediatek MT8791N/TN) ist ein Mittelklasse-SoC für Smartphones und Tablets mit integriertem 5G Modem. Er wurde im Mai 2023 vorgestellt und ist anscheinend identisch zum alten Dimensity 1080 SoC.

Es handelt sich um eine Octa-Core-CPU mit vier schnellen ARM Cortex-A78 Kernen mit bis zu 2,6 GHz und vier Stromsparkernen vom Typ Cortex-A55 mit bis zu 2 GHz.

Das SoC integriert weiters eine ARM Mali-G68 MC4 Grafikkarte, ein Wi-Fi 6 Modem, einen LPDDR5 Speicherkontroller und arbeitet mit Kameras mit bis zu 200 Megapixel Auflösung zusammen. Auch eine MediaTek APU 3.0  für beschleunigte KI-Anwendungen ist vorhanden.

Der Chip wird im 6nm Verfahren gefertigt.

ModelMediaTek Dimensity 8050MediaTek Dimensity 7050
CodenameCortex-A78 / A55Cortex-A78 / A55
Clock2000 - 3000 MHz2000 - 2600 MHz
Cores / Threads8 / 8
1 x 3.0 GHz ARM Cortex-A78
3 x 2.6 GHz ARM Cortex-A78
4 x 2.0 GHz ARM Cortex-A55
8 / 8
Technology6 nm6 nm
Features1x ARM Cortex-A77 (3 GHz), 3x ARM Cortex-A77 (2.6 GHz), 4x ARM Cortex-A55 (2 GHz), ARM Mali-G77 MP9, APU 570, 5G Modem, MiraVision HDR10+, Wi-Fi 6, Bluetooth 5.2, UFS 3.1, LPDDR4x2x ARM Cortex-A78 (2.6 GHz), 6x ARM Cortex-A55 (2 GHz), ARM Mali-G68 MC4, 5G NR Sub-6 GHz, LTE
iGPUARM Mali-G77 MP9ARM Mali-G68 MP4
ArchitectureARMARM
Announced
Manufacturerwww.mediatek.comwww.mediatek.com

Benchmarks

3DMark - 3DMark Sling Shot Extreme (ES 3.1) Unlimited Physics
min: 4044     avg: 4205     median: 4279 (40%)     max: 4307 Points
3DMark - 3DMark Sling Shot (ES 3.0) Unlimited Physics
4304 Points (49%)
Geekbench 6.3 - Geekbench 6.3 Single-Core
min: 958     avg: 1036     median: 1036 (26%)     max: 1114 Points
Geekbench 6.3 - Geekbench 6.3 Multi-Core
min: 2926     avg: 3173     median: 3173 (12%)     max: 3420 Points
min: 2397     avg: 2430     median: 2408 (9%)     max: 2517 Points
Geekbench 5.5 - Geekbench 5.1 - 5.5 64 Bit Single-Core
min: 864     avg: 868     median: 867.5 (34%)     max: 871 Points
min: 738     avg: 791     median: 795 (31%)     max: 835 Points
Geekbench 5.5 - Geekbench 5.1 - 5.5 64 Bit Multi-Core
min: 2779     avg: 2852     median: 2852 (5%)     max: 2925 Points
min: 1973     avg: 2163     median: 2171.5 (4%)     max: 2335 Points
Geekbench 5.0 - Geekbench 5.0 64 Bit Single-Core
762 Points (3%)
Geekbench 5.0 - Geekbench 5.0 64 Bit Multi-Core
1960 Points (6%)
Geekbench 4.4 - Geekbench 4.1 - 4.4 64 Bit Single-Core
4348 Points (43%)
min: 3616     avg: 3697     median: 3630 (36%)     max: 3844 Points
Geekbench 4.4 - Geekbench 4.1 - 4.4 64 Bit Multi-Core
11466 Points (11%)
min: 8532     avg: 8932     median: 8637 (9%)     max: 9628 Points
Geekbench 4.0 - Geekbench 4.0 64 Bit Single-Core
3562 Points (48%)
Geekbench 4.0 - Geekbench 4.0 64 Bit Multi-Core
8166 Points (20%)
Geekbench 3 - Geekbench 3 64 Bit Multi-Core
10869 Points (17%)
Geekbench 3 - Geekbench 3 64 Bit Single-Core
3811 Points (57%)
Mozilla Kraken 1.1 - Kraken 1.1 Total Score *
min: 1395.4     avg: 1713     median: 1713.3 (2%)     max: 2031.1 ms
min: 1263.6     avg: 1474     median: 1488.7 (2%)     max: 1656.2 ms
Octane V2 - Octane V2 Total Score
min: 29792     avg: 31904     median: 31904 (27%)     max: 34016 Points
min: 31245     avg: 33346     median: 31813 (27%)     max: 37214 Points
WebXPRT 4 - WebXPRT 4 Score
min: 71     avg: 76     median: 76 (21%)     max: 81 Points
min: 66     avg: 87.8     median: 89 (25%)     max: 107 Points
WebXPRT 3 - WebXPRT 3 Score
89 Points (16%)
min: 81     avg: 97.7     median: 99 (18%)     max: 113 Points
Antutu v9 - AnTuTu v9 Total Score
min: 643695     avg: 685759     median: 685759 (33%)     max: 727823 Points
min: 426859     avg: 466886     median: 442871 (22%)     max: 530929 Points
Antutu v9 - AnTuTu v9 CPU
min: 161711     avg: 173949     median: 173948 (43%)     max: 186186 Points
min: 115632     avg: 126696     median: 122360 (30%)     max: 142097 Points
PassMark PerformanceTest Mobile V1 - PerformanceTest Mobile V1 CPU Tests
min: 4722     avg: 6101     median: 6101 (1%)     max: 7480 Points
min: 5092     avg: 5252     median: 5252 (1%)     max: 5412 Points
PCMark for Android - PCM f. Android Storage 2.0 random write internal
min: 62.3     avg: 76.5     median: 76.5 (52%)     max: 90.6 MB/s
61.2 MB/s (42%)
PCMark for Android - PCM f. Android Storage 2.0 seq write internal
min: 1180     avg: 1354     median: 1353.5 (39%)     max: 1527 MB/s
581 MB/s (17%)
PCMark for Android - PCM f. Android Storage 2.0 random read internal
min: 42.8     avg: 44.5     median: 44.5 (55%)     max: 46.2 MB/s
37.9 MB/s (47%)
PCMark for Android - PCM f. Android Storage 2.0 seq read internal
min: 1484     avg: 1547     median: 1547 (43%)     max: 1610 MB/s
623 MB/s (17%)
PCMark for Android - PCM f. Android Storage 2.0 score
min: 37737     avg: 39361     median: 39360.5 (17%)     max: 40984 Points
min: 27787     avg: 28333     median: 28197 (13%)     max: 29014 Points
PCMark for Android - PCM f. Android Work Score 3.0
min: 11254     avg: 12862     median: 12862 (47%)     max: 14470 Points
min: 12131     avg: 13288     median: 12789 (47%)     max: 14561 Points
CrossMark - CrossMark Overall
min: 738     avg: 741     median: 741 (28%)     max: 744 Points
min: 575     avg: 655     median: 669 (26%)     max: 706 Points
Power Consumption - Geekbench 5.5 Power Consumption 150cd *
min: 4.31     avg: 5.1     median: 4.4 (2%)     max: 6.66 Watt
Power Consumption - Idle Power Consumption 150cd 1min *
min: 1.268     avg: 2.3     median: 1.9 (2%)     max: 3.85 Watt

Average Benchmarks MediaTek Dimensity 8050 → 100% n=20

Average Benchmarks MediaTek Dimensity 7050 → 83% n=20

- Bereich der Benchmarkergebnisse für diese Grafikkarte
red legend - Durchschnittliche Benchmarkergebnisse für diese Grafikkarte
* Smaller numbers mean a higher performance
1 This benchmark is not used for the average calculation

Add one or more devices and compare

In the following list you can select (and also search for) devices that should be added to the comparison. You can select more than one device.

restrict list:
v1.28
log 21. 19:52:15

#0 ran 0s before starting gpusingle class +0s ... 0s

#1 checking url part for id 15089 +0s ... 0s

#2 checking url part for id 15080 +0s ... 0s

#3 redirected to Ajax server, took 1734807135s time from redirect:0 +0s ... 0s

#4 did not recreate cache, as it is less than 5 days old! Created at Thu, 19 Dec 2024 05:18:43 +0100 +0s ... 0s

#5 composed specs +0.004s ... 0.004s

#6 did output specs +0s ... 0.004s

#7 getting avg benchmarks for device 15089 +0.001s ... 0.004s

#8 got single benchmarks 15089 +0.004s ... 0.008s

#9 getting avg benchmarks for device 15080 +0.001s ... 0.009s

#10 got single benchmarks 15080 +0.009s ... 0.018s

#11 got avg benchmarks for devices +0s ... 0.018s

#12 min, max, avg, median took s +0.019s ... 0.037s

#13 return log +0s ... 0.037s

Teilen Sie diesen Artikel, um uns zu unterstützen. Jeder Link hilft!
Mail Logo
> Notebook Test, Laptop Test und News > Benchmarks / Technik > Benchmarks / Technik > Prozessor Vergleich - Head 2 Head
Autor: Klaus Hinum,  8.09.2017 (Update:  1.07.2023)