Intel Arc 7-Core iGPU vs Intel HD Graphics P630 vs Intel Graphics 4-Cores iGPU (Arc)
Intel Arc 7-Core iGPU ► remove from comparison
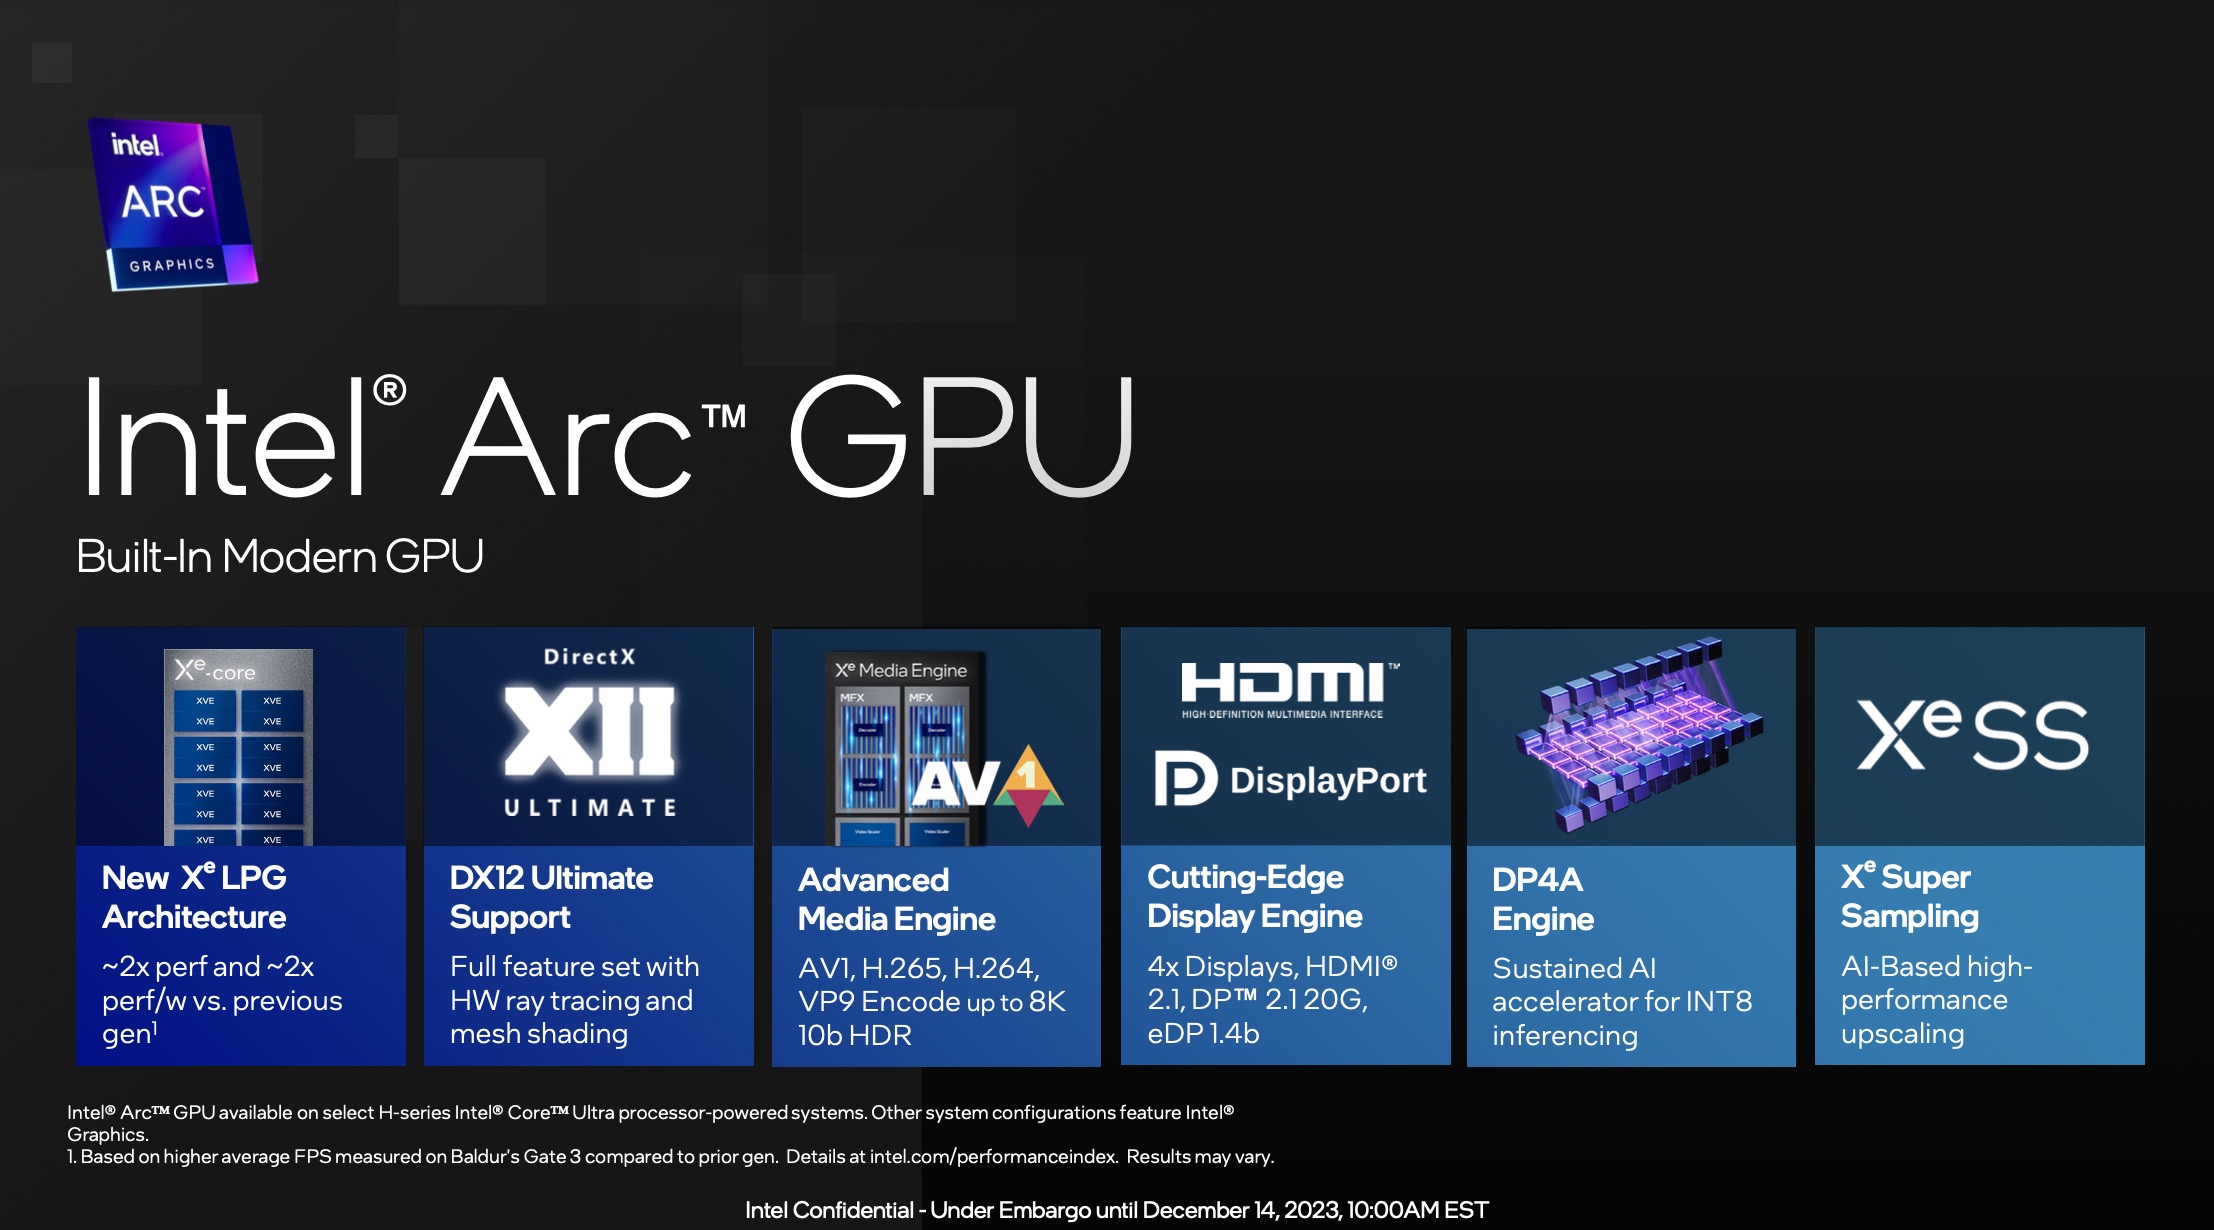
Die Intel Arc iGPU mit 7 Kernen ist eine integrierte Grafikkarte basierend auf die Xe LPG Architektur (ähnlich zu den dedizierten Arc GPUs, jedoch mit Fokus auf Effizienz). Sie bietet 7 der 8 Xe Kerne (112 Xe Vector Engines), 7 Raytracing Einheiten, 7 Sampler und wahrscheinlich auch 4 Pixel Backends.
Der Arc Name darf nur genutzt werden, wenn mindestens 16 GB RAM im Dual Channel Modus verwendet werden. Sonst heisst die nur iGPU "Intel Graphics " und ist ebenfalls deutlich langsamer.
Laut Intel konnte die Performance im Vergleich zur Vorgängergeneration (wahrscheinlich noch in Alder Lake) verdoppelt werden.
Die iGPU unterstützt DirectX 12 Ultimate (wahrscheinlich DX 12_2 wie die Desktop Arc GPUs). Weiters unterstützt die Grafikeinheit XeSS AI Super Sampling.
Die Media Engine ist bei Meteor Lake im SOC Tile und unterstützt bis zu 8k60 10-bit HDR Encode und Deccode von MPEG2, AVC, VP9, HEVC und AV1. Die Display Engine ist ebenfalls im SoC Tile und unterstützt HDMI 2.1 und DisplayPort 2.1 20G mit bis zu 8K60 HDR.
Der GPU Tile des Meteor Lake Chips wird bei TSMC in 5nm (5N Prozess) gefertigt.
Intel HD Graphics P630 ► remove from comparison
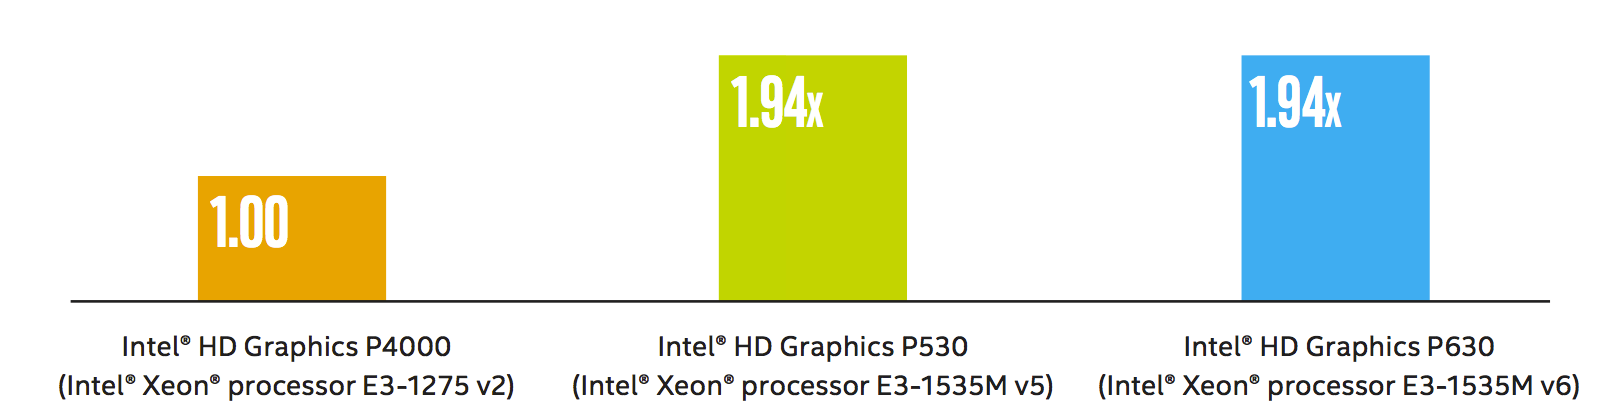
Die Intel HD Graphics P630 (GT2) ist eine integrierte Workstation-Grafikeinheit, die in verschiedenen Desktop- und Notebook-Prozessoren der 2017 vorgestellten Kaby-Lake-Generation zu finden ist (Xeon E3-1200 v6 und e3-1500M v6 Serien). Sie ist identisch mit der Intel HD Graphics 630, jedoch sind die Treiber für professionelle Software optimiert. Daher unterscheidet sie sich auch nicht von der Intel HD Graphics P530 und erreicht laut Intel auch die selbe Leistung im SPEC Viewperf12 (1.94x der alten Intel HD Graphics P4000). Die Grafikkarte ist derzeit für 15 CAD- und Workstation-Anwendungen zertifiziert .
Features
Neu bei der Kaby-Lake Generation ist die verbesserte Videoengine, welche nun auch H.265/HEVC im Main10-profil mit 10 Bit Farbtiefe sowie Googles VP9-Codec in Hardware dekodieren kann. Die Chips mit HD Graphics 530 sollten auch bereits HDCP 2.2 unterstützen und somit z.B. Netflix-Videos unter Windows 10 in 4K ausgeben können (im Gegensatz zu den ersten Kaby-Lake Dual-Core Chips mit Intel HD Graphics 620 ).
Leistungsaufnahme
Die HD Graphics P630 ist in Desktop- und Notebook-Prozessoren verschiedener TDP-Klassen zu finden. Die Quad-Core CPUs sind jedoch meistens in größeren und schwereren Notebooks verbaut. Der verbesserte 14nm+ Prozess verspricht jedoch eine etwas geringere Leistungsaufnahme im Vergleich zur Intel HD Graphics P530.
Quelle : http://www.intel.com/content/dam/www/public/us/en/documents/guides/hd-graphics-performance-guide.pdf
Intel Graphics 4-Cores iGPU (Arc) ► remove from comparison
Die Intel Graphics iGPU mit 4 Kernen ist eine integrierte Grafikkarte basierend auf die Xe LPG Architektur (ähnlich zu den dedizierten Arc GPUs, jedoch mit Fokus auf Effizienz). Sie bietet 4 Xe Kerne (64 Xe Vector Engines), 4 Raytracing Einheiten, 4 Sampler und 2 Pixel Backends.
Im Gegensatz zu der stärkeren Variante mit 8 Kernen in den H Meteor Lake CPUs, darf die kleine Variante nicht den Arc Namen nutzen.
Die iGPU unterstützt DirectX 12 Ultimate (wahrscheinlich DX 12_2 wie die Desktop Arc GPUs). Weiters unterstützt die Grafikeinheit XeSS AI Super Sampling.
Die Media Engine ist bei Meteor Lake im SOC Tile und unterstützt bis zu 8k60 10-bit HDR Encode und Deccode von MPEG2, AVC, VP9, HEVC und AV1. Die Display Engine ist ebenfalls im SoC Tile und unterstützt HDMI 2.1 und DisplayPort 2.1 20G mit bis zu 8K60 HDR.
Der GPU Tile des Meteor Lake Chips wird bei TSMC in 5nm (5N Prozess) gefertigt.
Intel Arc 7-Core iGPU Intel HD Graphics P630 Intel Graphics 4-Cores iGPU (Arc) Arc LPG Serie Codename Meteor Lake iGPU Kaby-Lake-H-GT2 Meteor Lake iGPU Architektur Xe LPG Gen. 9.5 Kaby Lake Xe LPG Pipelines 7 - unified 24 - unified 4 - unified Raytracing Cores 7 4 Kerntakt 2200 (Boost) MHz 1950 (Boost) MHz Cache L1: 1.3 MB L1: 768 KB Shared Memory ja ja nein API DirectX 12_2, OpenGL 4.6, Vulkan 1.3 DirectX 12_1, OpenGL 4.4 DirectX 12_2, OpenGL 4.6, Vulkan 1.3 Herstellungsprozess 5 nm 14 nm 5 nm Displays HDMI 2.1, DisplayPort 2.1 20G HDMI 2.1, DisplayPort 2.1 20G Erscheinungsdatum 14.12.2023 05.08.2015 14.12.2023 Speicherbandbreite 64/128 Bit Features QuickSync
Benchmarks Performance Rating - 3DMark 11 + Fire Strike + Time Spy - Arc 7-Core
3.7 pt (11%)
...
...
max:
Performance Rating - 3DMark 11 + Fire Strike + Time Spy - Graphics 4-Core
2.4 pt (7%)
...
Intel Graphics 4-Cores iGPU (Arc)
...
max:
3DMark - 3DMark Time Spy Score
min: 3121 avg: 3379 median: 3378.5 (10%) max: 3658 Points
400 Points (1%)
min: 1876 avg: 2079 median: 2070 (6%) max: 2315 Points
3DMark - 3DMark Time Spy Graphics
min: 2796 avg: 3075 median: 3102.5 (8%) max: 3319 Points
min: 1668 avg: 1860 median: 1839 (5%) max: 2067 Points
3DMark - 3DMark Ice Storm Unlimited Graphics
396714 Points (40%)
295187 Points (30%)
3DMark - 3DMark Ice Storm Extreme Graphics
min: 145414 avg: 146731 median: 146731 (18%) max: 148048 Points
75102 Points (9%)
3DMark - 3DMark Cloud Gate Score
min: 28997 avg: 29674 median: 29573 (32%) max: 30553 Points
8280 Points (9%)
min: 19423 avg: 21560 median: 21595 (23%) max: 23325 Points
3DMark - 3DMark Cloud Gate Graphics
min: 39695 avg: 41850 median: 41030.5 (11%) max: 45644 Points
min: 23935 avg: 27708 median: 28416.5 (7%) max: 30198 Points
3DMark - 3DMark Fire Strike Standard Score
min: 6548 avg: 7232 median: 7349 (13%) max: 7929 Points
1040 Points (2%)
min: 3952 avg: 4717 median: 4922 (9%) max: 5179 Points
3DMark - 3DMark Fire Strike Standard Graphics
min: 7047 avg: 7945 median: 8133 (9%) max: 8531 Points
min: 4284 avg: 5040 median: 5281 (6%) max: 5498 Points
3DMark - 3DMark Ice Storm Graphics
min: 158643 avg: 181910 median: 159017 (19%) max: 228069 Points
89439 Points (10%)
3DMark - 3DMark Wild Life Extreme Unlimited
min: 5654 avg: 5699 median: 5699 (7%) max: 5744 Points
3681 Points (4%)
3DMark - 3DMark Night Raid
min: 25271 avg: 25991 median: 25990.5 (25%) max: 26710 Points
18070 Points (17%)
3DMark - 3DMark Night Raid Graphics Score
min: 30252 avg: 31507 median: 31507 (12%) max: 32762 Points
21828 Points (8%)
3DMark 11 - 3DM11 Performance Score
min: 10634 avg: 11347 median: 11233.5 (16%) max: 12140 Points
min: 6340 avg: 7106 median: 7250.5 (10%) max: 7589 Points
3DMark 11 - 3DM11 Performance GPU
min: 10303 avg: 11314 median: 11497.5 (10%) max: 12061 Points
min: 6007 avg: 6649 median: 6726 (6%) max: 7107 Points
3DMark Vantage 3DM Vant. Perf. total + Intel Arc 7-Core iGPU 3DMark Vantage - 3DM Vant. Perf. total
min: 35885 avg: 38156 median: 37719 (11%) max: 41299 Points
3DM Vant. Perf. GPU no PhysX + Intel Arc 7-Core iGPU 3DMark Vantage - 3DM Vant. Perf. GPU no PhysX
min: 30937 avg: 33936 median: 34042 (19%) max: 36721 Points
3DMark 05 - 3DMark 05 - Standard
min: 41203 avg: 44877 median: 44876.5 (49%) max: 48550 Points
3DMark 06 3DMark 06 - Standard 1280x1024 + Intel Arc 7-Core iGPU
min: 38905 avg: 40397 median: 40216 (53%) max: 42252 Points
Unigine Valley 1.0 - Unigine Valley 1.0 DX
min: 16.9 avg: 18.8 median: 18.8 (6%) max: 20.7 fps
SPECviewperf 2020 specvp2020 snx-04 1080p + Intel Arc 7-Core iGPU SPECviewperf 2020 - specvp2020 snx-04 1080p
min: 5.65 avg: 5.8 median: 5.8 (1%) max: 5.97 fps
specvp2020 medical-03 1080p + Intel Arc 7-Core iGPU SPECviewperf 2020 - specvp2020 medical-03 1080p
min: 12.3 avg: 13.5 median: 13.5 (10%) max: 14.6 fps
specvp2020 maya-06 1080p + Intel Arc 7-Core iGPU SPECviewperf 2020 - specvp2020 maya-06 1080p
min: 68.4 avg: 71.8 median: 71.8 (8%) max: 75.1 fps
specvp2020 energy-03 1080p + Intel Arc 7-Core iGPU SPECviewperf 2020 - specvp2020 energy-03 1080p
min: 4.61 avg: 4.8 median: 4.8 (3%) max: 5.08 fps
specvp2020 creo-03 1080p + Intel Arc 7-Core iGPU SPECviewperf 2020 - specvp2020 creo-03 1080p
min: 20.2 avg: 20.3 median: 20.3 (10%) max: 20.3 fps
specvp2020 catia-06 1080p + Intel Arc 7-Core iGPU SPECviewperf 2020 - specvp2020 catia-06 1080p
min: 15.5 avg: 16.1 median: 16.1 (10%) max: 16.6 fps
specvp2020 3dsmax-07 1080p + Intel Arc 7-Core iGPU SPECviewperf 2020 - specvp2020 3dsmax-07 1080p
min: 19.8 avg: 20.5 median: 20.5 (6%) max: 21.1 fps
specvp2020 snx-04 4k + Intel Arc 7-Core iGPU SPECviewperf 2020 - specvp2020 snx-04 4k
min: 5.54 avg: 5.7 median: 5.7 (1%) max: 5.82 fps
specvp2020 medical-03 4k + Intel Arc 7-Core iGPU SPECviewperf 2020 - specvp2020 medical-03 4k
min: 4.8 avg: 5.3 median: 5.3 (5%) max: 5.87 fps
specvp2020 maya-06 4k + Intel Arc 7-Core iGPU SPECviewperf 2020 - specvp2020 maya-06 4k
min: 32.8 avg: 33.8 median: 33.8 (5%) max: 34.7 fps
specvp2020 energy-03 4k + Intel Arc 7-Core iGPU SPECviewperf 2020 - specvp2020 energy-03 4k
min: 3.38 avg: 3.6 median: 3.6 (1%) max: 3.81 fps
specvp2020 creo-03 4k + Intel Arc 7-Core iGPU SPECviewperf 2020 - specvp2020 creo-03 4k
min: 15.3 avg: 15.4 median: 15.4 (7%) max: 15.4 fps
specvp2020 catia-06 4k + Intel Arc 7-Core iGPU SPECviewperf 2020 - specvp2020 catia-06 4k
min: 9.7 avg: 10.1 median: 10.1 (7%) max: 10.4 fps
specvp2020 3dsmax-07 4k + Intel Arc 7-Core iGPU SPECviewperf 2020 - specvp2020 3dsmax-07 4k
min: 13.2 avg: 13.9 median: 13.9 (6%) max: 14.5 fps
Cinebench R10 Cinebench R10 Shading (32bit) + Intel Arc 7-Core iGPU Cinebench R10 - Cinebench R10 Shading (32bit)
min: 15394 avg: 15881 median: 15688.5 (11%) max: 16752 Points
Cinebench R11.5 Cinebench R11.5 OpenGL 64 Bit + Intel Arc 7-Core iGPU Cinebench R11.5 - Cinebench R11.5 OpenGL 64 Bit
min: 92.81 avg: 95.4 median: 95.6 (31%) max: 97.61 fps
Cinebench R15 Cinebench R15 OpenGL 64 Bit + Intel Arc 7-Core iGPU Cinebench R15 - Cinebench R15 OpenGL 64 Bit
min: 132.66 avg: 139.4 median: 138.5 (8%) max: 145.06 fps
Cinebench R15 OpenGL 64 Bit + Intel Graphics 4-Cores iGPU (Arc)
min: 92.6 avg: 102.2 median: 103.5 (6%) max: 112 fps
Cinebench R15 OpenGL Ref. Match 64 Bit + Intel Arc 7-Core iGPU Cinebench R15 - Cinebench R15 OpenGL Ref. Match 64 Bit
97.8 % (98%)
Cinebench R15 OpenGL Ref. Match 64 Bit + Intel Graphics 4-Cores iGPU (Arc)
97.8 % (98%)
GFXBench - GFXBench 5.0 4K Aztec Ruins High Tier Offscreen
min: 25.5 avg: 29.7 median: 29.7 (12%) max: 33.9 fps
min: 16.8173 avg: 18.8 median: 18.8 (8%) max: 20.7 fps
GFXBench - GFXBench 5.0 Aztec Ruins High Tier Offscreen
min: 77.4 avg: 78.8 median: 78.8 (14%) max: 80.1 fps
min: 37.3169 avg: 43.2 median: 43.2 (8%) max: 49.1 fps
GFXBench - GFXBench 5.0 Aztec Ruins Normal Tier Offscreen
193.7 fps (14%)
min: 91.8253 avg: 110.7 median: 110.7 (8%) max: 129.5 fps
GFXBench - GFXBench Car Chase Offscreen
155.8 fps (18%)
min: 75.6254 avg: 82.6 median: 82.6 (9%) max: 89.5 fps
GFXBench 3.1 - GFXBench Manhattan ES 3.1 Offscreen
min: 117.479 avg: 139.7 median: 139.7 (3%) max: 161.9 fps
GFXBench 3.0 - GFXBench 3.0 Manhattan Offscreen
min: 173.822 avg: 215.2 median: 215.2 (13%) max: 256.6 fps
GFXBench (DX / GLBenchmark) 2.7 GFXBench T-Rex HD Offscreen C24Z16 + Intel Graphics 4-Cores iGPU (Arc) GFXBench (DX / GLBenchmark) 2.7 - GFXBench T-Rex HD Offscreen C24Z16
min: 370.774 avg: 418.6 median: 418.6 (3%) max: 466.5 fps
Basemark GPU 1.2 - Basemark GPU 1.2 Vulkan Official Medium Offscreen 1080
min: 104.6 avg: 203.3 median: 196.8 (1%) max: 315 fps
min: 104.6 avg: 142.4 median: 104.6 (1%) max: 315 fps
Basemark GPU 1.2 - Basemark GPU 1.2 Vulkan Official High Offscreen 2160
3.6 fps (1%)
3.6 fps (1%)
Geekbench 6.2 - Geekbench 6.2 GPU OpenCL
min: 26624 avg: 29363 median: 29263 (8%) max: 33039 Points
min: 12919 avg: 16272 median: 16496 (5%) max: 17837 Points
Geekbench 6.2 - Geekbench 6.2 GPU Vulkan
min: 26482 avg: 30465 median: 29526 (9%) max: 34230 Points
min: 12449 avg: 17647 median: 18118 (5%) max: 19667 Points
LuxMark v2.0 64Bit - LuxMark v2.0 Room GPU
min: 708 avg: 757 median: 755.5 (3%) max: 809 Samples/s
LuxMark v2.0 64Bit - LuxMark v2.0 Sala GPU
min: 1926 avg: 2453 median: 2538.5 (4%) max: 2807 Samples/s
ComputeMark v2.1 - ComputeMark v2.1 Result
min: 5613 avg: 6364 median: 6471.5 (7%) max: 6899 Points
Power Consumption - Furmark Stress Test Power Consumption - external Monitor *
min: 43.1 avg: 49.9 median: 48.3 (7%) max: 57.4 Watt
min: 25.3 avg: 29.7 median: 29.7 (4%) max: 38 Watt
Power Consumption - The Witcher 3 Power Consumption - external Monitor *
min: 39.7 avg: 42.6 median: 41.9 (6%) max: 46.3 Watt
min: 24.4 avg: 27.7 median: 26.8 (4%) max: 32.2 Watt
Power Consumption - Witcher 3 Power Consumption *
min: 44.4 avg: 46 median: 45.9 (10%) max: 47.7 Watt
min: 27.4 avg: 32.3 median: 30.7 (7%) max: 41.5 Watt
Power Consumption - Witcher 3 ultra Power Efficiency
min: 0.3987 avg: 0.5 median: 0.5 (48%) max: 0.545 fps per Watt
min: 0.4313 avg: 0.5 median: 0.5 (43%) max: 0.544 fps per Watt
Power Consumption - Witcher 3 ultra Power Efficiency - external Monitor
min: 0.4368 avg: 0.5 median: 0.6 (47%) max: 0.589 fps per Watt
min: 0.4877 avg: 0.5 median: 0.5 (45%) max: 0.603 fps per Watt
Power Consumption - Cyberpunk 2077 Power Consumption 150cd *
min: 37 avg: 38.3 median: 37.8 (12%) max: 40.5 Watt
Power Consumption - Cyberpunk 2077 Power Consumption - external Monitor *
min: 52.7 avg: 56.3 median: 57.1 (7%) max: 59.1 Watt
min: 31.8 avg: 37 median: 37.4 (5%) max: 41.4 Watt
Power Consumption - Cyberpunk 2077 ultra Power Efficiency
0.4 fps per Watt (52%)
Emissions Witcher 3 Fan Noise + Intel Arc 7-Core iGPU Emissions - Witcher 3 Fan Noise
min: 36.8 avg: 38.4 median: 38.5 (62%) max: 40 dB(A)
Witcher 3 Fan Noise + Intel Graphics 4-Cores iGPU (Arc)
min: 27.3 avg: 37.3 median: 37 (59%) max: 44.9 dB(A)
Average Benchmarks Intel Arc 7-Core iGPU → 100% n=3 Average Benchmarks Intel HD Graphics P630 → 18% n=3 Average Benchmarks Intel Graphics 4-Cores iGPU (Arc) → 67% n=3
- Bereich der Benchmarkergebnisse für diese Grafikkarte
- Durchschnittliche Benchmarkergebnisse für diese Grafikkarte
* Smaller numbers mean a higher performance
1 This benchmark is not used for the average calculation
Spiele-Benchmarks Die folgenden Benchmarks basieren auf unseren Spieletests mit Testnotebooks. Die Performance dieser Grafikkarte bei den gelisteten Spielen ist abhängig von der verwendeten CPU, Speicherausstattung, Treiber und auch Betriebssystem. Dadurch müssen die untenstehenden Werte nicht repräsentativ sein. Detaillierte Informationen über das verwendete System sehen Sie nach einem Klick auf den fps-Wert.
100%
Arc 7-Core:
64.3 66.2 [X] Asus NUC 14 Pro 1131675
Intel Core Ultra 5 125H 3.6GHz
Arc 7-Core
min:
56 fps, P1:
54 fps, max:
77 fps
~ 65 fps
100%
Arc 7-Core:
56.6 57.6 [X] Asus NUC 14 Pro 1131675
Intel Core Ultra 5 125H 3.6GHz
Arc 7-Core
min:
47 fps, P1:
46 fps, max:
68 fps
~ 57 fps
100%
Arc 7-Core:
41.7 43.4 [X] Asus NUC 14 Pro 1131675
Intel Core Ultra 5 125H 3.6GHz
Arc 7-Core
min:
34 fps, P1:
35 fps, max:
51 fps
~ 43 fps
100%
Arc 7-Core:
58.7 68 ~ 63 fps
100%
Arc 7-Core:
53.5 60 ~ 57 fps
100%
Arc 7-Core:
37.3 40 ~ 39 fps
64%
Graphics 4-Core:
23.9 26 ~ 25 fps
100%
Arc 7-Core:
79.4 [X] GMK NucBox K9 959964
Intel Core Ultra 5 125H 3.6GHz
Arc 7-Core
min:
63 fps, P1:
66 fps, max:
96 fps
fps
100%
Arc 7-Core:
71.9 [X] GMK NucBox K9 959964
Intel Core Ultra 5 125H 3.6GHz
Arc 7-Core
min:
61 fps, P1:
59 fps, max:
86 fps
fps
100%
Arc 7-Core:
52.9 [X] GMK NucBox K9 959964
Intel Core Ultra 5 125H 3.6GHz
Arc 7-Core
min:
46 fps, P1:
45 fps, max:
61 fps
fps
Graphics 4-Core:
7 7.6 8 ~ 8 fps
100%
Arc 7-Core:
133 141 148.6 [X] GMK NucBox K9 1.47.22.14 D3D12
Intel Core Ultra 5 125H 3.6GHz
Arc 7-Core
min:
45.8 fps, P1:
118.4 fps, max:
307 fps
149 ~ 143 fps
100%
Arc 7-Core:
63 63.9 [X] GMK NucBox K9 1.47.22.14 D3D12
Intel Core Ultra 5 125H 3.6GHz
Arc 7-Core
min:
33.2 fps, P1:
54.3 fps, max:
195.6 fps
68 69.5 ~ 66 fps
100%
Arc 7-Core:
50 53.5 [X] GMK NucBox K9 1.47.22.14 D3D12
Intel Core Ultra 5 125H 3.6GHz
Arc 7-Core
min:
28.6 fps, P1:
42 fps, max:
266 fps
54 57.7 ~ 54 fps
100%
Arc 7-Core:
40 43.5 [X] GMK NucBox K9 1.47.22.14 D3D12
Intel Core Ultra 5 125H 3.6GHz
Arc 7-Core
min:
8.2 fps, P1:
17.8 fps, max:
299 fps
44 47.3 ~ 44 fps
100%
Arc 7-Core:
31 35 35 [X] GMK NucBox K9 Intel Core Ultra 5 125H 3.6GHz
Arc 7-Core
min:
32 fps, max:
41 fps
~ 34 fps
100%
Arc 7-Core:
80 85 88 ~ 84 fps
100%
Arc 7-Core:
45 51 52 ~ 49 fps
Average Gaming Intel Arc 7-Core iGPU → 100% Average Gaming 30-70 fps → 100%
Average Gaming Intel Graphics 4-Cores iGPU (Arc) → 66% Average Gaming 30-70 fps → 67%
Intel Graphics 4-Cores iGPU (Arc) low med. high ultra QHD 4K F1 24 38 33 Cyberpunk 2077 2.1 Phantom Liberty 19 16 13 12 Baldur's Gate 3 17 13 12 11 F1 23 42 39 25 7.14 F1 22 44 39 29 8 Tiny Tina's Wonderlands 28 23 16 13 Strange Brigade 110 47 37 29 Far Cry 5 44 24 23 21 X-Plane 11.11 36 29 24 Final Fantasy XV Benchmark 41 23 17 Dota 2 Reborn 90 59 58 54 The Witcher 3 86 53 29 16 GTA V 121 107 20 8 < 30 fps < 60 fps < 120 fps ≥ 120 fps 3 6 3 1 6 6 1 10 2 9 1
v1.28
log 05. 05:49:47
#0 ran 0s before starting gpusingle class +0s ... 0s
#1 checking url part for id 12257 +0s ... 0s
#2 checking url part for id 7657 +0s ... 0s
#3 checking url part for id 12259 +0s ... 0s
#4 redirected to Ajax server, took 1728100187s time from redirect:0 +0s ... 0s
#5 did not recreate cache, as it is less than 5 days old! Created at Fri, 04 Oct 2024 05:16:46 +0200 +0s ... 0s
#6 composed specs +0.003s ... 0.003s
#7 did output specs +0s ... 0.003s
#8 start showIntegratedCPUs +0s ... 0.003s
#9 getting avg benchmarks for device 12257 +0.02s ... 0.023s
#10 got single benchmarks 12257 +0.001s ... 0.024s
#11 getting avg benchmarks for device 7657 +0s ... 0.025s
#12 got single benchmarks 7657 +0.003s ... 0.028s
#13 getting avg benchmarks for device 12259 +0.004s ... 0.032s
#14 got single benchmarks 12259 +0.006s ... 0.038s
#15 got avg benchmarks for devices +0s ... 0.038s
#16 min, max, avg, median took s +0.028s ... 0.066s
#17 before gaming benchmark output +0s ... 0.066s
#18 Got 667 rows for game benchmarks. +0.044s ... 0.11s
#19 composed SQL query for gamebenchmarks +0s ... 0.11s
#20 got data and put it in $dataArray +0.003s ... 0.113s
#21 benchmarks composed for output. +0.014s ... 0.127s
#22 calculated avg scores. +0s ... 0.127s
#23 return log +0.001s ... 0.128s
Teilen Sie diesen Artikel, um uns zu unterstützen. Jeder Link hilft!
Autor: Klaus Hinum, 8.09.2017 (Update: 1.07.2023)