Notebookcheck Logo

Qualcomm Adreno 690 vs ARM Mali-G71 MP2 vs Qualcomm Adreno 685

Qualcomm Adreno 690

► remove from comparison Qualcomm Adreno 690
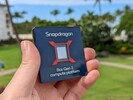
Die Qualcomm Adreno 690 ist eine im Qualcomm Snapdragon 8cx Gen 3 ARM-SoC integrierte Grafikeinheit für Windows-Notebooks und Tablets. Laut Qualcomm um ca. 60% schneller als die Vorgängergeneration (8cx Gen 2).

Die integrierte Qualcomm-GPU entspricht von ihrer Leistung her etwa einer Intel UHD Graphics. Damit ist ihre Leistung für den alltäglichen Betrieb ausreichend, für größere Sprünge reicht es nicht. Die meisten Spiele laufen auf der Adreno 690 auch gar nicht, von einzelnen Titeln aus dem Windows-Store vielleicht abgesehen (siehe unser Test des ThinkPad X13s).

Der Chip wird im 5nm Verfahren bei Samsung (5LPE) gefertigt und eignet sich weiterhin für lüfterlose Notebooks mit passiver Kühlung (7-9 Watt Klasse).

ARM Mali-G71 MP2

► remove from comparison ARM Mali-G71 MP2

Die ARM Mali-G71 MP2 ist eine integrierte Einstiegsgrafikkarte in ARM-SoCs. Sie wird z.B. in den Mediatek Helio P23 SoCs verbaut mit 700 bzw 770 MHz taktfrequenz. Die MP2 Variante der G71 verbaut 2 der 32 möglichen Grafikkerne und unterstützt OpenGL ES 3.2, Vulkan 1.0, OpenCL 2.0, DirectX 11 FL11_1, RenderScript.

Qualcomm Adreno 685

► remove from comparison Qualcomm Adreno 685

Die Qualcomm Adreno 685 ist eine im Microsoft SQ1 integrierte Grafikeinheit für Windows-Tablets (Microsoft Surface X). Technisch eine Adreno 680 wie im Qualcomm Snapdragon 8cx ARM-SoC, jedoch wahrscheinlich höher getaktet. Microsoft gibt 2 Tflops theoretische Leistung an, versus 1.8 bei der Adreno 680 im 8cx.

Qualcomm Adreno 690ARM Mali-G71 MP2Qualcomm Adreno 685
Adreno 600 Serie
Adreno 660
Adreno 650 @ 0.25 - 0.67 GHz
Adreno 690
Adreno 685
Adreno 680
Adreno 644
Adreno 643 @ 0.81 GHz
Adreno 642
Adreno 642L
Adreno 640
Adreno 630
Adreno 620
Adreno 619
Adreno 619L
Adreno 618
Adreno 616
Adreno 613 @ 0.96 GHz
Adreno 612
Adreno 610
Mali-G78 MP24 24
Mali-G78 MP22 24
Mali-G78 MP20 24
Mali-G78 MP14 14
Mali-G77 MP11 11
Mali-G77 MP9 9
Mali-G76 MP16 16
Mali-G76 MP12 10
Mali-G76 MP10 10 @ 0.72 GHz
Mali-G68 MP5 5
Mali-G57 MP6 6
Mali-G57 MP5 5
Mali-G72 MP18 18 @ 0.85 GHz
Mali-G71 MP20 8 @ 0.9 GHz
Mali-G72 MP12 12 @ 0.85 GHz
Mali-G71 MP8 8 @ 0.9 GHz
Mali-G76 MP4 4 @ 0.8 GHz
Mali-G71 MP2 2 @ 0.77 GHz
Mali-G72 MP3 3 @ 0.85 GHz
Mali-G68 MP4 4
Mali-G52 MP6 6
Mali-G68 MP2 2
Mali-G52 MP2 2 @ 0.95 GHz
Mali-G52 MP1 1 @ 0.8 GHz
Mali-G57 MP4 4
Mali-G57 MP3 3
Mali-G57 MP2 2
Mali-G57 MP1 1
Mali-G51 MP4 4 @ 0.65 GHz
Adreno 660
Adreno 650 @ 0.25 - 0.67 GHz
Adreno 690
Adreno 685
Adreno 680
Adreno 644
Adreno 643 @ 0.81 GHz
Adreno 642
Adreno 642L
Adreno 640
Adreno 630
Adreno 620
Adreno 619
Adreno 619L
Adreno 618
Adreno 616
Adreno 613 @ 0.96 GHz
Adreno 612
Adreno 610
Shared Memoryjaneinja
APIDirectX 12OpenGL ES 3.2DirectX 12
Stromverbrauch7 Watt7 Watt
Herstellungsprozess5 nm16 nm7 nm
Erscheinungsdatum06.12.2018 03.06.2016 06.12.2018
CodenameMimir
ArchitekturBifrost
Pipelines2 - unified
Kerntakt770 (Boost) MHz
Herstellerseitewww.arm.com
CPU in Adreno 690GPU Base SpeedGPU Boost / Turbo
Qualcomm Snapdragon 8cx Gen 38 x 2400 MHz, 7 W? MHz? MHz
CPU in Mali-G71 MP2GPU Base SpeedGPU Boost / Turbo
Samsung Exynos 78858 x 2200 MHz? MHz? MHz
Samsung Exynos 79048 x 1800 MHz? MHz? MHz
Mediatek Helio P23 MT6763T8 x 2300 MHz770 MHz? MHz
min. - max.? MHz? MHz
CPU in Adreno 685GPU Base SpeedGPU Boost / Turbo
Microsoft SQ18 x 3000 MHz? MHz? MHz

Benchmarks

Performance Rating - 3DMark 11 + Fire Strike + Time Spy - Adreno 690
1.3 pt (4%)
3DMark - 3DMark Time Spy Score
909 Points (3%)
3DMark - 3DMark Time Spy Graphics
811 Points (2%)
3DMark - 3DMark Ice Storm Extreme Graphics
13392 Points (2%)
3DMark - 3DMark Cloud Gate Score
min: 8602     avg: 9818     median: 9818 (9%)     max: 11034 Points
3DMark - 3DMark Cloud Gate Graphics
min: 13768     avg: 16708     median: 16707.5 (4%)     max: 19647 Points
3DMark - 3DMark Fire Strike Standard Score
min: 2758     avg: 2835     median: 2834.5 (5%)     max: 2911 Points
3DMark - 3DMark Fire Strike Standard Graphics
min: 2837     avg: 2933     median: 2932.5 (3%)     max: 3028 Points
3DMark - 3DMark Ice Storm Graphics
14652 Points (2%)
3DMark - 3DMark Wild Life Extreme Unlimited
3067 Points (4%)
3DMark 11 - 3DM11 Performance Score
min: 3063     avg: 3085     median: 3077 (4%)     max: 3115 Points
1968 Points (3%)
3DMark 11 - 3DM11 Performance GPU
min: 2898     avg: 2930     median: 2912 (3%)     max: 2979 Points
1927 Points (2%)
Cinebench R10 Cinebench R10 Shading (32bit) + Qualcomm Adreno 690
Cinebench R10 - Cinebench R10 Shading (32bit)
558 Points (0%)
Cinebench R10 Shading (32bit) + Qualcomm Adreno 685
373 Points (0%)
Cinebench R15
Cinebench R15 OpenGL 64 Bit + Qualcomm Adreno 690
Cinebench R15 - Cinebench R15 OpenGL 64 Bit
min: 13.4     avg: 13.7     median: 13.7 (1%)     max: 14 fps
Cinebench R15 OpenGL Ref. Match 64 Bit + Qualcomm Adreno 690
Cinebench R15 - Cinebench R15 OpenGL Ref. Match 64 Bit
98 % (98%)
31.7 fps (1%)
GFXBench (DX / GLBenchmark) 2.7
GFXBench T-Rex HD Offscreen C24Z16 + ARM Mali-G71 MP2
GFXBench T-Rex HD Offscreen C24Z16 + Qualcomm Adreno 685
167.7 fps (1%)
ComputeMark v2.1 - ComputeMark v2.1 Result
2292 Points (2%)
PassMark PerformanceTest Mobile V1 - PerformanceTest Mobile V1 2D Graphics Tests
min: 2471     avg: 4582     median: 4550 (2%)     max: 6755 Points
PassMark PerformanceTest Mobile V1 - PerformanceTest Mobile V1 3D Graphics Tests
min: 1205     avg: 1444     median: 1451.5 (2%)     max: 1668 Points
Power Consumption - Furmark Stress Test Power Consumption - external Monitor *
min: 17     avg: 19.7     median: 19.7 (3%)     max: 22.3 Watt
Power Consumption - The Witcher 3 Power Consumption - external Monitor *
15.8 Watt (2%)
Power Consumption - Witcher 3 Power Consumption *
16.4 Watt (4%)

Average Benchmarks Qualcomm Adreno 690 → 0% n=0

Average Benchmarks ARM Mali-G71 MP2 → 0% n=0

Average Benchmarks Qualcomm Adreno 685 → 0% n=0

- Bereich der Benchmarkergebnisse für diese Grafikkarte
red legend - Durchschnittliche Benchmarkergebnisse für diese Grafikkarte
* Smaller numbers mean a higher performance
1 This benchmark is not used for the average calculation

Spiele-Benchmarks

Die folgenden Benchmarks basieren auf unseren Spieletests mit Testnotebooks. Die Performance dieser Grafikkarte bei den gelisteten Spielen ist abhängig von der verwendeten CPU, Speicherausstattung, Treiber und auch Betriebssystem. Dadurch müssen die untenstehenden Werte nicht repräsentativ sein. Detaillierte Informationen über das verwendete System sehen Sie nach einem Klick auf den fps-Wert.

F1 22

F1 22

2022
low 1920x1080
100%
Adreno 690:
26  fps
med. 1920x1080
100%
Adreno 690:
22.5  fps
high 1920x1080
100%
Adreno 690:
17  fps
ultra 1920x1080
100%
Adreno 690:
12.6  fps
PUBG Mobile

PUBG Mobile

2018
low
Mali-G71 MP2:
30  fps
med.
Mali-G71 MP2:
26 29 30 ~ 28 fps
high
Mali-G71 MP2:
21 29 29 30 ~ 27 fps
Arena of Valor

Arena of Valor

2018
low
Mali-G71 MP2:
60 60 60 ~ 60 fps
ultra
Mali-G71 MP2:
30 58 60 60 ~ 52 fps
Shadow Fight 3

Shadow Fight 3

2018
low
Mali-G71 MP2:
60  fps
high
Mali-G71 MP2:
60  fps
Battle Bay

Battle Bay

2018
high
Mali-G71 MP2:
47  fps
low 1280x720
100%
Adreno 690:
0 (!) 20.7 21.3 ~ 14 fps
med. 1920x1080
100%
Adreno 690:
0 (!) 18 18.9 ~ 12 fps
high 1920x1080
100%
Adreno 690:
0 (!) 16.1 16.3 ~ 11 fps
4K 3840x2160
Adreno 690:
0 (!)  fps
low 1280x720
100%
Adreno 690:
19  fps
med. 1920x1080
100%
Adreno 690:
12.3  fps
high 1920x1080
100%
Adreno 690:
7.3  fps
low 1280x720
100%
Adreno 690:
57.1 57.5 58.7 ~ 58 fps
med. 1366x768
100%
Adreno 690:
54.5 54.5 55.2 ~ 55 fps
high 1920x1080
100%
Adreno 690:
38.8 45.9 47 ~ 44 fps
ultra 1920x1080
100%
Adreno 690:
29.4 40.2 40.7 ~ 37 fps
low 1024x768
100%
Adreno 690:
0 (!) 35 38.6 ~ 25 fps
med. 1366x768
100%
Adreno 690:
0 (!) 31.5 ~ 16 fps
high 1920x1080
100%
Adreno 690:
0 (!) 19.1 ~ 10 fps
ultra 1920x1080
100%
Adreno 690:
0 (!) 8.5 ~ 4 fps
4K 3840x2160
Adreno 690:
0 (!)  fps
GTA V

GTA V

2015
low 1024x768
100%
Adreno 690:
29.9  fps
Dead Trigger 2

Dead Trigger 2

2013
high
Mali-G71 MP2:
46 48 54 60 ~ 52 fps
Asphalt 8: Airborne

Asphalt 8: Airborne

2013
low
Mali-G71 MP2:
29 30 ~ 30 fps
high
Mali-G71 MP2:
23 30 ~ 27 fps
Asphalt 9: Legends

Asphalt 9: Legends

2013
low
Mali-G71 MP2:
28 29 29 30 ~ 29 fps
high
Mali-G71 MP2:
23 24 25 28 29 29 ~ 26 fps
Temple Run 2

Temple Run 2

2013
high
Mali-G71 MP2:
59  fps

Average Gaming Qualcomm Adreno 690 → 100%

Average Gaming 30-70 fps → 100%

Qualcomm Adreno 690lowmed.highultraQHD4K
F1 222622.51712.6
X-Plane 11.11141211
Final Fantasy XV Benchmark1912.37.29
Dota 2 Reborn58554437
The Witcher 32516104
GTA V29.9
< 30 fps
< 60 fps
< 120 fps
≥ 120 fps
5
1

4
1

4
1

2
1


ARM Mali-G71 MP2lowmed.highultraQHD4K
PUBG Mobile302827
Arena of Valor6052
Shadow Fight 36060
Battle Bay47
Dead Trigger 252
Asphalt 8: Airborne3027
Asphalt 9: Legends2926
Temple Run 259
< 30 fps
< 60 fps
< 120 fps
≥ 120 fps
1
2
2
1


3
3
1

1


Eine Liste mit weiteren Spielen und allen Grafikkarten finden Sie auf unserer Seite: Welches Spiel ist mit welcher Grafikkarte spielbar?

v1.28
log 23. 15:01:11

#0 ran 0s before starting gpusingle class +0s ... 0s

#1 checking url part for id 11411 +0s ... 0s

#2 checking url part for id 8348 +0s ... 0s

#3 checking url part for id 9954 +0s ... 0s

#4 redirected to Ajax server, took 1734962470s time from redirect:0 +0s ... 0s

#5 did not recreate cache, as it is less than 5 days old! Created at Sun, 22 Dec 2024 05:19:32 +0100 +0s ... 0s

#6 composed specs +0.006s ... 0.006s

#7 did output specs +0s ... 0.006s

#8 start showIntegratedCPUs +0s ... 0.006s

#9 getting avg benchmarks for device 11411 +0.016s ... 0.023s

#10 got single benchmarks 11411 +0.001s ... 0.024s

#11 getting avg benchmarks for device 8348 +0s ... 0.024s

#12 got single benchmarks 8348 +0.021s ... 0.045s

#13 getting avg benchmarks for device 9954 +0s ... 0.045s

#14 got single benchmarks 9954 +0.003s ... 0.048s

#15 got avg benchmarks for devices +0s ... 0.048s

#16 min, max, avg, median took s +0.017s ... 0.065s

#17 before gaming benchmark output +0s ... 0.065s

#18 Got 77 rows for game benchmarks. +0.008s ... 0.073s

#19 composed SQL query for gamebenchmarks +0s ... 0.073s

#20 got data and put it in $dataArray +0.001s ... 0.074s

#21 benchmarks composed for output. +0.006s ... 0.08s

#22 calculated avg scores. +0s ... 0.08s

#23 return log +0.001s ... 0.081s

Teilen Sie diesen Artikel, um uns zu unterstützen. Jeder Link hilft!
Mail Logo
> Notebook Test, Laptop Test und News > Benchmarks / Technik > Benchmarks / Technik > Grafikkarten Vergleich - Head 2 Head
Autor: Klaus Hinum,  8.09.2017 (Update:  1.07.2023)