Notebookcheck Logo

Qualcomm Adreno 630 vs ARM Mali-G78 MP20

Qualcomm Adreno 630

► remove from comparison

Die Qualcomm Adreno 630 ist eine im Qualcomm Snapdragon 845 ARM-SoC integrierte Grafikeinheit für Smartphones und Tablets. Der Chip ist ab Anfang 2018 erhältlich und wird hauptsächlich in Android-basierten High-End Geräten eingesetzt.

Laut Qualcomm bietet die Adreno 630 GPU eine um 30% höhere Performance als die alte Adreno 530 im Snapdrago 835 bei 30% weniger Stromverbrauch.

ARM Mali-G78 MP20

► remove from comparison ARM Mali-G78 MP20
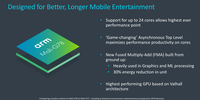
Die ARM Mali-G78MP20 ist eine integrierte High-End-Grafikeinheit für ARM-SoCs, die erstmals Ende 2021 im Smartphone-Chip Google Tensor verbaut wurde (z.B. MatePad Pro 12.6). Die G78MP20 integriert 20 der 24 Kerne/Cluster und nutzt die 2. Generation der Valhall-Architektur. Im Vergleich zur G77 bietet die G78 zwei neue Features: Asynchronous Top Level und Fragment Dependency Tracking.

Die GPU zählt damit zu den schnellsten Grafikkarten für Android-Smartphones und Tablets in 2021 und daher sollten alle aktuellen Spiele flüssig dargestellt werden.

An Grafik-APIs unterstützt die G78 OpenGL ES 3.2, Vulkan 1.1 und OpenCL 2.0.

Qualcomm Adreno 630ARM Mali-G78 MP20
Mali-G Serie
Adreno 660 compare
Adreno 650 compare @ 0.25 - 0.67 GHz
Adreno 690 compare
Adreno 685 compare
Adreno 680 compare
Adreno 644 compare
Adreno 643 compare @ 0.81 GHz
Adreno 642 compare
Adreno 642L compare
Adreno 640 compare
Adreno 630
Adreno 620 compare
Adreno 619 compare
Adreno 619L compare
Adreno 618 compare
Adreno 616 compare
Adreno 613 compare @ 0.96 GHz
Adreno 612 compare
Adreno 610 compare
Mali-G78 MP24 compare 24
Mali-G78 MP22 compare 24
Mali-G78 MP20 24
Mali-G78 MP14 compare 14
Mali-G77 MP11 compare 11
Mali-G77 MP9 compare 9
Mali-G76 MP16 compare 16
Mali-G76 MP12 compare 10
Mali-G76 MP10 compare 10 @ 0.72 GHz
Mali-G68 MP5 compare 5
Mali-G57 MP6 compare 6
Mali-G57 MP5 compare 5
Mali-G72 MP18 compare 18 @ 0.85 GHz
Mali-G71 MP20 compare 8 @ 0.9 GHz
Mali-G72 MP12 compare 12 @ 0.85 GHz
Mali-G71 MP8 compare 8 @ 0.9 GHz
Mali-G76 MP4 compare 4 @ 0.8 GHz
Mali-G71 MP2 compare 2 @ 0.77 GHz
Mali-G72 MP3 compare 3 @ 0.85 GHz
Mali-G68 MP4 compare 4
Mali-G52 MP6 compare 6
Mali-G68 MP2 compare 2
Mali-G52 MP2 compare 2 @ 0.95 GHz
Mali-G52 MP1 compare 1 @ 0.8 GHz
Mali-G57 MP4 compare 4
Mali-G57 MP3 compare 3
Mali-G57 MP2 compare 2
Mali-G57 MP1 compare 1
Mali-G51 MP4 compare 4 @ 0.65 GHz
Shared Memoryjanein
APIDirectX 12, OpenGL ES 3.2OpenGL ES 3.2
Herstellungsprozess10 nm5 nm
FeaturesOpenGL ES 3.2, OpenCL 2.0, DirectX 12
Erscheinungsdatum12.02.2018 26.05.2020
CodenameValhall
ArchitekturValhall
Pipelines24 - unified
Herstellerseitewww.arm.com
CPU in Adreno 630GPU Base SpeedGPU Boost / Turbo
Qualcomm Snapdragon 8508 x 2750 MHz? MHz? MHz
Qualcomm Snapdragon 8458 x 2800 MHz? MHz? MHz
min. - max.? MHz? MHz
CPU in Mali-G78 MP20GPU Base SpeedGPU Boost / Turbo
Google Tensor8 x 1800 MHz? MHz848 MHz

Benchmarks

3DMark - 3DMark Ice Storm Extreme Graphics
27848 Points (3%)
3DMark - 3DMark Cloud Gate Score
3108 Points (3%)
3DMark - 3DMark Cloud Gate Graphics
6347 Points (2%)
3DMark - 3DMark Fire Strike Standard Score
770 Points (1%)
3DMark - 3DMark Fire Strike Standard Graphics
821 Points (1%)
3DMark - 3DMark Ice Storm Graphics
30971 Points (3%)
min: 7344     avg: 8841     median: 9526 (41%)     max: 9654 Points
min: 11005     avg: 13516     median: 13988 (31%)     max: 15556 Points
min: 6606     avg: 7184     median: 7205 (36%)     max: 7742 Points
min: 8605     avg: 9432     median: 8957 (27%)     max: 10733 Points
0 Points (0%)
0 Points (0%)
0 Points (0%)
0 Points (0%)
3DMark - 3DMark Wild Life Unlimited
min: 7057     avg: 7127     median: 7064 (4%)     max: 7261 Points
3DMark - 3DMark Wild Life Extreme Unlimited
min: 1626     avg: 1816     median: 1823 (2%)     max: 1998 Points
3DMark - 3DMark Night Raid
2636 Points (2%)
3DMark - 3DMark Night Raid Graphics Score
3037 Points (1%)
Cinebench R10 Cinebench R10 Shading (32bit) + Qualcomm Adreno 630
Cinebench R10 - Cinebench R10 Shading (32bit)
257 Points (0%)
GFXBench - GFXBench 5.0 4K Aztec Ruins High Tier Offscreen
14 fps (6%)
GFXBench - GFXBench 5.0 Aztec Ruins High Tier Offscreen
min: 11     avg: 15.6     median: 14 (3%)     max: 31 fps
min: 23     avg: 27     median: 28 (5%)     max: 30 fps
GFXBench - GFXBench 5.0 Aztec Ruins Normal Tier Offscreen
min: 29     avg: 35.2     median: 37 (3%)     max: 38 fps
min: 49     avg: 58.7     median: 58 (4%)     max: 69 fps
min: 40     avg: 46.7     median: 48 (5%)     max: 52 fps
min: 60     avg: 75     median: 65 (1%)     max: 100 fps
min: 89     avg: 110     median: 90 (5%)     max: 151 fps
GFXBench (DX / GLBenchmark) 2.7
GFXBench T-Rex HD Offscreen C24Z16 + Qualcomm Adreno 630
GFXBench T-Rex HD Offscreen C24Z16 + ARM Mali-G78 MP20
min: 125     avg: 173.7     median: 144 (1%)     max: 252 fps
Antutu v9 - AnTuTu v9 GPU
min: 270503     avg: 282634     median: 282630 (35%)     max: 294770 Points
Basemark GPU 1.2 - Basemark GPU 1.2 Vulkan Official Medium Offscreen 1080
88.8 fps (1%)
PassMark PerformanceTest Mobile V1 - PerformanceTest Mobile V1 2D Graphics Tests
min: 10791     avg: 11937     median: 11936.5 (4%)     max: 13082 Points
PassMark PerformanceTest Mobile V1 - PerformanceTest Mobile V1 3D Graphics Tests
min: 4195     avg: 4225     median: 4225 (7%)     max: 4255 Points
Power Consumption - GFXBench Aztec Ruins Normal Tier Offscreen Power Consumption 150cd *
min: 8.65     avg: 9.8     median: 10.3 (4%)     max: 10.4 Watt

Average Benchmarks Qualcomm Adreno 630 → 100% n=14

Average Benchmarks ARM Mali-G78 MP20 → 104% n=14

- Bereich der Benchmarkergebnisse für diese Grafikkarte
- Durchschnittliche Benchmarkergebnisse für diese Grafikkarte
* Smaller numbers mean a higher performance
1 This benchmark is not used for the average calculation

Spiele-Benchmarks

Die folgenden Benchmarks basieren auf unseren Spieletests mit Testnotebooks. Die Performance dieser Grafikkarte bei den gelisteten Spielen ist abhängig von der verwendeten CPU, Speicherausstattung, Treiber und auch Betriebssystem. Dadurch müssen die untenstehenden Werte nicht repräsentativ sein. Detaillierte Informationen über das verwendete System sehen Sie nach einem Klick auf den fps-Wert.

Armajet

Armajet

2020
high
Mali-G78 MP20:
60  fps
low 1920x1080
100%
Adreno 630:
29.3  fps
high 1920x1080
100%
Adreno 630:
27.8  fps
low 1280x720
Adreno 630:
0 (!)  fps
PUBG Mobile

PUBG Mobile

2018
low
100%
Adreno 630:
60  fps
med.
100%
Adreno 630:
40 40 ~ 40 fps
high
100%
Adreno 630:
30 30 30 30 35 40 40 40 40 40 40 ~ 36 fps
97%
Mali-G78 MP20:
30 40 ~ 35 fps
World of Tanks Blitz

World of Tanks Blitz

2018
high
100%
Adreno 630:
60  fps
Arena of Valor

Arena of Valor

2018
low
100%
Adreno 630:
31 60 60 60 60 60 60 60 60 61 ~ 57 fps
ultra
100%
Adreno 630:
44 58 59 60 60 60 60 60 60 60 60 60 60 60 60 61 ~ 59 fps
Shadow Fight 3

Shadow Fight 3

2018
low
100%
Adreno 630:
60 60 60 60 60 ~ 60 fps
high
100%
Adreno 630:
60 60 60 60 60 60 60 ~ 60 fps
Battle Bay

Battle Bay

2018
low
100%
Adreno 630:
60 60 60 60 ~ 60 fps
high
100%
Adreno 630:
60 60 109 ~ 76 fps
Thief

Thief

2014
low 1024x768
100%
Adreno 630:
6  fps
med. 1366x768
100%
Adreno 630:
5  fps
high 1366x768
100%
Adreno 630:
5  fps
ultra 1920x1080
100%
Adreno 630:
3  fps
Dead Trigger 2

Dead Trigger 2

2013
high
100%
Adreno 630:
60  fps
142%
Mali-G78 MP20:
85  fps
Asphalt 8: Airborne

Asphalt 8: Airborne

2013
low
100%
Adreno 630:
29  fps
high
100%
Adreno 630:
30  fps
Asphalt 9: Legends

Asphalt 9: Legends

2013
low
100%
Adreno 630:
29 30 30 30 30 ~ 30 fps
high
100%
Adreno 630:
30 30 30 30 30 30 61 ~ 34 fps
low 1280x720
100%
Adreno 630:
20  fps
med. 1366x768
100%
Adreno 630:
14  fps
high 1366x768
100%
Adreno 630:
13  fps
ultra 1920x1080
100%
Adreno 630:
4  fps
Real Racing 3

Real Racing 3

2013
low
100%
Adreno 630:
60  fps
high
100%
Adreno 630:
101  fps
Temple Run 2

Temple Run 2

2013
high
Mali-G78 MP20:
90  fps
low 1024x768
100%
Adreno 630:
10.3  fps
Subway Surfers

Subway Surfers

2012
high
100%
Adreno 630:
60  fps
Minecraft - Pocket Edition

Minecraft - Pocket Edition

2011
ultra
100%
Adreno 630:
60  fps

Average Gaming Qualcomm Adreno 630 → 100%

Average Gaming 30-70 fps → 100%

Average Gaming ARM Mali-G78 MP20 → 119%

Average Gaming 30-70 fps → 97%

ARM Mali-G78 MP20lowmed.highultraQHD4K
Armajet60
PUBG Mobile35
Dead Trigger 285
Temple Run 290
< 30 fps
< 60 fps
< 120 fps
≥ 120 fps


1
3


Qualcomm Adreno 630lowmed.highultraQHD4K
Hearthstone29.327.8
League of Legends
PUBG Mobile604036
World of Tanks Blitz60
Arena of Valor5759
Shadow Fight 36060
Battle Bay6076
Thief6553
Dead Trigger 260
Asphalt 8: Airborne2930
Asphalt 9: Legends3034
BioShock Infinite2014134
Real Racing 360101
Diablo III10.3
Subway Surfers60
Minecraft - Pocket Edition60
< 30 fps
< 60 fps
< 120 fps
≥ 120 fps
5
2
4
2
1

3
3
6
2
1
1


Eine Liste mit weiteren Spielen und allen Grafikkarten finden Sie auf unserer Seite: Welches Spiel ist mit welcher Grafikkarte spielbar?

Add one or more devices and compare

In the following list you can select (and also search for) devices that should be added to the comparison. You can select more than one device.

restrict list:

show all (including archived), 2024, 2023
v1.28
log 10. 11:42:06

#0 ran 0s before starting gpusingle class +0s ... 0s

#1 checking url part for id 8780 +0s ... 0s

#2 checking url part for id 11098 +0s ... 0s

#3 redirected to Ajax server, took 1731235326s time from redirect:0 +0s ... 0s

#4 did not recreate cache, as it is less than 5 days old! Created at Sun, 10 Nov 2024 05:17:12 +0100 +0s ... 0s

#5 composed specs +0.003s ... 0.003s

#6 did output specs +0s ... 0.003s

#7 start showIntegratedCPUs +0s ... 0.003s

#8 getting avg benchmarks for device 8780 +0.02s ... 0.023s

#9 got single benchmarks 8780 +0.022s ... 0.045s

#10 getting avg benchmarks for device 11098 +0s ... 0.046s

#11 got single benchmarks 11098 +0.004s ... 0.05s

#12 got avg benchmarks for devices +0s ... 0.05s

#13 No cached benchmark found, getting uncached values +0.009s ... 0.059s

#14 No cached benchmark found, getting uncached values +0.001s ... 0.06s

#15 No cached benchmark found, getting uncached values +0.001s ... 0.061s

#16 No cached benchmark found, getting uncached values +0.001s ... 0.062s

#17 min, max, avg, median took s +0.011s ... 0.073s

#18 before gaming benchmark output +0s ... 0.073s

#19 Got 96 rows for game benchmarks. +0.012s ... 0.085s

#20 composed SQL query for gamebenchmarks +0s ... 0.085s

#21 got data and put it in $dataArray +0.001s ... 0.087s

#22 benchmarks composed for output. +0.006s ... 0.093s

#23 calculated avg scores. +0s ... 0.093s

#24 return log +0.002s ... 0.095s

Teilen Sie diesen Artikel, um uns zu unterstützen. Jeder Link hilft!
> Notebook Test, Laptop Test und News > Benchmarks / Technik > Benchmarks / Technik > Grafikkarten Vergleich - Head 2 Head
Autor: Klaus Hinum,  8.09.2017 (Update:  1.07.2023)