Notebookcheck Logo

Apple A18 vs WonderMedia PRIZM WM8950 vs DK3.5+ST

Apple A18

► remove from comparison Apple A18

the A18 scores 8085, while the A18 Pro earns a score of 8408

WonderMedia PRIZM WM8950

► remove from comparison  WM8950

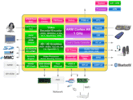
Der VIA WonderMedia PRIZM WM8950 ist ein günstiger Einsteiger-SoC für Tablets und Smartphones. Er ist hauptsächlich für Android 4.x und Windows CE gedacht und bietet folgende Komponenten: 

  • Einzelkern Cortex-A9 Prozessor mit 1GHz Taktrate
  • ARM Mali 400(MP2?) Grafikkarte
  • Multi-Standard 1080p Video Decoding, H.264 Video Encoding
  • DDR3/LPDDR2 Speicherkontroller
  • Hardware Security Engine

ModelApple A18WonderMedia PRIZM WM8950DK3.5+ST
SeriesApple Huawei
Serie:
Apple A18 « - 3.8 GHz6 / 6 cores
Apple A18 Pro - 4 GHz6 / 6 cores
HiSilicon Kirin 9000W1.53 - 2.49 GHz12 / 12 cores
UNISOC Tiger T3101.8 - 2 GHz4 / 4 cores
Rockchip RK32881.8 GHz4 / 4 cores
Apple A6x1.4 GHzcores
Apple A61 GHzcores
Apple S52 / 2 cores
HiSilicon k3v2 Hi36201.2 GHz4 / 4 cores
Rockchip RK3066 1.5 GHz1.5 GHz2 / 2 cores
Amlogic AML8726-MX1.5 GHz2 / 2 cores
Rockchip RK31681.2 GHz2 / 2 cores
Rockchip RK2918 1.2 GHz1.2 GHz1 / 1 cores
ARM Cortex A8 1.2 GHz1.2 GHz1 / 1 cores
Telechips TCC8803 1GHz1 GHz1 / 1 cores
Loongson 2F 900MHz0.9 GHz1 / 1 cores
CSR86700.08 GHzcores
ARM Cortex-M4 cores
HiSilicon Hi6262 cores
DK3.5+STcores
unknown cores
HiSilicon Kirin 910T1.8 GHz4 / 4 cores Cortex-A9
Rockchip RK31881.8 GHz4 / 4 cores Cortex-A9
HiSilicon Kirin 9101.6 GHz4 / 4 cores Cortex-A9
Renesas MP52321.5 GHz2 / 2 cores Cortex-A9
Broadcom BCM21664T1.2 GHz2 / 2 cores Cortex-A9
Marvell PXA9861.2 GHz2 / 2 cores Cortex-A9
NXP i.MX 6SLL1 GHz1 / 1 cores Cortex-A9
WonderMedia PRIZM WM8950 « 1 GHz1 / 1 cores Cortex-A9
Apple A18 - 3.8 GHz6 / 6 cores
Apple A18 Pro - 4 GHz6 / 6 cores
HiSilicon Kirin 9000W1.53 - 2.49 GHz12 / 12 cores
UNISOC Tiger T3101.8 - 2 GHz4 / 4 cores
Rockchip RK32881.8 GHz4 / 4 cores
Apple A6x1.4 GHzcores
Apple A61 GHzcores
Apple S52 / 2 cores
HiSilicon k3v2 Hi36201.2 GHz4 / 4 cores
Rockchip RK3066 1.5 GHz1.5 GHz2 / 2 cores
Amlogic AML8726-MX1.5 GHz2 / 2 cores
Rockchip RK31681.2 GHz2 / 2 cores
Rockchip RK2918 1.2 GHz1.2 GHz1 / 1 cores
ARM Cortex A8 1.2 GHz1.2 GHz1 / 1 cores
Telechips TCC8803 1GHz1 GHz1 / 1 cores
Loongson 2F 900MHz0.9 GHz1 / 1 cores
CSR86700.08 GHzcores
ARM Cortex-M4 cores
HiSilicon Hi6262 cores
DK3.5+ST « cores
unknown cores
Clock <=3800 MHz1000 MHz
Cores / Threads6 / 6
2 x Apple A18 P-Core
4 x 3.8 GHz Apple A18 E-Core
1 / 12
TDP Turbo PL210 Watt
Technology3 nm
Features16-core Neural Engine, USB 2.0 (480 Mbps)
ArchitectureARMARM
Announced
CodenameCortex-A9
iGPUARM Mali-400 MP
Manufacturerwww.wondermedia.com.tw

Benchmarks

Geekbench 6.2 - Geekbench 6.2 Single-Core
100%
1 A18 +
3149 Points (85%)
Geekbench 6.2 - Geekbench 6.2 Multi-Core
100%
1 A18 +
7663 Points (30%)
Geekbench 5.5 - Geekbench 5.1 - 5.5 64 Bit Single-Core
100%
1 A18 +
2327 Points (92%)
Geekbench 5.5 - Geekbench 5.1 - 5.5 64 Bit Multi-Core
100%
1 A18 +
6130 Points (11%)
Linpack Android / IOS - Linpack Multi Thread
100%
1 WM8950 +
30.8 MFLOPS (1%)
Linpack Android / IOS - Linpack Single Thread
100%
1 WM8950 +
37.5 MFLOPS (4%)
Mozilla Kraken 1.1 - Kraken 1.1 Total Score *
100%
1 A18 +
290.2 ms (0%)
Sunspider - Sunspider 0.9.1 Total Score *
100%
1 WM8950 +
2410 ms (23%)
Octane V2 - Octane V2 Total Score
100%
1 A18 +
90158 Points (79%)
WebXPRT 4 - WebXPRT 4 Score
100%
1 A18 +
263 Points (76%)
Quadrant Standard Edition 2.0 - Quadrant Standard 2.0 Total Score
100%
1 WM8950 +
2140 points (5%)
AnTuTu v3 - AnTuTu v3 CPU
100%
1 WM8950 +
1282 Points (8%)
PassMark PerformanceTest Mobile V1 - PerformanceTest Mobile V1 CPU Tests
100%
1 A18 +
12600 Points (2%)
CrossMark - CrossMark Overall
100%
1 A18 +
1407 Points (54%)
Power Consumption - Geekbench 5.5 Power Consumption 150cd *
100%
1 A18 +
4.9 Watt (2%)
Power Consumption - Idle Power Consumption 150cd 1min *
100%
1 A18 +
0.9 Watt (1%)

Average Benchmarks Apple A18 → 0% n=0

Average Benchmarks WonderMedia PRIZM WM8950 → 0% n=0

- Bereich der Benchmarkergebnisse für diese Grafikkarte
- Durchschnittliche Benchmarkergebnisse für diese Grafikkarte
* Smaller numbers mean a higher performance
1 This benchmark is not used for the average calculation

v1.28
log 28. 10:16:28

#0 ran 0s before starting gpusingle class +0s ... 0s

#1 checking url part for id 18007 +0s ... 0s

#2 checking url part for id 3778 +0s ... 0s

#3 checking url part for id 12765 +0s ... 0s

#4 redirected to Ajax server, took 1727511388s time from redirect:0 +0s ... 0s

#5 did not recreate cache, as it is less than 5 days old! Created at Sat, 28 Sep 2024 05:16:31 +0200 +0s ... 0s

#6 composed specs +0.003s ... 0.003s

#7 did output specs +0s ... 0.003s

#8 getting avg benchmarks for device 18007 +0.001s ... 0.004s

#9 got single benchmarks 18007 +0.004s ... 0.008s

#10 getting avg benchmarks for device 3778 +0.001s ... 0.008s

#11 got single benchmarks 3778 +0.003s ... 0.011s

#12 getting avg benchmarks for device 12765 +0.001s ... 0.012s

#13 got single benchmarks 12765 +0.003s ... 0.015s

#14 got avg benchmarks for devices +0s ... 0.015s

#15 min, max, avg, median took s +0.007s ... 0.021s

#16 return log +0s ... 0.021s
Teilen Sie diesen Artikel, um uns zu unterstützen. Jeder Link hilft!
> Notebook Test, Laptop Test und News > Benchmarks / Technik > Benchmarks / Technik > Prozessor Vergleich - Head 2 Head
Autor: Klaus Hinum,  8.09.2017 (Update:  1.07.2023)