

Apple A18 Pro vs Apple A15 Bionic vs Apple A18
Apple A18 Pro
► remove from comparison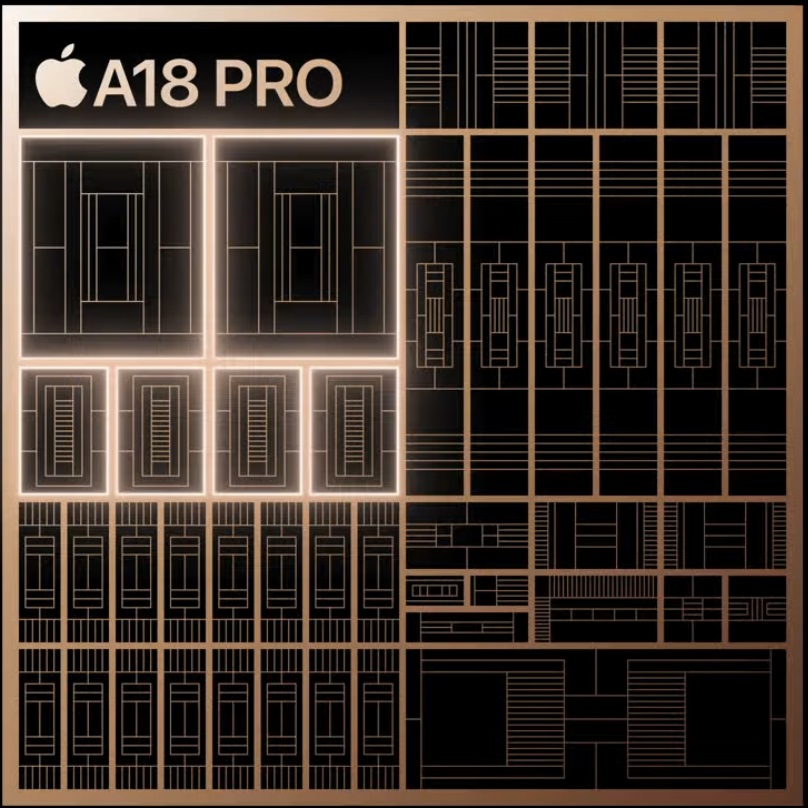
Der Apple A18 Pro ist ein System on a Chip (SoC) von Apple, der in der iPhone-16-Pro-Serie verbaut wird. Er integriert sechs 64-Bit-fähige ARM-Kerne, die Apple selbst designed hat, sowie eine NPU mit 16 Kernen. Die zwei Performance-Kerne können mit bis zu 4,04 GHz takten und die vier Effizienzkerne mit bis zu 2,2 GHz.
Laut Apple erreicht der A18 Pro eine um 15 Prozent höhere CPU-Performance als der A17 Pro bei einer gleichzeitig um 20 Prozent niedrigeren Leistungsaufnahme. Gegenüber dem A18 verfügt der A18 Pro unter anderem über mehr Cache-Speicher, Next-Gen-ML-Beschleuniger, 6 statt 5 GPU-Kerne und unterstützt neben höheren USB-3-Geschwindigkeiten auch ProRes.
Die integrierte 6-Kern-GPU soll rund 20 Prozent schneller laufen als die GPU des A17 Pro. Zudem attestiert ihr Apple eine doppelt so hohe Hardware-Raytracing-Performance. Weiters kann der Chip AV1-Videos dekodieren und erlaubt es durch den verbesserten Signal-Prozessor einem iPhone 16 Pro bzw. Pro Max, 4K-Videos mit bis zu 120 Bildern pro Sekunde aufzuzeichnen.
Die Neural Engine des A18 Pro verfügt genauso wie der A17 Pro über 16 Kerne, soll Apple-Intelligence-Funktionen allerdings bis zu 15 Prozent schneller ausführen können. Die Rechenleistung der NPU beziffert Apple auf 35 Billionen Rechenoperationen pro Sekunde (TOPS).
Der A18 Pro wird im 3-nm-Prozess der zweiten Generation bei TSMC produziert (N3E).
Apple A15 Bionic
► remove from comparison
Der Apple A15 Bionic ist System on a Chip (SoC) von Apple, der in der iPhone 13 und iPad Mini 2021 Serie verbaut wird. Er integriert sechs 64-Bit-fähige ARM-Kerne (2 Performance Kerne mit bis zu 3,24 GHz, 4 Stromsparkerne mit bis zu 2,02 GHz). Laut Apple wurde der System Cache verdoppelt und bietet eine schnellere GPU, schnellere Neural Engine. Der Chip ist mit 15.8 Milliarden Transistoren relativ groß.
Apple A18
► remove from comparison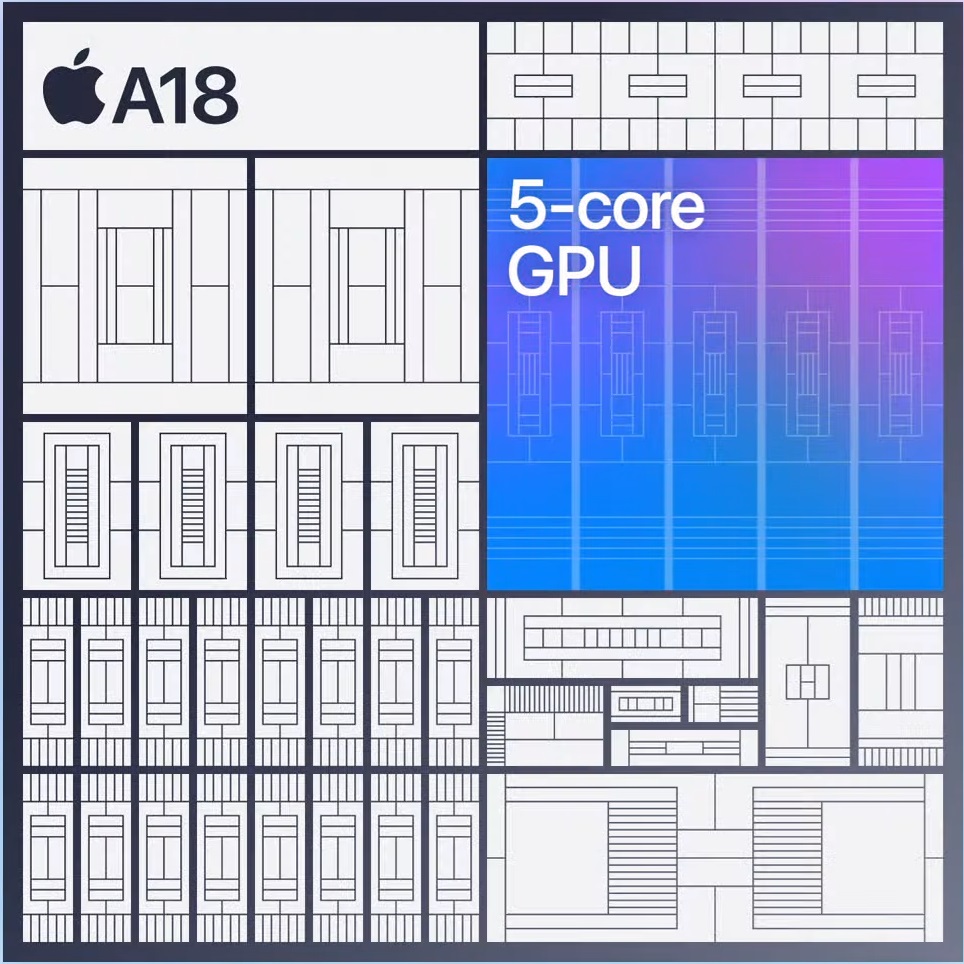
Der Apple A18 ist ein moderner Smartphone-SoC welcher 2024 im iPhone 16 und 16 Plus vorgestellt wurde. Der Prozessorteil basiert aus 2 Performance-Kernen mit bis zu 4 GHz und 4 Effizienzkerne. Weiters integriert der SoC 8 GB, eine 35 TOP NPU für AI-Beschleunigung und eine neue 5-Kern GPU.
Die Performance ist in unseren Benchmarks knapp oberhalb des alten Apple A17 Pro SoCs (iPhone 15 Pro Serie). Wie üblich glänzt der Prozessorteil mit einer hervorragenden Single-Thread-Leistung, welcher deutlich oberhalb der Konkurrenz für Android Smartphones wie dem Snapdragon 8 Gen 3 oder MediaTek Dimensity 9300. In Multi-Thread-Benchmarks verringert sich der Vorsprung zur Konkurrenz deutlich, trotzdem kann hier der aktuelle Spitzenreiter Dimensity 9300 noch knapp geschlagen werden im Geekbench 6.2. Nur der Apple 18 Pro ist durch die größeren Caches noch etwas schneller.
Der Prozessor wird im modernen 3nm Prozess bei TSMC hergestellt (N3E) und unterstützt das aktuelle ARMv9.2-A Instruktions-Set.
| Model | Apple A18 Pro | Apple A15 Bionic | Apple A18 | ||||||||||||||||||||||||||||||||||||||||||||||||||||||||||||||||||||||||
| Series | Apple Apple A-Series | Apple Apple A-Series | Apple Apple A-Series | ||||||||||||||||||||||||||||||||||||||||||||||||||||||||||||||||||||||||
| Serie: Apple A-Series |
|
|
| ||||||||||||||||||||||||||||||||||||||||||||||||||||||||||||||||||||||||
| Clock | <=4000 MHz | 2020 - 3230 MHz | <=3800 MHz | ||||||||||||||||||||||||||||||||||||||||||||||||||||||||||||||||||||||||
| Cores / Threads | 6 / 6 2 x 4.0 GHz Apple A18 P-Core 4 x 2.2 GHz Apple A18 E-Core | 6 / 6 | 6 / 6 2 x Apple A18 P-Core 4 x 4.0 GHz Apple A18 E-Core | ||||||||||||||||||||||||||||||||||||||||||||||||||||||||||||||||||||||||
| TDP Turbo PL2 | 10 Watt | 9 Watt | |||||||||||||||||||||||||||||||||||||||||||||||||||||||||||||||||||||||||
| Technology | 3 nm | 5 nm | 3 nm | ||||||||||||||||||||||||||||||||||||||||||||||||||||||||||||||||||||||||
| Features | 16-core Neural Engine, USB 3.2 Gen 2 (10 Gbps) | ARMv8 Instruction Set, Machine Learning Controller, 16-Core Neural Engine, Secure Enclave, Advanced Image Signal Processor | 16-core Neural Engine, USB 2.0 (480 Mbps) | ||||||||||||||||||||||||||||||||||||||||||||||||||||||||||||||||||||||||
| Architecture | ARM | ARM | ARM | ||||||||||||||||||||||||||||||||||||||||||||||||||||||||||||||||||||||||
| Announced | |||||||||||||||||||||||||||||||||||||||||||||||||||||||||||||||||||||||||||
| L2 Cache | 16 MB | 4 MB | |||||||||||||||||||||||||||||||||||||||||||||||||||||||||||||||||||||||||
| L3 Cache | 32 MB | ||||||||||||||||||||||||||||||||||||||||||||||||||||||||||||||||||||||||||
| Transistors | 15800 Million | ||||||||||||||||||||||||||||||||||||||||||||||||||||||||||||||||||||||||||
| iGPU | Apple A15 GPU 5-Core | Apple A18 GPU |

Benchmarks
Average Benchmarks Apple A18 Pro → 100% n=8
Average Benchmarks Apple A15 Bionic → 69% n=8
Average Benchmarks Apple A18 → 95% n=8
* Smaller numbers mean a higher performance
1 This benchmark is not used for the average calculation