Intel Graphics 4-Cores iGPU (Arc) vs Intel Arc 8-Core iGPU
Intel Graphics 4-Cores iGPU (Arc) ► remove from comparison
Die Intel Graphics iGPU mit 4 Kernen ist eine integrierte Grafikkarte basierend auf die Xe LPG Architektur (ähnlich zu den dedizierten Arc GPUs, jedoch mit Fokus auf Effizienz). Sie bietet 4 Xe Kerne (64 Xe Vector Engines), 4 Raytracing Einheiten, 4 Sampler und 2 Pixel Backends.
Im Gegensatz zu der stärkeren Variante mit 8 Kernen in den H Meteor Lake CPUs, darf die kleine Variante nicht den Arc Namen nutzen.
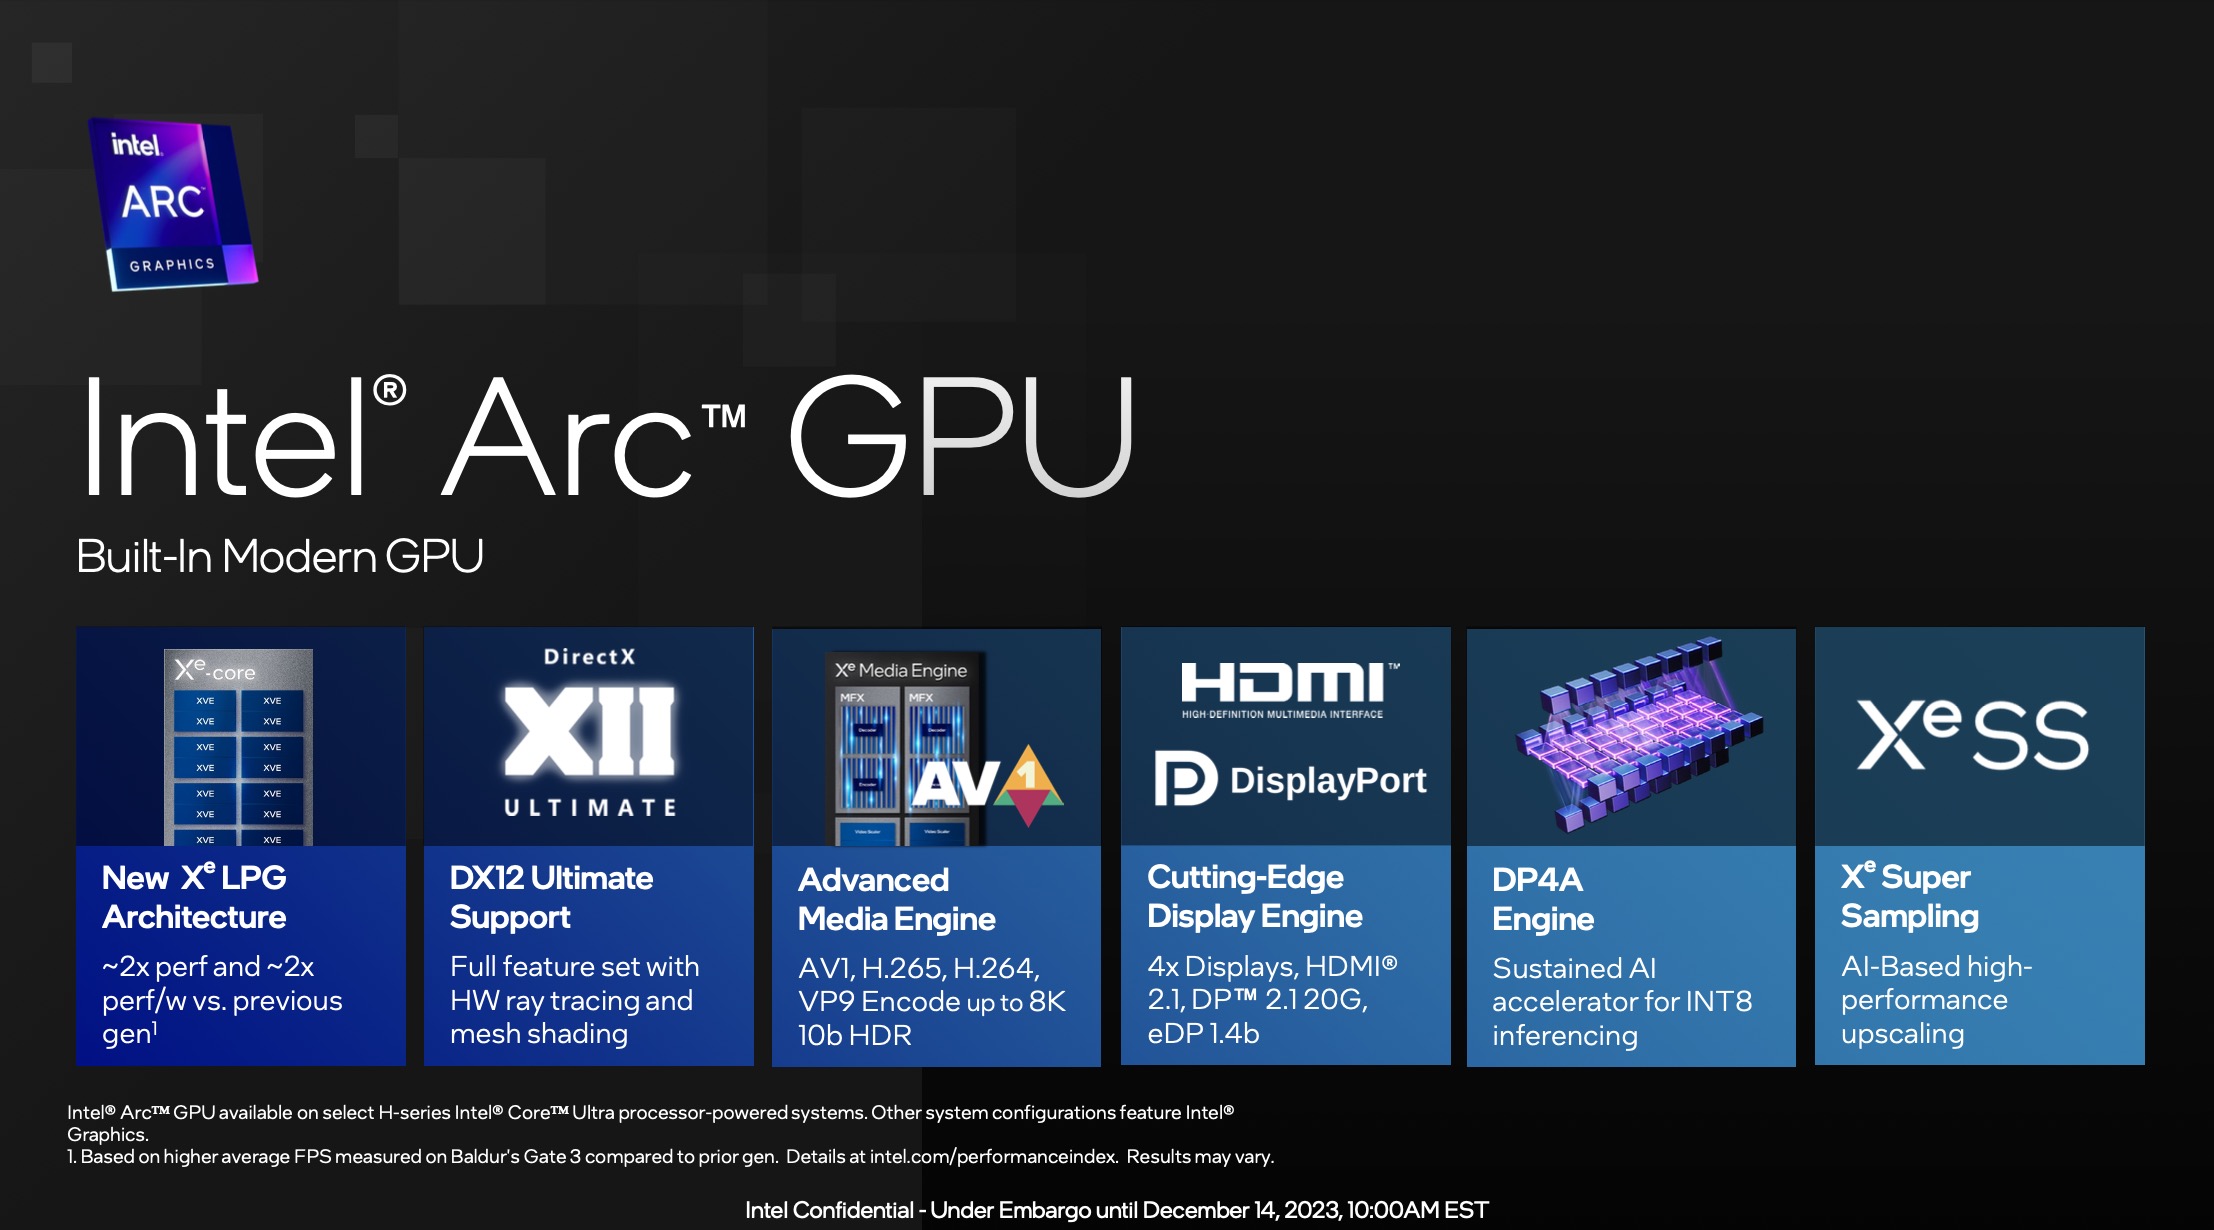
Die iGPU unterstützt DirectX 12 Ultimate (wahrscheinlich DX 12_2 wie die Desktop Arc GPUs). Weiters unterstützt die Grafikeinheit XeSS AI Super Sampling.
Die Media Engine ist bei Meteor Lake im SOC Tile und unterstützt bis zu 8k60 10-bit HDR Encode und Deccode von MPEG2, AVC, VP9, HEVC und AV1. Die Display Engine ist ebenfalls im SoC Tile und unterstützt HDMI 2.1 und DisplayPort 2.1 20G mit bis zu 8K60 HDR.
Der GPU Tile des Meteor Lake Chips wird bei TSMC in 5nm (5N Prozess) gefertigt.
Intel Arc 8-Core iGPU ► remove from comparison
Die Intel Arc iGPU mit 8 Kernen (ID 7D55) ist eine integrierte Grafikkarte in Meteor Lake SoCs basierend auf die Xe LPG Architektur (ähnlich zu den dedizierten Arc GPUs, jedoch mit Fokus auf Effizienz). Sie bietet alle 8 Xe Kerne (128 Xe Vector Engines), 8 Raytracing Einheiten, 8 Sampler und 4 Pixel Backends.
Der Arc Name darf nur genutzt werden, wenn mindestens 16 GB RAM im Dual Channel Modus verwendet werden. Sonst heisst die nur iGPU "Intel Graphics " und ist ebenfalls deutlich langsamer.
Laut Intel konnte die Performance im Vergleich zur Vorgängergeneration (wahrscheinlich noch in Alder Lake) verdoppelt werden.
Die iGPU unterstützt DirectX 12 Ultimate (wahrscheinlich DX 12_2 wie die Desktop Arc GPUs). Weiters unterstützt die Grafikeinheit XeSS AI Super Sampling.
Die Media Engine ist bei Meteor Lake im SOC Tile und unterstützt bis zu 8k60 10-bit HDR Encode und Deccode von MPEG2, AVC, VP9, HEVC und AV1. Die Display Engine ist ebenfalls im SoC Tile und unterstützt HDMI 2.1 und DisplayPort 2.1 20G mit bis zu 8K60 HDR.
Der GPU Tile des Meteor Lake Chips wird bei TSMC in 5nm (5N Prozess) gefertigt.
Intel Graphics 4-Cores iGPU (Arc) Intel Arc 8-Core iGPU Arc LPG Serie Codename Meteor Lake iGPU Meteor Lake iGPU Architektur Xe LPG Xe LPG Pipelines 4 - unified 8 - unified Raytracing Cores 4 8 Kerntakt 1950 (Boost) MHz 2300 (Boost) MHz Cache L1: 768 KB L1: 1.5 MB Shared Memory nein ja API DirectX 12_2, OpenGL 4.6, Vulkan 1.3 DirectX 12_2, OpenGL 4.6, Vulkan 1.3 Herstellungsprozess 5 nm 5 nm Displays HDMI 2.1, DisplayPort 2.1 20G HDMI 2.1b, DisplayPort 2.0 20G Erscheinungsdatum 14.12.2023 14.12.2023
CPU in Graphics 4-Core GPU Base Speed GPU Boost / Turbo Intel Core Ultra 7 165U 12 x 3800 MHz, 15 W ? MHz 2000 MHz Intel Core Ultra 7 155U 12 x 3800 MHz, 15 W ? MHz 1950 MHz Intel Core Ultra 7 164U 12 x 3800 MHz, 9 W ? MHz 1800 MHz » show 3 more Intel Core Ultra 5 135U 12 x 3600 MHz, 15 W ? MHz 1900 MHz Intel Core Ultra 5 125U 12 x 3600 MHz, 15 W ? MHz 1850 MHz Intel Core Ultra 5 134U 12 x 3600 MHz, 9 W ? MHz 1750 MHz min. - max. ? MHz 1750 - 2000 MHz
CPU in Arc 8-Core GPU Base Speed GPU Boost / Turbo Intel Core Ultra 9 185H 16 x 3800 MHz, 45 W ? MHz 2350 MHz Intel Core Ultra 7 165H 16 x 3800 MHz, 28 W ? MHz 2300 MHz Intel Core Ultra 7 155H 16 x 3800 MHz, 28 W ? MHz 2250 MHz Intel Core Ultra 5 135H 14 x 3600 MHz, 28 W ? MHz 2200 MHz min. - max. ? MHz 1750 - 2350 MHz
Benchmarks Performance Rating - 3DMark 11 + Fire Strike + Time Spy - Arc 8-Core
3.8 pt (12%)
...
...
max:
3DMark - 3DMark Time Spy Score
min: 1876 avg: 2008 median: 1920.5 (6%) max: 2315 Points
min: 2178 avg: 3448 median: 3537 (10%) max: 4176 Points
3DMark - 3DMark Time Spy Graphics
min: 1668 avg: 1788 median: 1708 (5%) max: 2067 Points
min: 2018 avg: 3151 median: 3205 (8%) max: 3770 Points
3DMark - 3DMark Ice Storm Unlimited Graphics
397122 Points (45%)
3DMark - 3DMark Ice Storm Extreme Graphics
min: 78589 avg: 119169 median: 119168 (15%) max: 159748 Points
3DMark - 3DMark Cloud Gate Score
min: 20124 avg: 22079 median: 22433.5 (24%) max: 23325 Points
min: 18794 avg: 30168 median: 30680 (33%) max: 37020 Points
3DMark - 3DMark Cloud Gate Graphics
min: 25786 avg: 28204 median: 28416.5 (7%) max: 30198 Points
min: 35698 avg: 42699 median: 43941 (12%) max: 51286 Points
3DMark - 3DMark Fire Strike Standard Score
min: 3952 avg: 4666 median: 4766 (8%) max: 5179 Points
min: 5203 avg: 7532 median: 7739.5 (14%) max: 9084 Points
3DMark - 3DMark Fire Strike Standard Graphics
min: 4284 avg: 4982 median: 5088 (6%) max: 5468 Points
min: 5568 avg: 8253 median: 8409.5 (9%) max: 9692 Points
3DMark - 3DMark Ice Storm Graphics
min: 88046 avg: 168980 median: 173445 (21%) max: 215292 Points
3DMark - 3DMark Wild Life Extreme Unlimited
min: 4294 avg: 5953 median: 5869 (7%) max: 6686 Points
3DMark - 3DMark Night Raid
min: 13461 avg: 23722 median: 25035 (24%) max: 28237 Points
3DMark - 3DMark Night Raid Graphics Score
min: 25821 avg: 30856 median: 32273 (12%) max: 33783 Points
3DMark 11 - 3DM11 Performance Score
min: 6340 avg: 7107 median: 7250.5 (10%) max: 7588 Points
min: 7756 avg: 11782 median: 12143 (17%) max: 13943 Points
3DMark 11 - 3DM11 Performance GPU
min: 6007 avg: 6629 median: 6726 (6%) max: 7055 Points
min: 8064 avg: 11842 median: 12167.5 (10%) max: 13716 Points
3DMark Vantage + Intel Arc 8-Core iGPU 3DMark Vantage - 3DM Vant. Perf. total
min: 38739 avg: 40267 median: 38877 (11%) max: 43185 Points
3DM Vant. Perf. GPU no PhysX + Intel Arc 8-Core iGPU 3DMark Vantage - 3DM Vant. Perf. GPU no PhysX
min: 33028 avg: 35245 median: 33524 (19%) max: 39184 Points
3DMark 05 - 3DMark 05 - Standard
min: 42967 avg: 44045 median: 44044.5 (48%) max: 45122 Points
3DMark 06 3DMark 06 - Standard 1280x1024 + Intel Arc 8-Core iGPU
min: 36831 avg: 37523 median: 37522.5 (49%) max: 38214 Points
Unigine Valley 1.0 - Unigine Valley 1.0 DX
min: 17.1 avg: 17.8 median: 17.8 (6%) max: 18.5 fps
SPECviewperf 12 + Intel Arc 8-Core iGPU SPECviewperf 12 - specvp12 sw-03
min: 42.7 avg: 42.9 median: 42.9 (11%) max: 43 fps
specvp12 snx-02 + Intel Arc 8-Core iGPU SPECviewperf 12 - specvp12 snx-02
min: 3.29 avg: 3.4 median: 3.4 (1%) max: 3.56 fps
specvp12 showcase-01 + Intel Arc 8-Core iGPU SPECviewperf 12 - specvp12 showcase-01
min: 18.2 avg: 19.1 median: 19.1 (4%) max: 19.9 fps
specvp12 mediacal-01 + Intel Arc 8-Core iGPU SPECviewperf 12 - specvp12 mediacal-01
min: 15.9 avg: 16.4 median: 16.4 (4%) max: 16.9 fps
specvp12 maya-04 + Intel Arc 8-Core iGPU SPECviewperf 12 - specvp12 maya-04
min: 54.9 avg: 56.5 median: 56.5 (15%) max: 58 fps
specvp12 energy-01 + Intel Arc 8-Core iGPU SPECviewperf 12 - specvp12 energy-01
min: 0.67 avg: 0.8 median: 0.8 (1%) max: 0.91 fps
specvp12 creo-01 + Intel Arc 8-Core iGPU SPECviewperf 12 - specvp12 creo-01
min: 22.7 avg: 22.9 median: 22.9 (9%) max: 23.1 fps
specvp12 catia-04 + Intel Arc 8-Core iGPU SPECviewperf 12 - specvp12 catia-04
min: 48.2 avg: 49.8 median: 49.8 (8%) max: 51.3 fps
specvp12 3dsmax-05 + Intel Arc 8-Core iGPU SPECviewperf 12 - specvp12 3dsmax-05
min: 49.7 avg: 49.8 median: 49.8 (9%) max: 49.8 fps
SPECviewperf 13 specvp13 sw-04 + Intel Arc 8-Core iGPU SPECviewperf 13 - specvp13 sw-04
min: 44.8 avg: 45.2 median: 45.2 (12%) max: 45.6 fps
specvp13 snx-03 + Intel Arc 8-Core iGPU SPECviewperf 13 - specvp13 snx-03
min: 5.9 avg: 6.2 median: 6.2 (1%) max: 6.43 fps
specvp13 showcase-02 + Intel Arc 8-Core iGPU SPECviewperf 13 - specvp13 showcase-02
min: 18.2 avg: 19.1 median: 19.1 (4%) max: 19.9 fps
specvp13 medical-02 + Intel Arc 8-Core iGPU SPECviewperf 13 - specvp13 medical-02
min: 25 avg: 27.4 median: 27.4 (6%) max: 29.7 fps
specvp13 maya-05 + Intel Arc 8-Core iGPU SPECviewperf 13 - specvp13 maya-05
min: 59.5 avg: 61 median: 61 (7%) max: 62.5 fps
specvp13 energy-02 + Intel Arc 8-Core iGPU SPECviewperf 13 - specvp13 energy-02
min: 5.27 avg: 5.5 median: 5.5 (2%) max: 5.69 fps
specvp13 creo-02 + Intel Arc 8-Core iGPU SPECviewperf 13 - specvp13 creo-02
min: 29.3 avg: 29.5 median: 29.5 (4%) max: 29.6 fps
specvp13 catia-05 + Intel Arc 8-Core iGPU SPECviewperf 13 - specvp13 catia-05
min: 71.6 avg: 74.2 median: 74.2 (8%) max: 76.8 fps
specvp13 3dsmax-06 + Intel Arc 8-Core iGPU SPECviewperf 13 - specvp13 3dsmax-06
min: 46.4 avg: 47.5 median: 47.5 (8%) max: 48.5 fps
SPECviewperf 2020 specvp2020 solidworks-05 4k + Intel Arc 8-Core iGPU SPECviewperf 2020 - specvp2020 solidworks-05 4k
min: 11 avg: 11.6 median: 11.6 (3%) max: 12.1 fps
specvp2020 snx-04 4k + Intel Arc 8-Core iGPU SPECviewperf 2020 - specvp2020 snx-04 4k
min: 5.7 avg: 6 median: 6 (1%) max: 6.24 fps
specvp2020 medical-03 4k + Intel Arc 8-Core iGPU SPECviewperf 2020 - specvp2020 medical-03 4k
min: 4.23 avg: 4.6 median: 4.6 (4%) max: 5.05 fps
specvp2020 maya-06 4k + Intel Arc 8-Core iGPU SPECviewperf 2020 - specvp2020 maya-06 4k
min: 35.4 avg: 36.6 median: 36.6 (6%) max: 37.7 fps
specvp2020 energy-03 4k + Intel Arc 8-Core iGPU SPECviewperf 2020 - specvp2020 energy-03 4k
min: 4.61 avg: 5.3 median: 5.3 (1%) max: 6.03 fps
specvp2020 creo-03 4k + Intel Arc 8-Core iGPU SPECviewperf 2020 - specvp2020 creo-03 4k
min: 17.9 avg: 18.2 median: 18.2 (9%) max: 18.5 fps
specvp2020 catia-06 4k + Intel Arc 8-Core iGPU SPECviewperf 2020 - specvp2020 catia-06 4k
min: 10 avg: 10.6 median: 10.6 (7%) max: 11.1 fps
specvp2020 3dsmax-07 4k + Intel Arc 8-Core iGPU SPECviewperf 2020 - specvp2020 3dsmax-07 4k
min: 12.9 avg: 13.9 median: 13.9 (6%) max: 14.9 fps
Cinebench R10 Cinebench R10 Shading (32bit) + Intel Arc 8-Core iGPU Cinebench R10 - Cinebench R10 Shading (32bit)
min: 17440 avg: 18121 median: 18429 (13%) max: 18495 Points
Cinebench R11.5 Cinebench R11.5 OpenGL 64 Bit + Intel Arc 8-Core iGPU Cinebench R11.5 - Cinebench R11.5 OpenGL 64 Bit
min: 101.92 avg: 106 median: 107.1 (37%) max: 108.87 fps
Cinebench R15 + Intel Graphics 4-Cores iGPU (Arc) Cinebench R15 - Cinebench R15 OpenGL 64 Bit
min: 98.4 avg: 105.1 median: 105 (6%) max: 112 fps
Cinebench R15 OpenGL 64 Bit + Intel Arc 8-Core iGPU
min: 135.3 avg: 152.4 median: 152.5 (9%) max: 176.3 fps
Cinebench R15 OpenGL Ref. Match 64 Bit + Intel Graphics 4-Cores iGPU (Arc) Cinebench R15 - Cinebench R15 OpenGL Ref. Match 64 Bit
97.8 % (98%)
Cinebench R15 OpenGL Ref. Match 64 Bit + Intel Arc 8-Core iGPU
97.8 % (98%)
GFXBench - GFXBench 5.0 4K Aztec Ruins High Tier Offscreen
min: 36.6 avg: 38.6 median: 38.6 (16%) max: 40.5 fps
GFXBench - GFXBench 5.0 Aztec Ruins High Tier Offscreen
83.4 fps (15%)
GFXBench - GFXBench 5.0 Aztec Ruins Normal Tier Offscreen
min: 210 avg: 221.6 median: 221.6 (16%) max: 233.2 fps
GFXBench - GFXBench Car Chase Offscreen
167.1 fps (19%)
GFXBench (DX / GLBenchmark) 2.7 + Intel Arc 8-Core iGPU GFXBench (DX / GLBenchmark) 2.7 - GFXBench T-Rex HD Offscreen C24Z16
817 fps (7%)
Basemark GPU 1.2 - Basemark GPU 1.2 Vulkan Official Medium Offscreen 1080
min: 104.6 avg: 127.7 median: 104.6 (1%) max: 196.9 fps
min: 104.6 avg: 230.1 median: 279 (2%) max: 345 fps
Basemark GPU 1.2 - Basemark GPU 1.2 Vulkan Official High Offscreen 2160
3.6 fps (1%)
3.6 fps (1%)
Geekbench 6.2 - Geekbench 6.2 GPU OpenCL
min: 15823 avg: 16921 median: 17012 (5%) max: 17837 Points
min: 17911 avg: 32156 median: 34454 (10%) max: 36188 Points
Geekbench 6.2 - Geekbench 6.2 GPU Vulkan
min: 15598 avg: 17716 median: 17799.5 (6%) max: 19667 Points
min: 20875 avg: 31141 median: 33079 (11%) max: 34520 Points
LuxMark v2.0 64Bit - LuxMark v2.0 Room GPU
min: 549 avg: 634 median: 640 (3%) max: 714 Samples/s
LuxMark v2.0 64Bit - LuxMark v2.0 Sala GPU
min: 2319 avg: 2554 median: 2611 (5%) max: 2732 Samples/s
ComputeMark v2.1 - ComputeMark v2.1 Result
min: 6270 avg: 7126 median: 7480 (8%) max: 7627 Points
Power Consumption - Furmark Stress Test Power Consumption - external Monitor *
25.3 Watt (4%)
min: 35 avg: 48.1 median: 49.5 (7%) max: 60.6 Watt
Power Consumption - The Witcher 3 Power Consumption - external Monitor *
24.4 Watt (3%)
min: 27 avg: 42.7 median: 43.8 (6%) max: 55.8 Watt
Power Consumption - Witcher 3 Power Consumption *
min: 27.4 avg: 33.2 median: 30.7 (7%) max: 41.5 Watt
min: 29.7 avg: 47.3 median: 47.1 (10%) max: 60.9 Watt
Power Consumption - Witcher 3 ultra Power Efficiency
min: 0.4313 avg: 0.5 median: 0.4 (43%) max: 0.4886 fps per Watt
min: 0.3826 avg: 0.5 median: 0.5 (49%) max: 0.585 fps per Watt
Power Consumption - Witcher 3 ultra Power Efficiency - external Monitor
0.5 fps per Watt (40%)
min: 0.4516 avg: 0.5 median: 0.5 (44%) max: 0.615 fps per Watt
Emissions Witcher 3 Fan Noise + Intel Graphics 4-Cores iGPU (Arc) Emissions - Witcher 3 Fan Noise
min: 27.3 avg: 34.3 median: 31 (50%) max: 44.7 dB(A)
Witcher 3 Fan Noise + Intel Arc 8-Core iGPU
min: 27 avg: 38 median: 37.9 (61%) max: 46.3 dB(A)
Average Benchmarks Intel Graphics 4-Cores iGPU (Arc) → 100% n=14 Average Benchmarks Intel Arc 8-Core iGPU → 167% n=14
- Bereich der Benchmarkergebnisse für diese Grafikkarte
- Durchschnittliche Benchmarkergebnisse für diese Grafikkarte
* Smaller numbers mean a higher performance
1 This benchmark is not used for the average calculation
Spiele-Benchmarks Die folgenden Benchmarks basieren auf unseren Spieletests mit Testnotebooks. Die Performance dieser Grafikkarte bei den gelisteten Spielen ist abhängig von der verwendeten CPU, Speicherausstattung, Treiber und auch Betriebssystem. Dadurch müssen die untenstehenden Werte nicht repräsentativ sein. Detaillierte Informationen über das verwendete System sehen Sie nach einem Klick auf den fps-Wert.
Arc 8-Core:
18 [X] Lenovo Yoga Pro 7 14 Intel Core Ultra 7 155H 3.8GHz
Arc 8-Core
min:
13.1 fps, P0.1:
13.6 fps, P1:
14.8 fps, max:
22.7 fps
fps
Arc 8-Core:
14.5 [X] Lenovo Yoga Pro 7 14 Intel Core Ultra 7 155H 3.8GHz
Arc 8-Core
min:
2.52 fps, P0.1:
2.78 fps, P1:
10.3 fps, max:
18.6 fps
fps
Arc 8-Core:
30.6 [X] Lenovo Yoga Pro 7 14 Intel Core Ultra 7 155H 3.8GHz
Arc 8-Core
min:
24 fps, P0.1:
24 fps, P1:
24.5 fps, max:
44.3 fps
fps
Arc 8-Core:
27.1 [X] Lenovo Yoga Pro 7 14 Intel Core Ultra 7 155H 3.8GHz
Arc 8-Core
min:
20.1 fps, P0.1:
20.3 fps, P1:
21.6 fps, max:
41.7 fps
fps
Arc 8-Core:
18.5 [X] Lenovo Yoga Pro 7 14 Intel Core Ultra 7 155H 3.8GHz
Arc 8-Core
min:
13.2 fps, P0.1:
13.4 fps, P1:
14.9 fps, max:
23.3 fps
fps
Arc 8-Core:
16.2 [X] Lenovo Yoga Pro 7 14 Intel Core Ultra 7 155H 3.8GHz
Arc 8-Core
min:
12.3 fps, P0.1:
12.3 fps, P1:
13.5 fps, max:
21.9 fps
fps
Arc 8-Core:
69 [X] Lenovo Yoga Pro 7 14 Intel Core Ultra 7 155H 3.8GHz
Arc 8-Core
min:
28 fps
fps
Arc 8-Core:
56 [X] Lenovo Yoga Pro 7 14 Intel Core Ultra 7 155H 3.8GHz
Arc 8-Core
min:
20 fps
fps
Arc 8-Core:
49 [X] Lenovo Yoga Pro 7 14 Intel Core Ultra 7 155H 3.8GHz
Arc 8-Core
min:
8 fps
fps
Arc 8-Core:
29 [X] Lenovo Yoga Pro 7 14 Intel Core Ultra 7 155H 3.8GHz
Arc 8-Core
min:
7 fps
fps
Arc 8-Core:
45.8 [X] Acemagic F2A Intel Core Ultra 7 155H 3.8GHz
Arc 8-Core
min:
14.5 fps, P0.1:
37.2 fps, P1:
38.5 fps, max:
92.5 fps
73.9 ~ 60 fps
Arc 8-Core:
39.1 [X] Acemagic F2A Intel Core Ultra 7 155H 3.8GHz
Arc 8-Core
min:
13.6 fps, P0.1:
30.9 fps, P1:
33.7 fps, max:
100.7 fps
52.4 ~ 46 fps
Arc 8-Core:
33.9 [X] Acemagic F2A Intel Core Ultra 7 155H 3.8GHz
Arc 8-Core
min:
10.5 fps, P0.1:
22.8 fps, P1:
29.4 fps, max:
108.3 fps
46.4 ~ 40 fps
Arc 8-Core:
27.6 [X] Acemagic F2A Intel Core Ultra 7 155H 3.8GHz
Arc 8-Core
min:
13.3 fps, P0.1:
18.8 fps, P1:
24.3 fps, max:
102.3 fps
40.3 ~ 34 fps
Arc 8-Core:
152.6 [X] Minisforum AtomMan X7 Ti Intel Core Ultra 9 185H 3.8GHz
Arc 8-Core
min:
12 fps, P0.1:
63.1 fps, P1:
101 fps, max:
349 fps
183.9 [X] Acemagic F2A Intel Core Ultra 7 155H 3.8GHz
Arc 8-Core
min:
19.6 fps, P0.1:
45.2 fps, P1:
128.5 fps, max:
834 fps
208 ~ 182 fps
Arc 8-Core:
111.5 [X] Minisforum AtomMan X7 Ti Intel Core Ultra 9 185H 3.8GHz
Arc 8-Core
min:
12.6 fps, P0.1:
32.5 fps, P1:
79.6 fps, max:
693 fps
128.6 [X] Acemagic F2A Intel Core Ultra 7 155H 3.8GHz
Arc 8-Core
min:
17.2 fps, P0.1:
40.4 fps, P1:
90.9 fps, max:
415 fps
142.8 ~ 128 fps
Arc 8-Core:
108.6 [X] Minisforum AtomMan X7 Ti Intel Core Ultra 9 185H 3.8GHz
Arc 8-Core
min:
10.4 fps, P0.1:
35.2 fps, P1:
76 fps, max:
283 fps
120.9 [X] Acemagic F2A Intel Core Ultra 7 155H 3.8GHz
Arc 8-Core
min:
18 fps, P0.1:
32.4 fps, P1:
93.7 fps, max:
461 fps
134.2 ~ 121 fps
Arc 8-Core:
82.7 93.1 [X] Minisforum AtomMan X7 Ti Intel Core Ultra 9 185H 3.8GHz
Arc 8-Core
116 ~ 97 fps
Arc 8-Core:
62.5 70.6 [X] Minisforum AtomMan X7 Ti Intel Core Ultra 9 185H 3.8GHz
Arc 8-Core
74.8 ~ 69 fps
Arc 8-Core:
45.6 53.6 53.6 [X] Minisforum AtomMan X7 Ti Intel Core Ultra 9 185H 3.8GHz
Arc 8-Core
~ 51 fps
Arc 8-Core:
35.5 40.6 47 [X] Minisforum AtomMan X7 Ti Intel Core Ultra 9 185H 3.8GHz
Arc 8-Core
~ 41 fps
100%
Graphics 4-Core:
18.5 [X] Lenovo ThinkBook 14 2-in-1 G4 IML 2.02
Intel Core Ultra 5 125U 3.6GHz
Graphics 4-Core
min:
6.99 fps, max:
32.4 fps
20.3 20.9 21.6 ~ 20 fps
100%
Graphics 4-Core:
15 [X] Lenovo ThinkBook 14 2-in-1 G4 IML 2.02
Intel Core Ultra 5 125U 3.6GHz
Graphics 4-Core
min:
6.99 fps, max:
20.5 fps
16.7 16.9 17.6 ~ 17 fps
147%
Arc 8-Core:
9.4 16.3 23.8 [X] AcePC Wizbox AI 2.12
Intel Core Ultra 7 155H 3.8GHz
Arc 8-Core
min:
18.8 fps, max:
36.9 fps
24.8 [X] Acemagic F2A 2.11
Intel Core Ultra 7 155H 3.8GHz
Arc 8-Core
min:
19.6 fps, max:
37.4 fps
25.4 26.3 26.3 26.5 26.8 27.9 [X] Minisforum AtomMan X7 Ti 2.11
Intel Core Ultra 9 185H 3.8GHz
Arc 8-Core
min:
24.4 fps, max:
32.5 fps
28.4 29.5 29.5 29.6 ~ 25 fps
100%
Graphics 4-Core:
12.4 [X] Lenovo ThinkBook 14 2-in-1 G4 IML 2.02
Intel Core Ultra 5 125U 3.6GHz
Graphics 4-Core
min:
6.86 fps, max:
20.8 fps
14.3 14.4 14.9 ~ 14 fps
150%
Arc 8-Core:
7.3 15.1 16.9 17.8 [X] AcePC Wizbox AI 2.12
Intel Core Ultra 7 155H 3.8GHz
Arc 8-Core
min:
11.8 fps, max:
32.3 fps
20.4 [X] Acemagic F2A 2.11
Intel Core Ultra 7 155H 3.8GHz
Arc 8-Core
min:
13.8 fps, max:
35.3 fps
22.5 22.8 22.8 22.9 23.4 24 24 [X] Minisforum AtomMan X7 Ti 2.11
Intel Core Ultra 9 185H 3.8GHz
Arc 8-Core
min:
20.6 fps, max:
28.4 fps
24.6 25 25.2 ~ 21 fps
100%
Graphics 4-Core:
11.1 [X] Lenovo ThinkBook 14 2-in-1 G4 IML 2.02
Intel Core Ultra 5 125U 3.6GHz
Graphics 4-Core
min:
3.55 fps, max:
25.9 fps
12.5 12.7 13 ~ 12 fps
100%
Graphics 4-Core:
15 15.4 16.2 17.7 [X] Lenovo ThinkBook 14 2-in-1 G4 IML Intel Core Ultra 5 125U 3.6GHz
Graphics 4-Core
~ 16 fps
100%
Graphics 4-Core:
12.3 12.6 14.5 [X] Lenovo ThinkBook 14 2-in-1 G4 IML Intel Core Ultra 5 125U 3.6GHz
Graphics 4-Core
~ 13 fps
100%
Graphics 4-Core:
11 fps
100%
Graphics 4-Core:
10.6 fps
Arc 8-Core:
45.7 [X] Acemagic F2A Intel Core Ultra 7 155H 3.8GHz
Arc 8-Core
min:
11.6 fps, P0.1:
27.2 fps, P1:
39.8 fps, max:
116.8 fps
61 ~ 53 fps
Arc 8-Core:
35.4 [X] Acemagic F2A Intel Core Ultra 7 155H 3.8GHz
Arc 8-Core
min:
17.3 fps, P0.1:
18.6 fps, P1:
30.4 fps, max:
93.9 fps
44.1 ~ 40 fps
Arc 8-Core:
24.6 [X] Acemagic F2A Intel Core Ultra 7 155H 3.8GHz
Arc 8-Core
min:
5.68 fps, P0.1:
9.48 fps, P1:
20.2 fps, max:
90.6 fps
30.9 ~ 28 fps
Arc 8-Core:
18.7 [X] Acemagic F2A Intel Core Ultra 7 155H 3.8GHz
Arc 8-Core
min:
7.17 fps, P0.1:
7.84 fps, P1:
16 fps, max:
58.8 fps
22.2 ~ 20 fps
100%
Graphics 4-Core:
39.9 [X] Lenovo ThinkBook 14 2-in-1 G4 IML 959964
Intel Core Ultra 5 125U 3.6GHz
Graphics 4-Core
min:
32 fps, P1:
32 fps, max:
50 fps
41.7 43.8 46.3 ~ 43 fps
100%
Graphics 4-Core:
35.9 [X] Lenovo ThinkBook 14 2-in-1 G4 IML 959964
Intel Core Ultra 5 125U 3.6GHz
Graphics 4-Core
min:
30 fps, P1:
30 fps, max:
44 fps
39.7 40.5 42 ~ 40 fps
100%
Graphics 4-Core:
29.5 fps
169%
Arc 8-Core:
36.8 40.9 46.7 51.1 53.3 53.7 55 [X] Acemagic F2A 959964
Intel Core Ultra 7 155H 3.8GHz
Arc 8-Core
min:
47 fps, P1:
45 fps, max:
63 fps
55.1 55.9 [X] Minisforum AtomMan X7 Ti 959964
Intel Core Ultra 9 185H 3.8GHz
Arc 8-Core
min:
48 fps, P1:
46 fps, max:
67 fps
56.2 ~ 50 fps
100%
Graphics 4-Core:
7.6 fps
171%
Arc 8-Core:
5.1 9.3 11.9 14 [X] Minisforum AtomMan X7 Ti 959964
Intel Core Ultra 9 185H 3.8GHz
Arc 8-Core
min:
10 fps, P1:
10 fps, max:
17 fps
14.1 14.4 14.7 14.9 [X] Acemagic F2A 959964
Intel Core Ultra 7 155H 3.8GHz
Arc 8-Core
min:
11 fps, P1:
11 fps, max:
18 fps
15 15.3 ~ 13 fps
100%
Graphics 4-Core:
27.2 [X] Lenovo ThinkBook 14 2-in-1 G4 IML Intel Core Ultra 5 125U 3.6GHz
Graphics 4-Core
29.9 30.8 ~ 29 fps
100%
Graphics 4-Core:
21.1 [X] Lenovo ThinkBook 14 2-in-1 G4 IML Intel Core Ultra 5 125U 3.6GHz
Graphics 4-Core
24 24.2 ~ 23 fps
100%
Graphics 4-Core:
14.1 [X] Lenovo ThinkBook 14 2-in-1 G4 IML Intel Core Ultra 5 125U 3.6GHz
Graphics 4-Core
16.1 16.3 ~ 16 fps
100%
Graphics 4-Core:
11.3 [X] Lenovo ThinkBook 14 2-in-1 G4 IML Intel Core Ultra 5 125U 3.6GHz
Graphics 4-Core
12.7 13.8 ~ 13 fps
Arc 8-Core:
67.7 [X] Acemagic F2A 800660
Intel Core Ultra 7 155H 3.8GHz
Arc 8-Core
min:
33.1 fps, max:
113.8 fps
73 [X] Minisforum AtomMan X7 Ti 800660
Intel Core Ultra 9 185H 3.8GHz
Arc 8-Core
min:
46.1 fps, max:
181.8 fps
~ 70 fps
Arc 8-Core:
51.8 [X] Acemagic F2A 800660
Intel Core Ultra 7 155H 3.8GHz
Arc 8-Core
min:
31.2 fps, max:
99 fps
56.8 [X] Minisforum AtomMan X7 Ti 800660
Intel Core Ultra 9 185H 3.8GHz
Arc 8-Core
min:
34.5 fps, max:
151.8 fps
~ 54 fps
Arc 8-Core:
41.7 [X] Acemagic F2A 800660
Intel Core Ultra 7 155H 3.8GHz
Arc 8-Core
min:
24 fps, max:
88.6 fps
44.8 [X] Minisforum AtomMan X7 Ti 800660
Intel Core Ultra 9 185H 3.8GHz
Arc 8-Core
min:
29.3 fps, max:
72.2 fps
~ 43 fps
Arc 8-Core:
36.6 [X] Acemagic F2A 800660
Intel Core Ultra 7 155H 3.8GHz
Arc 8-Core
min:
19.9 fps, max:
58.1 fps
39.2 [X] Minisforum AtomMan X7 Ti 800660
Intel Core Ultra 9 185H 3.8GHz
Arc 8-Core
min:
26.1 fps, max:
65.2 fps
~ 38 fps
Arc 8-Core:
27 [X] Acemagic F2A Intel Core Ultra 7 155H 3.8GHz
Arc 8-Core
min:
22.1 fps, P0.1:
22.3 fps, P1:
23.6 fps, max:
36.5 fps
33.7 [X] Minisforum AtomMan X7 Ti Intel Core Ultra 9 185H 3.8GHz
Arc 8-Core
min:
23.2 fps, P0.1:
23.7 fps, P1:
24.4 fps, max:
49.1 fps
~ 30 fps
Arc 8-Core:
24 [X] Acemagic F2A Intel Core Ultra 7 155H 3.8GHz
Arc 8-Core
min:
20.6 fps, P0.1:
20.7 fps, P1:
21.5 fps, max:
27.6 fps
31.2 [X] Minisforum AtomMan X7 Ti Intel Core Ultra 9 185H 3.8GHz
Arc 8-Core
min:
27.5 fps, P0.1:
27.7 fps, P1:
28.1 fps, max:
38.6 fps
~ 28 fps
Arc 8-Core:
18.3 [X] Acemagic F2A Intel Core Ultra 7 155H 3.8GHz
Arc 8-Core
min:
10.5 fps, P0.1:
11 fps, P1:
15.2 fps, max:
28.6 fps
24 [X] Minisforum AtomMan X7 Ti Intel Core Ultra 9 185H 3.8GHz
Arc 8-Core
min:
15 fps, P0.1:
15.3 fps, P1:
17.9 fps, max:
36.8 fps
~ 21 fps
Arc 8-Core:
12.9 [X] Acemagic F2A Intel Core Ultra 7 155H 3.8GHz
Arc 8-Core
min:
9.37 fps, P0.1:
9.72 fps, P1:
11 fps, max:
17.4 fps
17.3 [X] Minisforum AtomMan X7 Ti Intel Core Ultra 9 185H 3.8GHz
Arc 8-Core
min:
8.26 fps, P0.1:
8.27 fps, P1:
8.97 fps, max:
153.3 fps
~ 15 fps
Arc 8-Core:
61.9 [X] Acemagic F2A Intel Core Ultra 7 155H 3.8GHz
Arc 8-Core
min:
52 fps, max:
68 fps
fps
Arc 8-Core:
37.7 [X] Acemagic F2A Intel Core Ultra 7 155H 3.8GHz
Arc 8-Core
min:
35 fps, max:
41 fps
fps
Arc 8-Core:
32.1 [X] Acemagic F2A Intel Core Ultra 7 155H 3.8GHz
Arc 8-Core
min:
29 fps, max:
34 fps
fps
Arc 8-Core:
27.2 [X] Acemagic F2A Intel Core Ultra 7 155H 3.8GHz
Arc 8-Core
min:
21 fps, max:
30 fps
fps
Arc 8-Core:
94.8 143.5 143.6 145.9 [X] Acemagic F2A 874931
Intel Core Ultra 7 155H 3.8GHz
Arc 8-Core
min:
119 fps, P1:
118 fps, max:
174 fps
147.5 161.1 [X] Minisforum AtomMan X7 Ti 874931
Intel Core Ultra 9 185H 3.8GHz
Arc 8-Core
min:
132 fps, P1:
130 fps, max:
182 fps
~ 139 fps
Arc 8-Core:
50.8 73.9 75.9 80.4 [X] Acemagic F2A 874931
Intel Core Ultra 7 155H 3.8GHz
Arc 8-Core
min:
66 fps, P1:
64 fps, max:
92 fps
80.6 83.5 [X] Minisforum AtomMan X7 Ti 874931
Intel Core Ultra 9 185H 3.8GHz
Arc 8-Core
min:
61 fps, P1:
67 fps, max:
94 fps
~ 74 fps
Arc 8-Core:
41.3 56.4 60 63.2 [X] Acemagic F2A 874931
Intel Core Ultra 7 155H 3.8GHz
Arc 8-Core
min:
55 fps, P1:
49 fps, max:
72 fps
63.8 65.3 [X] Minisforum AtomMan X7 Ti 874931
Intel Core Ultra 9 185H 3.8GHz
Arc 8-Core
min:
56 fps, P1:
52 fps, max:
73 fps
~ 58 fps
Arc 8-Core:
20.3 26.2 26.9 28.8 [X] Acemagic F2A 874931
Intel Core Ultra 7 155H 3.8GHz
Arc 8-Core
min:
22 fps, P1:
22 fps, max:
33 fps
29.6 [X] Minisforum AtomMan X7 Ti 874931
Intel Core Ultra 9 185H 3.8GHz
Arc 8-Core
min:
23 fps, P1:
22 fps, max:
33 fps
31 ~ 27 fps
Arc 8-Core:
58 [X] Acemagic F2A Intel Core Ultra 7 155H 3.8GHz
Arc 8-Core
min:
43 fps, max:
83 fps
fps
Arc 8-Core:
33 35 [X] Acemagic F2A Intel Core Ultra 7 155H 3.8GHz
Arc 8-Core
min:
25 fps, max:
47 fps
~ 34 fps
Arc 8-Core:
28 (!) [X] Acer Swift Go 14 SFG14-72 Intel Core Ultra 7 155H 3.8GHz
Arc 8-Core
30 [X] Acemagic F2A Intel Core Ultra 7 155H 3.8GHz
Arc 8-Core
min:
5 fps, max:
44 fps
~ 29 fps
Arc 8-Core:
26 27 [X] Acemagic F2A Intel Core Ultra 7 155H 3.8GHz
Arc 8-Core
min:
8 fps, max:
36 fps
~ 27 fps
Arc 8-Core:
139.1 [X] Minisforum AtomMan X7 Ti 759689
Intel Core Ultra 9 185H 3.8GHz
Arc 8-Core
min:
126 fps, max:
155 fps
fps
Arc 8-Core:
76.9 [X] Minisforum AtomMan X7 Ti 759689
Intel Core Ultra 9 185H 3.8GHz
Arc 8-Core
min:
64 fps, max:
88 fps
fps
Arc 8-Core:
60.5 [X] Minisforum AtomMan X7 Ti 759689
Intel Core Ultra 9 185H 3.8GHz
Arc 8-Core
min:
51 fps, max:
68 fps
fps
Arc 8-Core:
41.2 [X] Minisforum AtomMan X7 Ti 759689
Intel Core Ultra 9 185H 3.8GHz
Arc 8-Core
min:
32 fps, max:
51 fps
fps
Arc 8-Core:
68.5 93 [X] Minisforum AtomMan X7 Ti Intel Core Ultra 9 185H 3.8GHz
Arc 8-Core
~ 81 fps
Arc 8-Core:
38.5 41.9 [X] Minisforum AtomMan X7 Ti Intel Core Ultra 9 185H 3.8GHz
Arc 8-Core
~ 40 fps
Arc 8-Core:
27.7 28.7 [X] Minisforum AtomMan X7 Ti Intel Core Ultra 9 185H 3.8GHz
Arc 8-Core
~ 28 fps
Arc 8-Core:
21.9 [X] Minisforum AtomMan X7 Ti Intel Core Ultra 9 185H 3.8GHz
Arc 8-Core
22.6 ~ 22 fps
Arc 8-Core:
65 [X] Acemagic F2A Intel Core Ultra 7 155H 3.8GHz
Arc 8-Core
min:
11 fps, max:
82 fps
69 [X] Minisforum AtomMan X7 Ti Intel Core Ultra 9 185H 3.8GHz
Arc 8-Core
min:
2 fps, max:
88 fps
~ 67 fps
Arc 8-Core:
39 [X] Acemagic F2A Intel Core Ultra 7 155H 3.8GHz
Arc 8-Core
min:
26 fps, max:
47 fps
41 [X] Minisforum AtomMan X7 Ti Intel Core Ultra 9 185H 3.8GHz
Arc 8-Core
min:
21 fps, max:
49 fps
~ 40 fps
Arc 8-Core:
37 [X] Acemagic F2A Intel Core Ultra 7 155H 3.8GHz
Arc 8-Core
min:
25 fps, max:
44 fps
39 [X] Minisforum AtomMan X7 Ti Intel Core Ultra 9 185H 3.8GHz
Arc 8-Core
min:
25 fps, max:
47 fps
~ 38 fps
Arc 8-Core:
35 [X] Acemagic F2A Intel Core Ultra 7 155H 3.8GHz
Arc 8-Core
min:
28 fps, max:
42 fps
36 [X] Minisforum AtomMan X7 Ti Intel Core Ultra 9 185H 3.8GHz
Arc 8-Core
min:
29 fps, max:
44 fps
~ 36 fps
Arc 8-Core:
52.2 [X] Acemagic F2A Intel Core Ultra 7 155H 3.8GHz
Arc 8-Core
min:
27.79 fps, max:
85.54 fps
63.1 [X] Minisforum AtomMan X7 Ti Intel Core Ultra 9 185H 3.8GHz
Arc 8-Core
min:
35.58 fps, max:
104.34 fps
~ 58 fps
Arc 8-Core:
33.9 [X] Acemagic F2A Intel Core Ultra 7 155H 3.8GHz
Arc 8-Core
min:
19.97 fps, max:
51.8 fps
37.6 [X] Minisforum AtomMan X7 Ti Intel Core Ultra 9 185H 3.8GHz
Arc 8-Core
min:
22.07 fps, max:
56.85 fps
~ 36 fps
Arc 8-Core:
25 [X] Acemagic F2A Intel Core Ultra 7 155H 3.8GHz
Arc 8-Core
min:
14.2 fps, max:
40.08 fps
27.1 [X] Minisforum AtomMan X7 Ti Intel Core Ultra 9 185H 3.8GHz
Arc 8-Core
min:
15.7 fps, max:
40.94 fps
~ 26 fps
Arc 8-Core:
19.7 [X] Acemagic F2A Intel Core Ultra 7 155H 3.8GHz
Arc 8-Core
min:
11.97 fps, max:
28.47 fps
21.7 [X] Minisforum AtomMan X7 Ti Intel Core Ultra 9 185H 3.8GHz
Arc 8-Core
min:
12.33 fps, max:
31.71 fps
~ 21 fps
Arc 8-Core:
79.3 [X] Minisforum AtomMan X7 Ti Intel Core Ultra 9 185H 3.8GHz
Arc 8-Core
131.4 ~ 105 fps
Arc 8-Core:
38.3 [X] Minisforum AtomMan X7 Ti Intel Core Ultra 9 185H 3.8GHz
Arc 8-Core
62.5 ~ 50 fps
Arc 8-Core:
35.8 [X] Minisforum AtomMan X7 Ti Intel Core Ultra 9 185H 3.8GHz
Arc 8-Core
49.5 ~ 43 fps
Arc 8-Core:
30.5 [X] Minisforum AtomMan X7 Ti Intel Core Ultra 9 185H 3.8GHz
Arc 8-Core
48.2 ~ 39 fps
100%
Graphics 4-Core:
73.7 [X] Lenovo ThinkBook 14 2-in-1 G4 IML 1.47.22.14 D3D12
Intel Core Ultra 5 125U 3.6GHz
Graphics 4-Core
min:
14.9 fps, P1:
59.5 fps, max:
308 fps
118.1 120.4 121.1 ~ 108 fps
100%
Graphics 4-Core:
32.9 [X] Lenovo ThinkBook 14 2-in-1 G4 IML 1.47.22.14 D3D12
Intel Core Ultra 5 125U 3.6GHz
Graphics 4-Core
min:
11.4 fps, P1:
27.8 fps, max:
220 fps
50 50.8 52.1 ~ 46 fps
150%
Arc 8-Core:
52.7 53 56 57 [X] AcePC Wizbox AI 1.47.22.14 D3D12
Intel Core Ultra 7 155H 3.8GHz
Arc 8-Core
min:
8.9 fps, P1:
48.8 fps, max:
233 fps
60.6 61.9 [X] Acemagic F2A 1.47.22.14 D3D12
Intel Core Ultra 7 155H 3.8GHz
Arc 8-Core
min:
7.4 fps, P1:
53.4 fps, max:
241 fps
66 67.6 67.8 [X] Minisforum AtomMan X7 Ti 1.47.22.14 D3D12
Intel Core Ultra 9 185H 3.8GHz
Arc 8-Core
min:
51.1 fps, P1:
59.2 fps, max:
87.3 fps
68 70 70.5 71 71.1 72 73.4 75.4 80.3 84 87.7 88 ~ 69 fps
100%
Graphics 4-Core:
26.6 [X] Lenovo ThinkBook 14 2-in-1 G4 IML 1.47.22.14 D3D12
Intel Core Ultra 5 125U 3.6GHz
Graphics 4-Core
min:
8.2 fps, P1:
11.3 fps, max:
237 fps
37.7 39.2 41.9 ~ 36 fps
158%
Arc 8-Core:
39 41 41.4 50.4 [X] AcePC Wizbox AI 1.47.22.14 D3D12
Intel Core Ultra 7 155H 3.8GHz
Arc 8-Core
min:
24.4 fps, P1:
40.8 fps, max:
260 fps
52 52.4 53.3 [X] Acemagic F2A 1.47.22.14 D3D12
Intel Core Ultra 7 155H 3.8GHz
Arc 8-Core
min:
25.6 fps, P1:
41.4 fps, max:
283 fps
54 56.4 57.2 [X] Minisforum AtomMan X7 Ti 1.47.22.14 D3D12
Intel Core Ultra 9 185H 3.8GHz
Arc 8-Core
min:
43.9 fps, P1:
47 fps, max:
80.7 fps
57.8 57.8 58.9 59 59 59.7 61.4 64 66.7 72.3 74 ~ 57 fps
100%
Graphics 4-Core:
22.9 [X] Lenovo ThinkBook 14 2-in-1 G4 IML 1.47.22.14 D3D12
Intel Core Ultra 5 125U 3.6GHz
Graphics 4-Core
min:
7.3 fps, P1:
9.15 fps, max:
242 fps
30.2 30.3 33.3 ~ 29 fps
152%
Arc 8-Core:
27.1 31 32 35 38.8 38.9 [X] Asus ROG Zephyrus G16 2024 GU605M 1.47.22.14 D3D12
Intel Core Ultra 7 155H 3.8GHz
Arc 8-Core
min:
5 fps, P1:
7.15 fps, max:
306 fps
41 [X] AcePC Wizbox AI 1.47.22.14 D3D12
Intel Core Ultra 7 155H 3.8GHz
Arc 8-Core
min:
6.8 fps, P1:
14.4 fps, max:
316 fps
41 43.2 43.8 [X] Acemagic F2A 1.47.22.14 D3D12
Intel Core Ultra 7 155H 3.8GHz
Arc 8-Core
min:
23.2 fps, P1:
25.6 fps, max:
189.3 fps
44 44.3 46.1 46.7 [X] Minisforum AtomMan X7 Ti 1.47.22.14 D3D12
Intel Core Ultra 9 185H 3.8GHz
Arc 8-Core
min:
6.9 fps, P1:
17.1 fps, max:
347 fps
46.8 47 47 50.3 52.5 53 55 58.9 ~ 44 fps
100%
Graphics 4-Core:
38 [X] Lenovo ThinkBook 14 2-in-1 G4 IML Intel Core Ultra 5 125U 3.6GHz
Graphics 4-Core
min:
21 fps, max:
46 fps
46 47 48 ~ 45 fps
100%
Graphics 4-Core:
20 [X] Lenovo ThinkBook 14 2-in-1 G4 IML Intel Core Ultra 5 125U 3.6GHz
Graphics 4-Core
min:
12 fps, max:
24 fps
24 25 25 ~ 24 fps
100%
Graphics 4-Core:
19 [X] Lenovo ThinkBook 14 2-in-1 G4 IML Intel Core Ultra 5 125U 3.6GHz
Graphics 4-Core
min:
17 fps, max:
22 fps
23 24 25 ~ 23 fps
100%
Graphics 4-Core:
18 [X] Lenovo ThinkBook 14 2-in-1 G4 IML Intel Core Ultra 5 125U 3.6GHz
Graphics 4-Core
min:
16 fps, max:
21 fps
21 22 23 ~ 21 fps
Arc 8-Core:
32 33 ~ 33 fps
100%
Graphics 4-Core:
34.7 36.5 36.8 [X] Lenovo ThinkBook 14 2-in-1 G4 IML Intel Core Ultra 5 125U 3.6GHz
Graphics 4-Core
37.6 ~ 36 fps
100%
Graphics 4-Core:
28 28.2 [X] Lenovo ThinkBook 14 2-in-1 G4 IML Intel Core Ultra 5 125U 3.6GHz
Graphics 4-Core
28.3 30.1 ~ 29 fps
100%
Graphics 4-Core:
23.4 23.4 [X] Lenovo ThinkBook 14 2-in-1 G4 IML Intel Core Ultra 5 125U 3.6GHz
Graphics 4-Core
23.6 25.3 ~ 24 fps
100%
Graphics 4-Core:
35.4 [X] Lenovo ThinkBook 14 2-in-1 G4 IML 1.3
Intel Core Ultra 5 125U 3.6GHz
Graphics 4-Core
37.4 37.6 48.2 ~ 40 fps
100%
Graphics 4-Core:
19.5 [X] Lenovo ThinkBook 14 2-in-1 G4 IML 1.3
Intel Core Ultra 5 125U 3.6GHz
Graphics 4-Core
23 23.4 25.9 ~ 23 fps
100%
Graphics 4-Core:
15.7 [X] Lenovo ThinkBook 14 2-in-1 G4 IML 1.3
Intel Core Ultra 5 125U 3.6GHz
Graphics 4-Core
16.3 16.3 18.2 ~ 17 fps
100%
Graphics 4-Core:
82.6 91.4 93.8 [X] Lenovo ThinkBook 14 2-in-1 G4 IML Intel Core Ultra 5 125U 3.6GHz
Graphics 4-Core
min:
63.9 fps, max:
-1 fps
101.9 ~ 92 fps
100%
Graphics 4-Core:
52.2 [X] Lenovo ThinkBook 14 2-in-1 G4 IML Intel Core Ultra 5 125U 3.6GHz
Graphics 4-Core
min:
37 fps, max:
-1 fps
59.7 60.7 69 ~ 60 fps
143%
Arc 8-Core:
55.8 69.4 71.4 75.6 75.9 79.2 80.6 [X] Minisforum AtomMan X7 Ti Intel Core Ultra 9 185H 3.8GHz
Arc 8-Core
min:
59.3 fps, max:
-1 fps
83 [X] Acemagic F2A Intel Core Ultra 7 155H 3.8GHz
Arc 8-Core
min:
57.1 fps, max:
-1 fps
84.3 89.4 89.8 90.4 90.9 92.6 [X] AcePC Wizbox AI Intel Core Ultra 7 155H 3.8GHz
Arc 8-Core
min:
61.2 fps, max:
-1 fps
92.8 92.9 94.1 [X] MSI Engineering Sample Intel Core Ultra 7 165H 3.8GHz
Arc 8-Core
min:
52 fps, max:
-1 fps
94.1 [X] Asus ROG Zephyrus G16 2024 GU605M Intel Core Ultra 7 155H 3.8GHz
Arc 8-Core
min:
47.8 fps, max:
-1 fps
95.3 95.5 96.5 96.9 97.4 ~ 86 fps
100%
Graphics 4-Core:
52.8 [X] Lenovo ThinkBook 14 2-in-1 G4 IML Intel Core Ultra 5 125U 3.6GHz
Graphics 4-Core
min:
41.3 fps, max:
-1 fps
57.2 61 61.1 ~ 58 fps
126%
Arc 8-Core:
39.8 57.7 61.5 64.1 66.8 67.2 69.3 [X] Asus ROG Zephyrus G16 2024 GU605M Intel Core Ultra 7 155H 3.8GHz
Arc 8-Core
min:
49.5 fps, max:
-1 fps
70.3 72 72.3 [X] AcePC Wizbox AI Intel Core Ultra 7 155H 3.8GHz
Arc 8-Core
min:
46.1 fps, max:
-1 fps
74.5 74.9 75.7 76 76.7 76.8 77.3 [X] Acemagic F2A Intel Core Ultra 7 155H 3.8GHz
Arc 8-Core
min:
52.5 fps, max:
-1 fps
79 [X] Minisforum AtomMan X7 Ti Intel Core Ultra 9 185H 3.8GHz
Arc 8-Core
min:
48.2 fps, max:
-1 fps
79.1 83 84.6 [X] MSI Engineering Sample Intel Core Ultra 7 165H 3.8GHz
Arc 8-Core
min:
54 fps, max:
-1 fps
85.2 85.2 ~ 73 fps
100%
Graphics 4-Core:
50 [X] Lenovo ThinkBook 14 2-in-1 G4 IML Intel Core Ultra 5 125U 3.6GHz
Graphics 4-Core
min:
40.1 fps, max:
-1 fps
54.2 57.3 57.6 ~ 55 fps
125%
Arc 8-Core:
43.7 53.3 59.6 60.4 63.6 63.9 65.2 66.5 67.1 [X] Asus ROG Zephyrus G16 2024 GU605M Intel Core Ultra 7 155H 3.8GHz
Arc 8-Core
min:
49.1 fps, max:
-1 fps
68.3 [X] AcePC Wizbox AI Intel Core Ultra 7 155H 3.8GHz
Arc 8-Core
min:
45.5 fps, max:
-1 fps
71.1 71.1 [X] Acemagic F2A Intel Core Ultra 7 155H 3.8GHz
Arc 8-Core
min:
52 fps, max:
-1 fps
72.3 73.4 73.6 74 74.4 74.6 [X] Minisforum AtomMan X7 Ti Intel Core Ultra 9 185H 3.8GHz
Arc 8-Core
min:
47.1 fps, max:
-1 fps
75.4 [X] MSI Engineering Sample Intel Core Ultra 7 165H 3.8GHz
Arc 8-Core
min:
52.5 fps, max:
-1 fps
75.6 79.8 80.2 80.6 ~ 69 fps
100%
Graphics 4-Core:
66.5 [X] Lenovo ThinkBook 14 2-in-1 G4 IML Intel Core Ultra 5 125U 3.6GHz
Graphics 4-Core
min:
56 fps, max:
71 fps
86.8 92.1 92.1 ~ 84 fps
100%
Graphics 4-Core:
41.3 [X] Lenovo ThinkBook 14 2-in-1 G4 IML Intel Core Ultra 5 125U 3.6GHz
Graphics 4-Core
min:
39 fps, max:
44 fps
49.6 57 57 ~ 51 fps
100%
Graphics 4-Core:
21.4 [X] Lenovo ThinkBook 14 2-in-1 G4 IML Intel Core Ultra 5 125U 3.6GHz
Graphics 4-Core
min:
17 fps, max:
24 fps
28.4 32.4 32.4 ~ 29 fps
100%
Graphics 4-Core:
11.9 [X] Lenovo ThinkBook 14 2-in-1 G4 IML Intel Core Ultra 5 125U 3.6GHz
Graphics 4-Core
min:
10 fps, max:
14 fps
15 17.9 17.9 ~ 16 fps
144%
Arc 8-Core:
14.5 18.4 [X] Asus ROG Zephyrus G16 2024 GU605M Intel Core Ultra 7 155H 3.8GHz
Arc 8-Core
19.2 20.1 20.4 20.5 20.8 [X] AcePC Wizbox AI Intel Core Ultra 7 155H 3.8GHz
Arc 8-Core
min:
18 fps, P1:
19 fps, max:
23 fps
20.8 20.9 23 23.1 23.3 23.8 24.5 24.5 [X] Minisforum AtomMan X7 Ti Intel Core Ultra 9 185H 3.8GHz
Arc 8-Core
min:
6.26 fps, P0.1:
10.2 fps, P1:
14.1 fps, max:
108.6 fps
24.6 [X] Acemagic F2A Intel Core Ultra 7 155H 3.8GHz
Arc 8-Core
min:
12 fps, P0.1:
16.1 fps, P1:
21.8 fps, max:
28.1 fps
25.1 25.2 25.5 25.5 26.1 28 ~ 23 fps
Arc 8-Core:
19.1 22.6 24.2 [X] Asus ROG Zephyrus G16 2024 GU605M Intel Core Ultra 7 155H 3.8GHz
Arc 8-Core
min:
3.2 fps, P1:
17.2 fps, max:
99.2 fps
26.2 31.3 [X] Acemagic F2A Intel Core Ultra 7 155H 3.8GHz
Arc 8-Core
min:
2.94 fps, P1:
22.7 fps, max:
181.5 fps
32.2 [X] AcePC Wizbox AI Intel Core Ultra 7 155H 3.8GHz
Arc 8-Core
min:
6.83 fps, P1:
23.3 fps, max:
70.5 fps
32.8 33.1 33.4 33.5 33.9 34.8 35.2 36.2 36.3 36.9 37.6 40.3 41.2 41.2 [X] Minisforum AtomMan X7 Ti Intel Core Ultra 9 185H 3.8GHz
Arc 8-Core
min:
3.12 fps, P1:
30.3 fps, max:
188 fps
41.3 ~ 33 fps
Arc 8-Core:
9.6 10 11 12.1 [X] Asus ROG Zephyrus G16 2024 GU605M Intel Core Ultra 7 155H 3.8GHz
Arc 8-Core
min:
3.95 fps, P1:
8.77 fps, max:
85.8 fps
12.3 [X] AcePC Wizbox AI Intel Core Ultra 7 155H 3.8GHz
Arc 8-Core
min:
3.05 fps, P1:
8.77 fps, max:
48.3 fps
12.7 [X] Acemagic F2A Intel Core Ultra 7 155H 3.8GHz
Arc 8-Core
min:
2.71 fps, P1:
9.35 fps, max:
78.8 fps
13.1 13.3 13.7 13.8 14.1 14.2 14.3 14.3 14.6 14.7 15.9 15.9 16 16.2 [X] Minisforum AtomMan X7 Ti Intel Core Ultra 9 185H 3.8GHz
Arc 8-Core
min:
3.13 fps, P1:
12.8 fps, max:
68.7 fps
16.5 ~ 14 fps
Average Gaming Intel Graphics 4-Cores iGPU (Arc) → 100% Average Gaming 30-70 fps → 100%
Average Gaming Intel Arc 8-Core iGPU → 160% Average Gaming 30-70 fps → 159%
Intel Graphics 4-Cores iGPU (Arc) low med. high ultra QHD 4K Cyberpunk 2077 2.0 Phantom Liberty 20 17 14 12 Baldur's Gate 3 16 13 11 10.6 F1 22 43 40 29.5 7.62 Tiny Tina's Wonderlands 29 23 16 13 Strange Brigade 108 46 36 29 Far Cry 5 45 24 23 21 X-Plane 11.11 36 29 24 Final Fantasy XV Benchmark 40 23 17 Dota 2 Reborn 92 60 58 55 The Witcher 3 84 51 29 16 < 30 fps < 60 fps < 120 fps ≥ 120 fps 3 4 3 6 3 1 8 2 7 1
v1.26
log 17. 05:37:05
#0 checking url part for id 12259 +0s ... 0s
#1 checking url part for id 12086 +0s ... 0s
#2 not redirecting to Ajax server +0s ... 0s
#3 did not recreate cache, as it is less than 5 days old! Created at Thu, 16 May 2024 05:40:59 +0200 +0.001s ... 0.001s
#4 composed specs +0.155s ... 0.156s
#5 did output specs +0s ... 0.156s
#6 start showIntegratedCPUs +0s ... 0.156s
#7 getting avg benchmarks for device 12259 +0.045s ... 0.201s
#8 got single benchmarks 12259 +0.026s ... 0.227s
#9 getting avg benchmarks for device 12086 +0.024s ... 0.251s
#10 got single benchmarks 12086 +0.102s ... 0.353s
#11 got avg benchmarks for devices +0s ... 0.353s
#12 min, max, avg, median took s +0.336s ... 0.689s
#13 before gaming benchmark output +0s ... 0.689s
#14 Got 1166 rows for game benchmarks. +0.355s ... 1.044s
#15 composed SQL query for gamebenchmarks +0s ... 1.044s
#16 got data and put it in $dataArray +0.051s ... 1.095s
#17 benchmarks composed for output. +0.136s ... 1.231s
#18 calculated avg scores. +0s ... 1.231s
#19 return log +0.058s ... 1.289s
Teilen Sie diesen Artikel, um uns zu unterstützen. Jeder Link hilft!
Autor: Klaus Hinum, 8.09.2017 (Update: 1.07.2023)
 Deutsch
 English
 Español
 Français
 Italiano
 Nederlands
 Polski
 Português
 Русский
 Türkçe
 Svenska
 Chinese
 Magyar