AMD Radeon RX 7600M XT
Die AMD Radeon RX 7600M XT ist eine Notebook-GPU der gehobenen Mittelklasse und basiert auf den Navi 33 mit RDNA 3 Architektur. Die RX7600M XT bietet 2.048 Shader (32 CUs), einen 128 Bit Speicherbus für 8 GB GDDR6 und 32 MB Infinity Cache. Der durchschnittliche Takt bei Spielen (Game Clock) wird von AMD mit 2300 MHz spezifiziert.
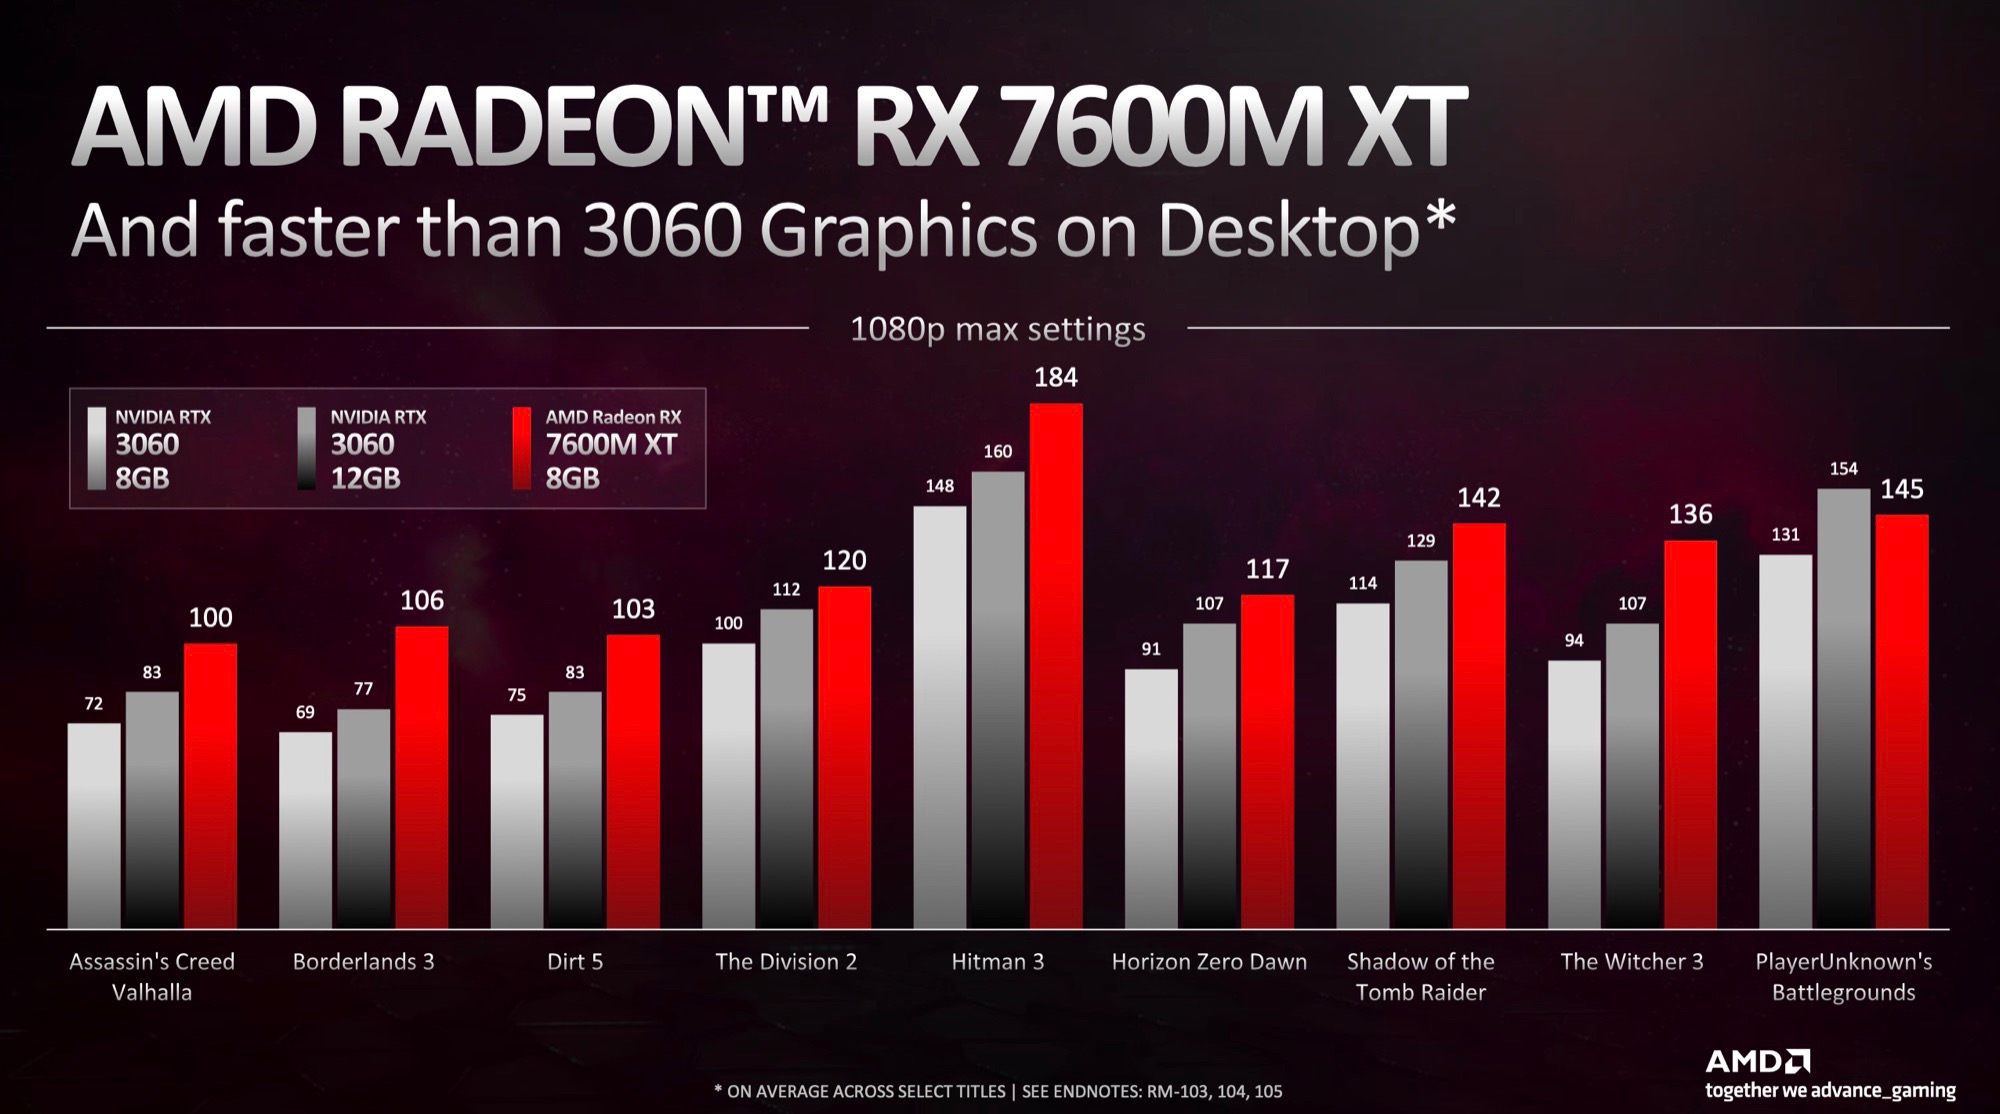
Die Spieleleistung wird von AMD mit einer RTX 3060 für Desktops verglichen und hier soll die mobile RX 7600M XT (wahrscheinlich mit 120 W TGP) sich klar durchsetzen können. Damit sollte sich die GPU gut für QHD (2560x1440) Gaming mit hohen - bis maximalen Details (ohne Raytracing) eigenen. Die Raytracing Performance hat sich mit RDNA 3 zwar deutlich erhöht, kann mit Nvidia jedoch noch nicht mithalten.
Die integrierte Media-Engine unterstützt 4K H.264, H.265/HEVC und AV1 De- und Encoding.
Der Navi 33 Chip wird bei TSMC in 6nm gefertigt. AMD spezifiziert den TGP mit bis zu 75 bis 120 Watt.
Radeon RX 7000M Serie Codename Navi 33 Architektur RDNA 3 Pipelines 2048 - unified ROPs 64 Kerntakt 2300 (Boost) MHz Theoretical Performance 42.8 TFLOPS FP16, 21.4 TFLOPS FP32 Cache L3: 32 MB Speichertakt 18000 MHz Speicherbandbreite 128 Bit Speichertyp GDDR6 Max. Speichergröße 8 GB Shared Memory nein Memory Bandwidth 288 GB/s API DirectX 12, Shader 6.4, OpenGL 4.6 Stromverbrauch 120 Watt (75 - 120 Watt TGP) Transistoren 13.3 Billion Chipgröße 204 mm² Herstellungsprozess 6 nm Notebookgröße groß (17" z.B.) Erscheinungsdatum 05.01.2023 Herstellerseite www.amd.com
Benchmarks Performance Rating - 3DMark 11 + Fire Strike + Time Spy
12.9 pt (39%)
...
max:
3DMark - 3DMark Time Spy Score
min: 9246 avg: 9634 median: 9803 (28%) max: 9857 Points
GPU TDP ? TDP 120 W 97% 100%
...
...
max:
3DMark - 3DMark Time Spy Graphics
min: 8966 avg: 9443 median: 9498 (25%) max: 9936 Points
GPU TDP ? TDP 120 W 97% 100%
...
...
max:
3DMark - 3DMark Ice Storm Unlimited Graphics
min: 252549 avg: 398045 median: 418181 (47%) max: 499224 Points
GPU TDP ? TDP 120 W 78% 100%
...
...
max:
3DMark - 3DMark Ice Storm Extreme Graphics
min: 172864 avg: 321305 median: 354449 (45%) max: 429120 Points
GPU TDP ? TDP 120 W 70% 100%
...
...
max:
3DMark - 3DMark Cloud Gate Score
min: 36706 avg: 51319 median: 52238.5 (56%) max: 64091 Points
GPU TDP ? TDP 120 W 85% 100%
...
...
max:
3DMark - 3DMark Cloud Gate Graphics
min: 136061 avg: 150154 median: 152894 (40%) max: 158768 Points
GPU TDP ? TDP 120 W 98% 100%
...
max:
3DMark - 3DMark Fire Strike Standard Score
min: 22812 avg: 24971 median: 25367 (45%) max: 26330 Points
GPU TDP ? TDP 120 W 92% 100%
...
max:
3DMark - 3DMark Fire Strike Standard Graphics
min: 28078 avg: 28669 median: 28271 (32%) max: 29638 Points
GPU TDP ? TDP 120 W 98% 100%
...
...
max:
3DMark - 3DMark Ice Storm Graphics
min: 177869 avg: 348670 median: 374634 (45%) max: 475947 Points
GPU TDP ? TDP 120 W 70% 100%
...
...
max:
3DMark - 3DMark Night Raid
min: 48750 avg: 57803 median: 60391 (57%) max: 63567 Points
GPU TDP ? TDP 120 W 88% 100%
...
max:
3DMark - 3DMark Night Raid Graphics Score
min: 93268 avg: 103767 median: 100378 (39%) max: 115605 Points
GPU TDP ? TDP 120 W 93% 100%
...
max:
3DMark 11 - 3DM11 Performance Score
min: 17827 avg: 26627 median: 27492 (38%) max: 32487 Points
GPU TDP ? TDP 120 W 81% 100%
...
...
max:
3DMark 11 - 3DM11 Performance GPU
min: 27060 avg: 34842 median: 36365 (31%) max: 39342 Points
GPU TDP ? TDP 120 W 87% 100%
...
...
max:
3DMark Vantage + 3DMark Vantage - 3DM Vant. Perf. total
min: 78640 avg: 91223 median: 93477 (27%) max: 99297 Points
GPU TDP ? TDP 120 W 88% 100%
...
max:
3DM Vant. Perf. GPU no PhysX + 3DMark Vantage - 3DM Vant. Perf. GPU no PhysX
min: 84240 avg: 93680 median: 96219.5 (55%) max: 98042 Points
GPU TDP ? TDP 120 W 92% 100%
...
max:
3DMark 06 3DMark 06 - Standard 1280x1024 +
min: 14066 avg: 29672 median: 22993 (30%) max: 58636 Points
GPU TDP ? TDP 120 W 39% 100%
...
...
max:
Unigine Valley 1.0 - Unigine Valley 1.0 DX
min: 91.6 avg: 95.8 median: 96.5 (32%) max: 98.4 fps
GPU TDP ? TDP 120 W 97% 100%
...
max:
Blender - Blender 3.3 Classroom HIP *
65 Seconds (5%)
...
...
SPECviewperf 12 + SPECviewperf 12 - specvp12 sw-03
min: 175 avg: 203 median: 218 (54%) max: 225 fps
GPU TDP ? TDP 120 W 86% 100%
...
max:
specvp12 snx-02 + SPECviewperf 12 - specvp12 snx-02
min: 160 avg: 178 median: 185 (27%) max: 188 fps
GPU TDP ? TDP 120 W 92% 100%
...
max:
specvp12 showcase-01 + SPECviewperf 12 - specvp12 showcase-01
min: 91.5 avg: 113.5 median: 118 (26%) max: 121 fps
GPU TDP ? TDP 120 W 100% 90%
...
...
max:
specvp12 mediacal-01 + SPECviewperf 12 - specvp12 mediacal-01
min: 99 avg: 110.8 median: 110 (28%) max: 125 fps
GPU TDP ? TDP 120 W 99% 100%
...
max:
specvp12 maya-04 + SPECviewperf 12 - specvp12 maya-04
min: 155 avg: 186.4 median: 195 (53%) max: 214 fps
GPU TDP ? TDP 120 W 88% 100%
...
max:
specvp12 energy-01 + SPECviewperf 12 - specvp12 energy-01
min: 20.4 avg: 26 median: 24.2 (22%) max: 36.1 fps
GPU TDP ? TDP 120 W 100% 92%
...
max:
specvp12 creo-01 + SPECviewperf 12 - specvp12 creo-01
min: 73.1 avg: 83.5 median: 83.7 (33%) max: 90.4 fps
GPU TDP ? TDP 120 W 93% 100%
...
...
max:
specvp12 catia-04 + SPECviewperf 12 - specvp12 catia-04
min: 176 avg: 209.8 median: 225 (37%) max: 235 fps
GPU TDP ? TDP 120 W 85% 100%
...
max:
specvp12 3dsmax-05 + SPECviewperf 12 - specvp12 3dsmax-05
min: 105 avg: 176.6 median: 205 (36%) max: 242 fps
GPU TDP ? TDP 120 W 77% 100%
...
...
max:
SPECviewperf 13 specvp13 sw-04 + SPECviewperf 13 - specvp13 sw-04
min: 176 avg: 195.8 median: 207 (55%) max: 209 fps
GPU TDP ? TDP 120 W 90% 100%
...
max:
specvp13 snx-03 + SPECviewperf 13 - specvp13 snx-03
min: 286 avg: 320.2 median: 335 (37%) max: 338 fps
GPU TDP ? TDP 120 W 92% 100%
...
max:
specvp13 showcase-02 + SPECviewperf 13 - specvp13 showcase-02
min: 91.6 avg: 113.5 median: 118 (26%) max: 121 fps
GPU TDP ? TDP 120 W 100% 90%
...
...
max:
specvp13 medical-02 + SPECviewperf 13 - specvp13 medical-02
min: 163 avg: 181 median: 190 (40%) max: 195 fps
GPU TDP ? TDP 120 W 90% 100%
...
max:
specvp13 maya-05 + SPECviewperf 13 - specvp13 maya-05
min: 255 avg: 297.4 median: 318 (36%) max: 323 fps
GPU TDP ? TDP 120 W 88% 100%
...
max:
specvp13 energy-02 + SPECviewperf 13 - specvp13 energy-02
min: 70.4 avg: 71.6 median: 71.6 (23%) max: 73.4 fps
GPU TDP ? TDP 120 W 97% 100%
...
specvp13 creo-02 + SPECviewperf 13 - specvp13 creo-02
min: 175 avg: 223.6 median: 238 (35%) max: 263 fps
GPU TDP ? TDP 120 W 82% 100%
...
...
max:
specvp13 catia-05 + SPECviewperf 13 - specvp13 catia-05
min: 273 avg: 319.2 median: 341 (38%) max: 354 fps
GPU TDP ? TDP 120 W 86% 100%
...
max:
specvp13 3dsmax-06 + SPECviewperf 13 - specvp13 3dsmax-06
min: 104 avg: 177 median: 205 (36%) max: 241 fps
GPU TDP ? TDP 120 W 76% 100%
...
...
max:
SPECviewperf 2020 specvp2020 solidworks-05 4k + SPECviewperf 2020 - specvp2020 solidworks-05 4k
min: 43.7 avg: 85 median: 98.4 (29%) max: 99.5 fps
GPU TDP ? TDP 120 W 81% 100%
...
...
max:
specvp2020 snx-04 4k + SPECviewperf 2020 - specvp2020 snx-04 4k
min: 67 avg: 182.8 median: 212 (22%) max: 216 fps
GPU TDP ? TDP 120 W 76% 100%
...
max:
specvp2020 medical-03 4k + SPECviewperf 2020 - specvp2020 medical-03 4k
min: 17.9 avg: 25.3 median: 27 (26%) max: 29.9 fps
GPU TDP ? TDP 120 W 90% 100%
...
max:
specvp2020 maya-06 4k + SPECviewperf 2020 - specvp2020 maya-06 4k
min: 60.1 avg: 134.6 median: 154 (25%) max: 165 fps
GPU TDP ? TDP 120 W 74% 100%
...
...
max:
specvp2020 energy-03 4k + SPECviewperf 2020 - specvp2020 energy-03 4k
min: 24.7 avg: 55.2 median: 36.7 (8%) max: 90.5 fps
GPU TDP ? TDP 120 W 78% 100%
...
max:
specvp2020 creo-03 4k + SPECviewperf 2020 - specvp2020 creo-03 4k
min: 34.3 avg: 69.7 median: 80.3 (38%) max: 89.7 fps
GPU TDP ? TDP 120 W 72% 100%
...
...
max:
specvp2020 catia-06 4k + SPECviewperf 2020 - specvp2020 catia-06 4k
min: 34.9 avg: 55.6 median: 60.4 (39%) max: 63.1 fps
GPU TDP ? TDP 120 W 84% 100%
...
...
max:
specvp2020 3dsmax-07 4k + SPECviewperf 2020 - specvp2020 3dsmax-07 4k
min: 25.3 avg: 46.5 median: 54.5 (23%) max: 60.2 fps
GPU TDP ? TDP 120 W 69% 100%
...
...
max:
Basemark GPU 1.2 - Basemark GPU 1.2 Vulkan Official Medium Offscreen 1080
min: 104.6 avg: 364.4 median: 104.6 (1%) max: 971 fps
GPU TDP ? TDP 120 W TDP 130 W 29% 100% 11%
...
...
max:
Basemark GPU 1.2 - Basemark GPU 1.2 Vulkan Official High Offscreen 2160
min: 3.64 avg: 34 median: 3.6 (1%) max: 84.2 fps
GPU TDP ? TDP 120 W 25% 100%
...
Geekbench 6.2 - Geekbench 6.2 GPU OpenCL
min: 68792 avg: 71273 median: 71630 (21%) max: 73397 Punkte
GPU TDP ? TDP 120 W 96% 100%
...
...
max:
Geekbench 6.2 - Geekbench 6.2 GPU Vulkan
min: 78667 avg: 82644 median: 83067 (27%) max: 86198 Punkte
GPU TDP ? TDP 120 W 94% 100%
...
max:
LuxMark v2.0 64Bit - LuxMark v2.0 Room GPU
min: 1892 avg: 2460 median: 2759 (12%) max: 2784 Samples/s
GPU TDP ? TDP 120 W 100% 98%
...
...
max:
LuxMark v2.0 64Bit - LuxMark v2.0 Sala GPU
min: 4244 avg: 5671 median: 6255 (11%) max: 6489 Samples/s
GPU TDP ? TDP 120 W 100% 100%
...
...
max:
ComputeMark v2.1 - ComputeMark v2.1 Result
min: 20386 avg: 21138 median: 21247 (23%) max: 21578 Punkte
GPU TDP ? TDP 120 W 98% 100%
...
...
max:
Power Consumption - Furmark Stress Test Power Consumption - external Monitor *
min: 134.7 avg: 189.9 median: 189.9 (27%) max: 245 Watt
GPU TDP ? TDP 120 W 124% 100%
...
max:
0 15 30 45 60 75 90 105 120 135 150 165 180 195 210 225 240 255 Tooltip GPD G1 Radeon RX 7600M XT (OCuLink @PCIe x4 4.0): Ø134.7 (126.2-136.2)
GPD G1 Radeon RX 7600M XT (OCuLink @PCIe x4 3.0): Ø245 (234-256)
Power Consumption - The Witcher 3 Power Consumption - external Monitor *
min: 135.6 avg: 198.3 median: 198.3 (28%) max: 261 Watt
GPU TDP ? TDP 120 W 128% 100%
...
...
max:
0 15 30 45 60 75 90 105 120 135 150 165 180 195 210 225 240 255 270 Tooltip GPD G1 Radeon RX 7600M XT (OCuLink @PCIe x4 4.0): Ø135.6 (132.6-136.4)
GPD G1 Radeon RX 7600M XT (OCuLink @PCIe x4 3.0): Ø261 (249-271)
Power Consumption - Witcher 3 ultra Power Efficiency - external Monitor
min: 0.3839 avg: 0.6 median: 0.6 (49%) max: 0.791 fps per Watt
GPU TDP ? TDP 120 W 100% 49%
...
...
Emissions Witcher 3 Fan Noise + Emissions - Witcher 3 Fan Noise
57.5 dB(A) (92%)
Modell CPU GPU RAM Wert GPD G1 Radeon RX 7600M XT (OCuLink @PCIe x4 4.0) R7 7840HS 65 W / 65 W Radeon RX 7600M XT 2469 / 2250 MHz 8 GB 32 GB 57.5
...
- Bereich der Benchmarkergebnisse für diese Grafikkarte
- Durchschnittliche Benchmarkergebnisse für diese Grafikkarte
* Smaller numbers mean a higher performance
Spiele-Benchmarks Die folgenden Benchmarks basieren auf unseren Spieletests mit Testnotebooks. Die Performance dieser Grafikkarte bei den gelisteten Spielen ist abhängig von der verwendeten CPU, Speicherausstattung, Treiber und auch Betriebssystem. Dadurch müssen die untenstehenden Werte nicht repräsentativ sein. Detaillierte Informationen über das verwendete System sehen Sie nach einem Klick auf den fps-Wert.
0 Tooltip Sirius 16 Gen 1: Ø56.4 (47.7-70.3)
...
max:
0 Tooltip Sirius 16 Gen 1: Ø49.1 (32.5-68.8)
...
max:
0 Tooltip Sirius 16 Gen 1: Ø38.7 (35.2-42.9)
...
max:
» In Detailstufe max. mit allen getesteten Notebooks spielbar
0 100 Tooltip Sirius 16 Gen 1: Ø147.5 (102.2-182.2)
...
...
max:
0 100 Tooltip Sirius 16 Gen 1: Ø115.3 (86.1-138.1)
...
max:
0 Tooltip Sirius 16 Gen 1: Ø69.2 (51.8-83.4)
...
max:
» In Detailstufe max. mit allen getesteten Notebooks spielbar
Additional Benchmarks
Epic Preset + Epic RTX Global Illumination 1920x1080
102 [X] Tuxedo Sirius 16 Gen 1 AMD Ryzen 7 7840HS 3.8GHz
Radeon RX 7600M XT
min:
53 fps, P1:
73.8 fps, max:
134.4 fps
...
max:
...
max:
...
max:
...
max:
max:
max:
» In Detailstufe hoch mit allen getesteten Notebooks spielbar
Additional Benchmarks
Low Preset TAA 1280x720
62 [X] Aoostar GOD77 (GPD G1 Radeon RX 7600M XT @USB4) AMD Ryzen 7 7735HS 3.2GHz
Radeon RX 7600M XT
min:
15 fps, max:
82 fps
...
max:
...
max:
...
max:
max:
max:
max:
» In Detailstufe max. mit allen getesteten Notebooks spielbar
Additional Benchmarks
Minimum Preset 1280x720
302 [X] AMD Ryzen 9 7950X 4.5GHz
Radeon RX 7600M XT
0 100 200 300 400 500 600 700 800 900 1000 Tooltip
...
max:
0 100 200 300 400 500 600 700 800 900 1000 1100 1200 1300 1400 1500 1600 1700 1800 1900 2000 2100 2200 2300 2400 2500 2600 2700 2800 2900 3000 3100 3200 3300 3400 3500 3600 3700 3800 3900 4000 4100 4200 4300 4400 4500 4600 4700 4800 4900 5000 5100 5200 5300 5400 5500 5600 5700 5800 5900 6000 6100 6200 6300 6400 6500 6600 6700 6800 6900 7000 7100 Tooltip
...
max:
...
max:
0 100 200 300 400 500 600 700 Tooltip
...
max:
max:
max:
» In Detailstufe max. mit allen getesteten Notebooks spielbar
Additional Benchmarks
Ultra Low Preset LowAA 1280x720
309 [X] AMD Ryzen 9 7950X 4.5GHz
Radeon RX 7600M XT
min:
6.37 fps, P0.1:
28.8 fps, P1:
185.7 fps, max:
488 fps
...
max:
...
max:
...
max:
max:
...
max:
» In Detailstufe hoch mit allen getesteten Notebooks spielbar
Additional Benchmarks
Low Preset 1280x720
96.6 [X] AMD Ryzen 9 7950X 4.5GHz
Radeon RX 7600M XT
min:
25 fps, P0.1:
31.8 fps, P1:
57.9 fps, max:
121.5 fps
...
max:
...
max:
0 100 Tooltip : Ø51.5 (42.218-111)
Sirius 16 Gen 1: Ø60.5 (42.1-78.7)
...
...
max:
0 100 Tooltip : Ø39.8 (29.089-153.6)
Sirius 16 Gen 1: Ø44.5 (38.7-57.6)
...
max:
0 100 200 300 Tooltip : Ø36.6 (19.133-351)
Sirius 16 Gen 1: Ø31.2 (19.2-53.5)
max:
...
max:
» In Detailstufe max. mit den meisten getesteten Laptops spielbar
Additional Benchmarks
Low Preset 1280x720
129.6 [X] AMD Ryzen 9 7950X 4.5GHz
Radeon RX 7600M XT
min:
22.6 fps, P0.1:
79.8 fps, P1:
95.9 fps, max:
251 fps
...
max:
...
...
max:
...
max:
...
...
max:
...
max:
max:
» In Detailstufe max. mit allen getesteten Notebooks spielbar
Additional Benchmarks
Low Preset 1280x720
558.3 [X] AMD Ryzen 9 7950X 4.5GHz
Radeon RX 7600M XT
222.6 [X] Aoostar GOD77 (GPD G1 Radeon RX 7600M XT @USB4) AMD Ryzen 7 7735HS 3.2GHz
Radeon RX 7600M XT
72 [X] Aoostar GOD77 (GPD G1 Radeon RX 7600M XT @USB4) AMD Ryzen 7 7735HS 3.2GHz
Radeon RX 7600M XT
min:
31 fps, max:
90 fps
139 [X] AMD Ryzen 9 7950X 4.5GHz
Radeon RX 7600M XT
min:
72 fps, P0.1:
85 fps, P1:
114 fps, max:
218 fps
~ 106 fps
+ Vergleich
- Vergleich einklappen
...
max:
66 [X] Aoostar GOD77 (GPD G1 Radeon RX 7600M XT @USB4) AMD Ryzen 7 7735HS 3.2GHz
Radeon RX 7600M XT
min:
24 fps, max:
188 fps
124 [X] AMD Ryzen 9 7950X 4.5GHz
Radeon RX 7600M XT
min:
4 fps, P0.1:
55 fps, P1:
85 fps, max:
249 fps
~ 95 fps
+ Vergleich
- Vergleich einklappen
...
...
max:
62 [X] Aoostar GOD77 (GPD G1 Radeon RX 7600M XT @USB4) AMD Ryzen 7 7735HS 3.2GHz
Radeon RX 7600M XT
min:
18 fps, max:
162 fps
110 [X] AMD Ryzen 9 7950X 4.5GHz
Radeon RX 7600M XT
min:
20 fps, P0.1:
41 fps, P1:
64 fps, max:
262 fps
~ 86 fps
+ Vergleich
- Vergleich einklappen
...
...
max:
49 [X] Aoostar GOD77 (GPD G1 Radeon RX 7600M XT @USB4) AMD Ryzen 7 7735HS 3.2GHz
Radeon RX 7600M XT
min:
12 fps, max:
81 fps
68 [X] AMD Ryzen 9 7950X 4.5GHz
Radeon RX 7600M XT
min:
9 fps, P0.1:
12 fps, P1:
34 fps, max:
172 fps
~ 59 fps
+ Vergleich
- Vergleich einklappen
...
...
max:
34 [X] Aoostar GOD77 (GPD G1 Radeon RX 7600M XT @USB4) AMD Ryzen 7 7735HS 3.2GHz
Radeon RX 7600M XT
min:
12 fps, max:
60 fps
52 [X] AMD Ryzen 9 7950X 4.5GHz
Radeon RX 7600M XT
min:
4 fps, P0.1:
7 fps, P1:
30 fps, max:
136 fps
~ 43 fps
+ Vergleich
- Vergleich einklappen
...
max:
23 [X] Aoostar GOD77 (GPD G1 Radeon RX 7600M XT @USB4) AMD Ryzen 7 7735HS 3.2GHz
Radeon RX 7600M XT
min:
10 fps, max:
44 fps
24 [X] AMD Ryzen 9 7950X 4.5GHz
Radeon RX 7600M XT
min:
11 fps, P0.1:
11 fps, P1:
12 fps, max:
152 fps
~ 24 fps
+ Vergleich
- Vergleich einklappen
...
max:
» In Detailstufe max. mit allen getesteten Notebooks spielbar
Additional Benchmarks
Low Preset (Adaptive Quality Off) 1280x720
204 [X] AMD Ryzen 9 7950X 4.5GHz
Radeon RX 7600M XT
min:
7 fps, P0.1:
102 fps, P1:
157 fps, max:
285 fps
85 [X] Aoostar GOD77 (GPD G1 Radeon RX 7600M XT @USB4) AMD Ryzen 7 7735HS 3.2GHz
Radeon RX 7600M XT
min:
34 fps, max:
157 fps
...
max:
max:
max:
...
max:
max:
0 100 200 300 400 500 600 700 800 900 1000 1100 1200 1300 1400 1500 1600 1700 Tooltip
max:
» In Detailstufe max. mit allen getesteten Notebooks spielbar
Additional Benchmarks
Low Preset 1280x720
248 [X] AMD Ryzen 9 7950X 4.5GHz
Radeon RX 7600M XT
min:
73.7 fps, P0.1:
182.6 fps, P1:
193.9 fps, max:
425 fps
0 100 200 300 400 500 600 700 800 900 1000 1100 1200 1300 1400 1500 1600 1700 1800 1900 2000 2100 2200 2300 2400 2500 2600 2700 2800 2900 3000 3100 3200 3300 3400 3500 3600 3700 3800 3900 4000 4100 4200 4300 4400 4500 4600 4700 4800 4900 Tooltip
...
max:
...
max:
0 100 200 Tooltip : Ø192.9 (126.936-287.84)
...
max:
...
max:
max:
max:
» In Detailstufe max. mit allen getesteten Notebooks spielbar
Additional Benchmarks
Low Preset 1280x720
337 [X] AMD Ryzen 9 7950X 4.5GHz
Radeon RX 7600M XT
min:
21.8 fps, P0.1:
95.6 fps, P1:
142.8 fps, max:
777 fps
81.4 [X] Aoostar GOD77 (GPD G1 Radeon RX 7600M XT @USB4) 2.02
AMD Ryzen 7 7735HS 3.2GHz
Radeon RX 7600M XT
min:
45.9 fps, max:
120.8 fps
117 [X] 2.02
AMD Ryzen 9 7950X 4.5GHz
Radeon RX 7600M XT
min:
77.2 fps, max:
170.5 fps
~ 99 fps
+ Vergleich
- Vergleich einklappen
...
...
max:
70.6 [X] Aoostar GOD77 (GPD G1 Radeon RX 7600M XT @USB4) 2.02
AMD Ryzen 7 7735HS 3.2GHz
Radeon RX 7600M XT
min:
40 fps, max:
105.7 fps
93.7 [X] 2.02
AMD Ryzen 9 7950X 4.5GHz
Radeon RX 7600M XT
min:
64.6 fps, max:
129.9 fps
~ 82 fps
+ Vergleich
- Vergleich einklappen
...
max:
61.2 [X] Aoostar GOD77 (GPD G1 Radeon RX 7600M XT @USB4) 2.02
AMD Ryzen 7 7735HS 3.2GHz
Radeon RX 7600M XT
min:
35.7 fps, max:
85.5 fps
79.2 [X] 2.02
AMD Ryzen 9 7950X 4.5GHz
Radeon RX 7600M XT
min:
50.9 fps, max:
107.9 fps
84.5 [X] Tuxedo Sirius 16 Gen 1 AMD Ryzen 7 7840HS 3.8GHz
Radeon RX 7600M XT
min:
57.4 fps, max:
178.69 fps
~ 75 fps
+ Vergleich
- Vergleich einklappen
...
...
max:
55.8 [X] Aoostar GOD77 (GPD G1 Radeon RX 7600M XT @USB4) 2.02
AMD Ryzen 7 7735HS 3.2GHz
Radeon RX 7600M XT
min:
31.3 fps, max:
81.7 fps
70.7 [X] 2.02
AMD Ryzen 9 7950X 4.5GHz
Radeon RX 7600M XT
min:
41.7 fps, max:
98.9 fps
75.8 [X] Tuxedo Sirius 16 Gen 1 AMD Ryzen 7 7840HS 3.8GHz
Radeon RX 7600M XT
min:
50.76 fps, max:
103.72 fps
~ 67 fps
+ Vergleich
- Vergleich einklappen
...
...
max:
32.7 [X] Tuxedo Sirius 16 Gen 1 AMD Ryzen 7 7840HS 3.8GHz
Radeon RX 7600M XT
min:
21.82 fps, max:
87.15 fps
38.9 [X] Aoostar GOD77 (GPD G1 Radeon RX 7600M XT @USB4) 2.02
AMD Ryzen 7 7735HS 3.2GHz
Radeon RX 7600M XT
min:
23.8 fps, max:
56.6 fps
44.6 [X] 2.02
AMD Ryzen 9 7950X 4.5GHz
Radeon RX 7600M XT
min:
30.6 fps, max:
63.1 fps
~ 39 fps
+ Vergleich
- Vergleich einklappen
...
...
max:
18.3 [X] Aoostar GOD77 (GPD G1 Radeon RX 7600M XT @USB4) 2.02
AMD Ryzen 7 7735HS 3.2GHz
Radeon RX 7600M XT
min:
13 fps, max:
27.4 fps
18.4 [X] Aoostar GOD77 (GPD G1 Radeon RX 7600M XT @USB4) 2.02
AMD Ryzen 7 7735HS 3.2GHz
Radeon RX 7600M XT
min:
13.1 fps, max:
27.6 fps
19.1 [X] 2.02
AMD Ryzen 9 7950X 4.5GHz
Radeon RX 7600M XT
min:
15.5 fps, max:
28.4 fps
~ 19 fps
+ Vergleich
- Vergleich einklappen
...
max:
max:
max:
» In Detailstufe max. mit allen getesteten Notebooks spielbar
Additional Benchmarks
Low Preset (FSR off) 1280x720
163.6 [X] AMD Ryzen 9 7950X 4.5GHz
Radeon RX 7600M XT
min:
68.7 fps, max:
280 fps
98.8 [X] Aoostar GOD77 (GPD G1 Radeon RX 7600M XT @USB4) AMD Ryzen 7 7735HS 3.2GHz
Radeon RX 7600M XT
min:
53.8 fps, max:
158.7 fps
Ray Tracing Ultra Preset (DLSS off) 1920x1080
20.4 [X] AMD Ryzen 9 7950X 4.5GHz
Radeon RX 7600M XT
min:
15.8 fps, max:
26.9 fps
Steam Deck 1280x720
171.9 [X] AMD Ryzen 9 7950X 4.5GHz
Radeon RX 7600M XT
min:
57.8 fps, max:
268 fps
102.8 [X] Aoostar GOD77 (GPD G1 Radeon RX 7600M XT @USB4) AMD Ryzen 7 7735HS 3.2GHz
Radeon RX 7600M XT
min:
56.2 fps, max:
162 fps
Ultra Preset (FSR on) 1920x1080
85.8 [X] AMD Ryzen 9 7950X 4.5GHz
Radeon RX 7600M XT
min:
49.5 fps, max:
123.9 fps
94 [X] Tuxedo Sirius 16 Gen 1 AMD Ryzen 7 7840HS 3.8GHz
Radeon RX 7600M XT
min:
62.64 fps, max:
142.24 fps
0 100 200 Tooltip : Ø126.4 (100.228-156.105)
: Ø176.2 (150.41-226.99)
...
max:
0 100 200 300 Tooltip : Ø110.3 (81.285-135.51)
: Ø160.7 (132.08-342.1)
...
...
max:
0 100 Tooltip : Ø103.8 (72.72-125.74)
: Ø128.1 (113.166-157.182)
...
...
max:
0 100 Tooltip : Ø104.1 (92.13-145.2)
: Ø117.4 (102.063-169.2)
...
max:
0 100 Tooltip : Ø77.1 (57.011-114.7)
: Ø78.5 (68.636-106.7)
...
max:
0 100 200 300 400 500 600 700 800 900 1000 1100 1200 1300 1400 Tooltip : Ø101.6 (33.084-1425)
: Ø41.8 (33.038-66.8)
max:
» In Detailstufe max. mit allen getesteten Notebooks spielbar
Additional Benchmarks
Low Preset 1280x720
270 [X] AMD Ryzen 9 7950X 4.5GHz
Radeon RX 7600M XT
min:
36.4 fps, P0.1:
139.1 fps, P1:
175.7 fps, max:
497 fps
130 [X] Aoostar GOD77 (GPD G1 Radeon RX 7600M XT @USB4) AMD Ryzen 7 7735HS 3.2GHz
Radeon RX 7600M XT
min:
40.7 fps, P0.1:
50.5 fps, P1:
80.9 fps, max:
210 fps
...
max:
...
max:
...
max:
...
max:
max:
0 100 200 300 400 500 600 700 Tooltip
max:
» In Detailstufe max. mit allen getesteten Notebooks spielbar
Additional Benchmarks
Low Preset 1280x720
82.1 [X] AMD Ryzen 9 7950X 4.5GHz
Radeon RX 7600M XT
min:
44.5 fps, P0.1:
48.9 fps, P1:
58.8 fps, max:
145.1 fps
...
max:
...
max:
...
max:
...
...
max:
max:
max:
» In Detailstufe max. mit allen getesteten Notebooks spielbar
Additional Benchmarks
Low Preset 1280x720
119.2 [X] AMD Ryzen 9 7950X 4.5GHz
Radeon RX 7600M XT
min:
19.5 fps, P0.1:
60.8 fps, P1:
94.8 fps, max:
187.9 fps
...
max:
...
max:
...
max:
...
max:
...
max:
» In Detailstufe max. mit allen getesteten Notebooks spielbar
Additional Benchmarks
Low 1280x720
115.8 [X] AMD Ryzen 9 7950X 4.5GHz
Radeon RX 7600M XT
min:
19.5 fps, P0.1:
37.1 fps, P1:
80.3 fps, max:
203 fps
...
max:
...
max:
0 100 Tooltip : Ø123.1 (100.076-148.05)
...
max:
...
max:
max:
...
max:
» In Detailstufe max. mit allen getesteten Notebooks spielbar
Additional Benchmarks
Low Preset 1280x720
184.1 [X] AMD Ryzen 9 7950X 4.5GHz
Radeon RX 7600M XT
min:
34.2 fps, P0.1:
87.1 fps, P1:
144.2 fps, max:
229 fps
...
max:
...
max:
...
...
max:
...
...
max:
...
max:
max:
» In Detailstufe max. mit allen getesteten Notebooks spielbar
Additional Benchmarks
Low Preset 1280x720
179.8 [X] AMD Ryzen 9 7950X 4.5GHz
Radeon RX 7600M XT
min:
60.7 fps, P0.1:
71.8 fps, P1:
123.3 fps, max:
365 fps
...
...
max:
...
max:
...
max:
0 100 200 300 400 500 600 700 800 900 1000 1100 1200 1300 1400 1500 1600 1700 Tooltip
...
max:
...
max:
...
max:
» Mit den meisten getesteten Laptops in den getesteten Detailstufen nicht flüssig spielbar.
Additional Benchmarks
Very Low Preset 1280x720
32 [X] AMD Ryzen 9 7950X 4.5GHz
Radeon RX 7600M XT
min:
8.02 fps, P0.1:
8.19 fps, P1:
10.7 fps, max:
54.2 fps
Very High Preset + Very High Raytracing TAA 1920x1080
7.1 [X] AMD Ryzen 9 7950X 4.5GHz
Radeon RX 7600M XT
min:
3.54 fps, P0.1:
3.71 fps, P1:
4.01 fps, max:
16 fps
68.7 [X] GPD G1 Radeon RX 7600M XT (USB4 @PCIe x4 3.0) 1050579
AMD Ryzen 7 7840HS 3.8GHz
Radeon RX 7600M XT
min:
48 fps, P1:
25 fps, max:
87 fps
105.2 [X] Aoostar GOD77 (GPD G1 Radeon RX 7600M XT @USB4) 1057599
AMD Ryzen 7 7735HS 3.2GHz
Radeon RX 7600M XT
min:
77 fps, P1:
39 fps, max:
131 fps
251 [X] GPD G1 Radeon RX 7600M XT (OCuLink @PCIe x4 4.0) 1050579
AMD Ryzen 7 7840HS 3.8GHz
Radeon RX 7600M XT
min:
195 fps, P1:
181 fps, max:
274 fps
274 [X] GPD G1 Radeon RX 7600M XT (120 Watt, OCuLink @PCIe x4 4.0) 1057599
AMD Ryzen 7 7840HS 3.8GHz
Radeon RX 7600M XT
min:
218 fps, P1:
182 fps, max:
319 fps
289 [X] 1050579
AMD Ryzen 9 7950X 4.5GHz
Radeon RX 7600M XT
min:
230 fps, P1:
175 fps, max:
331 fps
~ 198 fps
+ Vergleich
- Vergleich einklappen
...
...
max:
67.1 [X] GPD G1 Radeon RX 7600M XT (USB4 @PCIe x4 3.0) 1050579
AMD Ryzen 7 7840HS 3.8GHz
Radeon RX 7600M XT
min:
50 fps, P1:
26 fps, max:
87 fps
104 [X] Aoostar GOD77 (GPD G1 Radeon RX 7600M XT @USB4) 1057599
AMD Ryzen 7 7735HS 3.2GHz
Radeon RX 7600M XT
min:
64 fps, P1:
37 fps, max:
136 fps
247 [X] GPD G1 Radeon RX 7600M XT (OCuLink @PCIe x4 4.0) 1050579
AMD Ryzen 7 7840HS 3.8GHz
Radeon RX 7600M XT
min:
197 fps, P1:
175 fps, max:
271 fps
250 [X] GPD G1 Radeon RX 7600M XT (120 Watt, OCuLink @PCIe x4 4.0) 1057599
AMD Ryzen 7 7840HS 3.8GHz
Radeon RX 7600M XT
min:
203 fps, P1:
186 fps, max:
294 fps
265 [X] 1050579
AMD Ryzen 9 7950X 4.5GHz
Radeon RX 7600M XT
min:
225 fps, P1:
191 fps, max:
311 fps
~ 187 fps
+ Vergleich
- Vergleich einklappen
...
...
max:
54.7 [X] GPD G1 Radeon RX 7600M XT (USB4 @PCIe x4 3.0) 1050579
AMD Ryzen 7 7840HS 3.8GHz
Radeon RX 7600M XT
min:
38 fps, P1:
20 fps, max:
67 fps
86.5 [X] Aoostar GOD77 (GPD G1 Radeon RX 7600M XT @USB4) 1057599
AMD Ryzen 7 7735HS 3.2GHz
Radeon RX 7600M XT
min:
61 fps, P1:
37 fps, max:
106 fps
180.6 [X] GPD G1 Radeon RX 7600M XT (120 Watt, OCuLink @PCIe x4 4.0) 1057599
AMD Ryzen 7 7840HS 3.8GHz
Radeon RX 7600M XT
min:
150 fps, P1:
146 fps, max:
207 fps
188.4 [X] 1050579
AMD Ryzen 9 7950X 4.5GHz
Radeon RX 7600M XT
min:
156 fps, P1:
153 fps, max:
212 fps
189.9 [X] GPD G1 Radeon RX 7600M XT (OCuLink @PCIe x4 4.0) 1050579
AMD Ryzen 7 7840HS 3.8GHz
Radeon RX 7600M XT
min:
159 fps, P1:
156 fps, max:
217 fps
191 [X] Tuxedo Sirius 16 Gen 1 AMD Ryzen 7 7840HS 3.8GHz
Radeon RX 7600M XT
min:
165 fps, max:
221 fps
~ 149 fps
+ Vergleich
- Vergleich einklappen
...
max:
17 [X] Tuxedo Sirius 16 Gen 1 AMD Ryzen 7 7840HS 3.8GHz
Radeon RX 7600M XT
min:
10 fps, max:
23 fps
20.5 [X] GPD G1 Radeon RX 7600M XT (USB4 @PCIe x4 3.0) 1050579
AMD Ryzen 7 7840HS 3.8GHz
Radeon RX 7600M XT
min:
4 fps, P1:
13 fps, max:
24 fps
28.9 [X] 1050579
AMD Ryzen 9 7950X 4.5GHz
Radeon RX 7600M XT
min:
17 fps, P1:
19 fps, max:
37 fps
30.1 [X] Aoostar GOD77 (GPD G1 Radeon RX 7600M XT @USB4) 1057599
AMD Ryzen 7 7735HS 3.2GHz
Radeon RX 7600M XT
min:
9 fps, P1:
17 fps, max:
37 fps
32.9 [X] GPD G1 Radeon RX 7600M XT (OCuLink @PCIe x4 4.0) 1050579
AMD Ryzen 7 7840HS 3.8GHz
Radeon RX 7600M XT
min:
21 fps, P1:
21 fps, max:
41 fps
39.3 [X] GPD G1 Radeon RX 7600M XT (120 Watt, OCuLink @PCIe x4 4.0) 1057599
AMD Ryzen 7 7840HS 3.8GHz
Radeon RX 7600M XT
min:
25 fps, P1:
25 fps, max:
48 fps
~ 28 fps
+ Vergleich
- Vergleich einklappen
...
...
max:
6.9 [X] 1050579
AMD Ryzen 9 7950X 4.5GHz
Radeon RX 7600M XT
min:
1 fps, P1:
5 fps, max:
9 fps
10.9 [X] GPD G1 Radeon RX 7600M XT (OCuLink @PCIe x4 4.0) 1050579
AMD Ryzen 7 7840HS 3.8GHz
Radeon RX 7600M XT
min:
6 fps, P1:
8 fps, max:
14 fps
14.7 [X] Aoostar GOD77 (GPD G1 Radeon RX 7600M XT @USB4) 1057599
AMD Ryzen 7 7735HS 3.2GHz
Radeon RX 7600M XT
min:
4 fps, P1:
9 fps, max:
19 fps
23.9 [X] GPD G1 Radeon RX 7600M XT (120 Watt, OCuLink @PCIe x4 4.0) 1057599
AMD Ryzen 7 7840HS 3.8GHz
Radeon RX 7600M XT
min:
13 fps, P1:
13 fps, max:
30 fps
27 [X] Tuxedo Sirius 16 Gen 1 AMD Ryzen 7 7840HS 3.8GHz
Radeon RX 7600M XT
min:
17 fps, max:
38 fps
~ 17 fps
+ Vergleich
- Vergleich einklappen
...
max:
3.2 [X] 1050579
AMD Ryzen 9 7950X 4.5GHz
Radeon RX 7600M XT
P1:
2 fps, max:
4 fps
5.4 [X] GPD G1 Radeon RX 7600M XT (120 Watt, OCuLink @PCIe x4 4.0) 1057599
AMD Ryzen 7 7840HS 3.8GHz
Radeon RX 7600M XT
min:
3 fps, P1:
4 fps, max:
7 fps
5.9 [X] GPD G1 Radeon RX 7600M XT (OCuLink @PCIe x4 4.0) 1050579
AMD Ryzen 7 7840HS 3.8GHz
Radeon RX 7600M XT
min:
3 fps, P1:
3 fps, max:
8 fps
~ 5 fps
+ Vergleich
- Vergleich einklappen
max:
» In Detailstufe hoch mit allen getesteten Notebooks spielbar
Additional Benchmarks
Ultra Low Preset TAA 1280x720
306 [X] AMD Ryzen 9 7950X 4.5GHz
Radeon RX 7600M XT
min:
214 fps, P1:
176 fps, max:
400 fps
232 [X] GPD G1 Radeon RX 7600M XT (OCuLink @PCIe x4 4.0) 1050579
AMD Ryzen 7 7840HS 3.8GHz
Radeon RX 7600M XT
min:
183 fps, P1:
161 fps, max:
271 fps
63.4 [X] GPD G1 Radeon RX 7600M XT (USB4 @PCIe x4 3.0) 1050579
AMD Ryzen 7 7840HS 3.8GHz
Radeon RX 7600M XT
min:
43 fps, P1:
23 fps, max:
92 fps
264 [X] GPD G1 Radeon RX 7600M XT (120 Watt, OCuLink @PCIe x4 4.0) 1057599
AMD Ryzen 7 7840HS 3.8GHz
Radeon RX 7600M XT
min:
206 fps, P1:
171 fps, max:
339 fps
77.9 [X] Aoostar GOD77 (GPD G1 Radeon RX 7600M XT @USB4) AMD Ryzen 7 7735HS 3.2GHz
Radeon RX 7600M XT
min:
2 fps, P1:
35 fps, max:
105 fps
...
...
max:
...
max:
...
max:
...
max:
max:
max:
» In Detailstufe max. mit allen getesteten Notebooks spielbar
Additional Benchmarks
Low Preset 1280x720
376 [X] AMD Ryzen 9 7950X 4.5GHz
Radeon RX 7600M XT
min:
48 fps, P0.1:
136.8 fps, P1:
256 fps, max:
552 fps
...
max:
...
max:
...
...
max:
...
max:
...
max:
max:
» In Detailstufe max. mit allen getesteten Notebooks spielbar
Additional Benchmarks
Low Preset 1280x720
138.4 [X] AMD Ryzen 9 7950X 4.5GHz
Radeon RX 7600M XT
min:
49.8 fps, P0.1:
68.9 fps, P1:
98.4 fps, max:
191.3 fps
Epic Preset + Ray Tracing 1920x1080
37.3 [X] AMD Ryzen 9 7950X 4.5GHz
Radeon RX 7600M XT
min:
10.7 fps, P0.1:
24.2 fps, P1:
28.2 fps, max:
66.6 fps
...
max:
...
max:
...
max:
...
max:
max:
max:
» In Detailstufe max. mit allen getesteten Notebooks spielbar
Additional Benchmarks
Low Preset Low TAA 1280x720
340 [X] AMD Ryzen 9 7950X 4.5GHz
Radeon RX 7600M XT
min:
14.8 fps, P0.1:
32.7 fps, P1:
229 fps, max:
475 fps
0 100 200 300 400 500 600 700 800 Tooltip
...
max:
...
max:
...
max:
...
max:
max:
max:
» In Detailstufe max. mit allen getesteten Notebooks spielbar
Additional Benchmarks
Low Preset 1280x720
119.5 [X] AMD Ryzen 9 7950X 4.5GHz
Radeon RX 7600M XT
min:
36.1 fps, P0.1:
77.1 fps, P1:
97.7 fps, max:
192.7 fps
0 100 Tooltip : Ø138.4 (122.94-182.164)
...
max:
...
max:
...
max:
...
max:
max:
max:
» In Detailstufe max. mit allen getesteten Notebooks spielbar
Additional Benchmarks
Prioritize Performance Preset 1280x720
185.6 [X] AMD Ryzen 9 7950X 4.5GHz
Radeon RX 7600M XT
min:
7.38 fps, P0.1:
86.1 fps, P1:
153 fps, max:
258 fps
...
max:
...
max:
...
max:
...
max:
max:
max:
» In Detailstufe max. mit allen getesteten Notebooks spielbar
Additional Benchmarks
Minimum Settings 1280x720
263.1 [X] AMD Ryzen 9 7950X 4.5GHz
Radeon RX 7600M XT
P0.1:
57 fpsP1:
137 fps
0 100 200 300 400 500 600 Tooltip
...
max:
...
max:
...
max:
...
max:
max:
max:
» In Detailstufe max. mit allen getesteten Notebooks spielbar
Additional Benchmarks
Ultra Low Preset 1280x720
114.8 [X] AMD Ryzen 9 7950X 4.5GHz
Radeon RX 7600M XT
min:
7.2 fps, P0.1:
43.8 fps, P1:
83.4 fps, max:
161.1 fps
...
max:
...
...
max:
...
max:
...
max:
...
max:
max:
» In Detailstufe max. mit allen getesteten Notebooks spielbar
Additional Benchmarks
Low Preset 1280x720
241 [X] AMD Ryzen 9 7950X 4.5GHz
Radeon RX 7600M XT
min:
129.2 fps, P0.1:
186.9 fps, P1:
208 fps, max:
366 fps
...
max:
...
max:
...
max:
...
max:
max:
max:
» In Detailstufe max. mit allen getesteten Notebooks spielbar
Additional Benchmarks
Low Preset 1280x720
134 [X] AMD Ryzen 9 7950X 4.5GHz
Radeon RX 7600M XT
Epic Preset + Epic Ray-Tracing 1920x1080
43 [X] AMD Ryzen 9 7950X 4.5GHz
Radeon RX 7600M XT
Epic Preset + Epic Ray-Tracing 3840x2160
9 [X] AMD Ryzen 9 7950X 4.5GHz
Radeon RX 7600M XT
...
max:
...
max:
...
max:
...
max:
max:
max:
» In Detailstufe max. mit allen getesteten Notebooks spielbar
Additional Benchmarks
Low Preset Low TAA 1280x720
180.3 [X] AMD Ryzen 9 7950X 4.5GHz
Radeon RX 7600M XT
min:
42.8 fps, P0.1:
84.2 fps, P1:
115.5 fps, max:
223 fps
Ultra Preset + Full Ray Tracing High TAA 1920x1080
28.4 [X] AMD Ryzen 9 7950X 4.5GHz
Radeon RX 7600M XT
min:
3.03 fps, P0.1:
3.86 fps, P1:
14 fps, max:
86 fps
Ultra Preset + Full Ray Tracing High TAA 3840x2160
1.7 [X] AMD Ryzen 9 7950X 4.5GHz
Radeon RX 7600M XT
min:
0.673 fps, P0.1:
0.674 fps, P1:
0.691 fps, max:
2.68 fps
...
max:
...
...
max:
...
max:
...
max:
max:
...
...
max:
» In Detailstufe max. mit allen getesteten Notebooks spielbar
Additional Benchmarks
Low Preset TAA 1280x720
115.1 [X] AMD Ryzen 9 7950X 4.5GHz
Radeon RX 7600M XT
min:
23.5 fps, P0.1:
32.7 fps, P1:
60.4 fps, max:
913 fps
...
max:
...
max:
...
max:
...
max:
...
max:
...
max:
» In Detailstufe max. mit allen getesteten Notebooks spielbar
Additional Benchmarks
Low Preset / Off 1280x720
228 [X] AMD Ryzen 9 7950X 4.5GHz
Radeon RX 7600M XT
min:
10.5 fps, P0.1:
38.3 fps, P1:
142.9 fps, max:
427 fps
RT Ultra Preset / On FXAA 1920x1080
22 [X] AMD Ryzen 9 7950X 4.5GHz
Radeon RX 7600M XT
min:
5.29 fps, P0.1:
5.81 fps, P1:
8.63 fps, max:
125.8 fps
...
max:
...
...
max:
...
max:
...
max:
max:
...
max:
» In Detailstufe max. mit allen getesteten Notebooks spielbar
Additional Benchmarks
Low Preset 1280x720
339 [X] AMD Ryzen 9 7950X 4.5GHz
Radeon RX 7600M XT
min:
12.6 fps, P0.1:
85 fps, P1:
193.7 fps, max:
478 fps
...
max:
...
max:
...
...
max:
...
...
max:
...
...
max:
...
...
max:
» In Detailstufe max. mit allen getesteten Notebooks spielbar
Additional Benchmarks
Low Preset (without FSR Upscaling) 1280x720
222.3 [X] AMD Ryzen 9 7950X 4.5GHz
Radeon RX 7600M XT
Ultra Preset (without FSR Upscaling) + Full Ray-Tracing 1920x1080
67.6 [X] AMD Ryzen 9 7950X 4.5GHz
Radeon RX 7600M XT
...
max:
...
max:
0 100 200 300 400 500 600 700 800 900 1000 1100 1200 1300 1400 1500 1600 1700 1800 1900 2000 2100 2200 2300 2400 2500 2600 2700 2800 2900 3000 3100 3200 3300 3400 3500 3600 3700 3800 3900 4000 4100 Tooltip
...
max:
...
max:
max:
max:
» In Detailstufe max. mit allen getesteten Notebooks spielbar
Additional Benchmarks
Low Preset 1280x720
175.3 [X] AMD Ryzen 9 7950X 4.5GHz
Radeon RX 7600M XT
min:
21.8 fps, P0.1:
108.4 fps, P1:
134.8 fps, max:
423 fps
...
max:
...
max:
...
max:
...
max:
...
max:
...
max:
» In Detailstufe max. mit allen getesteten Notebooks spielbar
Additional Benchmarks
Very Low Preset 1280x720
150.9 [X] AMD Ryzen 9 7950X 4.5GHz
Radeon RX 7600M XT
min:
78.7 fps, P0.1:
88.3 fps, P1:
102.2 fps, max:
253 fps
Very High Preset + Ray-Tracing TAA 1920x0180
14 [X] AMD Ryzen 9 7950X 4.5GHz
Radeon RX 7600M XT
min:
9.36 fps, P0.1:
9.52 fps, P1:
9.94 fps, max:
44.8 fps
...
max:
...
...
max:
...
...
max:
...
...
max:
...
max:
max:
» In Detailstufe max. mit allen getesteten Notebooks spielbar
Additional Benchmarks
Low Preset 1280x720
92.7 [X] AMD Ryzen 9 7950X 4.5GHz
Radeon RX 7600M XT
min:
66.9 fps, P0.1:
81.7 fps, P1:
83.1 fps, max:
125 fps
...
max:
...
max:
...
max:
0 100 200 300 400 500 600 Tooltip
...
...
max:
...
max:
...
max:
» In Detailstufe max. mit allen getesteten Notebooks spielbar
Additional Benchmarks
Low Preset 1280x720
127.6 [X] AMD Ryzen 9 7950X 4.5GHz
Radeon RX 7600M XT
min:
63.9 fps, P0.1:
71.1 fps, P1:
98.9 fps, max:
237 fps
0 100 200 300 400 500 600 700 Tooltip
...
max:
...
max:
...
max:
...
max:
max:
...
max:
» In Detailstufe max. mit allen getesteten Notebooks spielbar
Additional Benchmarks
Low Preset 1280x720
206 [X] AMD Ryzen 9 7950X 4.5GHz
Radeon RX 7600M XT
min:
15.3 fps, P0.1:
124.2 fps, P1:
169.1 fps, max:
348 fps
66.5 [X] GPD G1 Radeon RX 7600M XT (USB4 @PCIe x4 3.0) 959964
AMD Ryzen 7 7840HS 3.8GHz
Radeon RX 7600M XT
min:
45 fps, P1:
21 fps, max:
99 fps
96.5 [X] Aoostar GOD77 (GPD G1 Radeon RX 7600M XT @USB4) 959964
AMD Ryzen 7 7735HS 3.2GHz
Radeon RX 7600M XT
min:
63 fps, P1:
29 fps, max:
142 fps
254 [X] GPD G1 Radeon RX 7600M XT (OCuLink @PCIe x4 4.0) 959964
AMD Ryzen 7 7840HS 3.8GHz
Radeon RX 7600M XT
min:
180 fps, P1:
146 fps, max:
311 fps
275 [X] GPD G1 Radeon RX 7600M XT (120 Watt, OCuLink @PCIe x4 4.0) 959964
AMD Ryzen 7 7840HS 3.8GHz
Radeon RX 7600M XT
min:
203 fps, P1:
159 fps, max:
336 fps
294 [X] 959964
AMD Ryzen 9 7950X 4.5GHz
Radeon RX 7600M XT
min:
210 fps, P1:
138 fps, max:
357 fps
~ 197 fps
+ Vergleich
- Vergleich einklappen
...
...
max:
62 [X] GPD G1 Radeon RX 7600M XT (USB4 @PCIe x4 3.0) 959964
AMD Ryzen 7 7840HS 3.8GHz
Radeon RX 7600M XT
min:
26 fps, P1:
20 fps, max:
87 fps
88.8 [X] Aoostar GOD77 (GPD G1 Radeon RX 7600M XT @USB4) 959964
AMD Ryzen 7 7735HS 3.2GHz
Radeon RX 7600M XT
min:
57 fps, P1:
26 fps, max:
131 fps
249 [X] GPD G1 Radeon RX 7600M XT (120 Watt, OCuLink @PCIe x4 4.0) 959964
AMD Ryzen 7 7840HS 3.8GHz
Radeon RX 7600M XT
min:
201 fps, P1:
151 fps, max:
293 fps
250 [X] GPD G1 Radeon RX 7600M XT (OCuLink @PCIe x4 4.0) 959964
AMD Ryzen 7 7840HS 3.8GHz
Radeon RX 7600M XT
min:
169 fps, P1:
144 fps, max:
285 fps
263 [X] 959964
AMD Ryzen 9 7950X 4.5GHz
Radeon RX 7600M XT
min:
192 fps, P1:
129 fps, max:
303 fps
~ 183 fps
+ Vergleich
- Vergleich einklappen
...
...
max:
51.4 [X] GPD G1 Radeon RX 7600M XT (USB4 @PCIe x4 3.0) 959964
AMD Ryzen 7 7840HS 3.8GHz
Radeon RX 7600M XT
min:
28 fps, P1:
17 fps, max:
69 fps
71.9 [X] Aoostar GOD77 (GPD G1 Radeon RX 7600M XT @USB4) 959964
AMD Ryzen 7 7735HS 3.2GHz
Radeon RX 7600M XT
min:
38 fps, P1:
20 fps, max:
101 fps
194.8 [X] GPD G1 Radeon RX 7600M XT (OCuLink @PCIe x4 4.0) 959964
AMD Ryzen 7 7840HS 3.8GHz
Radeon RX 7600M XT
min:
157 fps, P1:
128 fps, max:
227 fps
195.4 [X] GPD G1 Radeon RX 7600M XT (120 Watt, OCuLink @PCIe x4 4.0) 959964
AMD Ryzen 7 7840HS 3.8GHz
Radeon RX 7600M XT
min:
156 fps, P1:
129 fps, max:
231 fps
203 [X] 959964
AMD Ryzen 9 7950X 4.5GHz
Radeon RX 7600M XT
min:
161 fps, P1:
107 fps, max:
243 fps
~ 143 fps
+ Vergleich
- Vergleich einklappen
...
...
max:
28.8 [X] GPD G1 Radeon RX 7600M XT (USB4 @PCIe x4 3.0) 959964
AMD Ryzen 7 7840HS 3.8GHz
Radeon RX 7600M XT
min:
20 fps, P1:
12 fps, max:
36 fps
33.3 [X] Aoostar GOD77 (GPD G1 Radeon RX 7600M XT @USB4) 959964
AMD Ryzen 7 7735HS 3.2GHz
Radeon RX 7600M XT
min:
21 fps, P1:
12 fps, max:
45 fps
48.6 [X] 959964
AMD Ryzen 9 7950X 4.5GHz
Radeon RX 7600M XT
min:
35 fps, P1:
34 fps, max:
61 fps
50.3 [X] GPD G1 Radeon RX 7600M XT (OCuLink @PCIe x4 4.0) 959964
AMD Ryzen 7 7840HS 3.8GHz
Radeon RX 7600M XT
min:
36 fps, P1:
36 fps, max:
62 fps
53.5 [X] GPD G1 Radeon RX 7600M XT (120 Watt, OCuLink @PCIe x4 4.0) 959964
AMD Ryzen 7 7840HS 3.8GHz
Radeon RX 7600M XT
min:
38 fps, P1:
39 fps, max:
65 fps
~ 43 fps
+ Vergleich
- Vergleich einklappen
...
...
max:
21.1 [X] GPD G1 Radeon RX 7600M XT (USB4 @PCIe x4 3.0) 959964
AMD Ryzen 7 7840HS 3.8GHz
Radeon RX 7600M XT
min:
15 fps, P1:
11 fps, max:
25 fps
23.8 [X] Aoostar GOD77 (GPD G1 Radeon RX 7600M XT @USB4) 959964
AMD Ryzen 7 7735HS 3.2GHz
Radeon RX 7600M XT
min:
16 fps, P1:
10 fps, max:
30 fps
26.6 [X] 959964
AMD Ryzen 9 7950X 4.5GHz
Radeon RX 7600M XT
min:
20 fps, P1:
19 fps, max:
32 fps
31.4 [X] GPD G1 Radeon RX 7600M XT (OCuLink @PCIe x4 4.0) 959964
AMD Ryzen 7 7840HS 3.8GHz
Radeon RX 7600M XT
min:
23 fps, P1:
23 fps, max:
38 fps
34.5 [X] GPD G1 Radeon RX 7600M XT (120 Watt, OCuLink @PCIe x4 4.0) 959964
AMD Ryzen 7 7840HS 3.8GHz
Radeon RX 7600M XT
min:
24 fps, P1:
24 fps, max:
43 fps
~ 27 fps
+ Vergleich
- Vergleich einklappen
...
...
max:
5 [X] 959964
AMD Ryzen 9 7950X 4.5GHz
Radeon RX 7600M XT
min:
3 fps, P1:
3 fps, max:
7 fps
7.9 [X] GPD G1 Radeon RX 7600M XT (OCuLink @PCIe x4 4.0) 959964
AMD Ryzen 7 7840HS 3.8GHz
Radeon RX 7600M XT
min:
6 fps, P1:
6 fps, max:
10 fps
11.6 [X] GPD G1 Radeon RX 7600M XT (USB4 @PCIe x4 3.0) 959964
AMD Ryzen 7 7840HS 3.8GHz
Radeon RX 7600M XT
min:
8 fps, P1:
8 fps, max:
13 fps
13.4 [X] GPD G1 Radeon RX 7600M XT (120 Watt, OCuLink @PCIe x4 4.0) 959964
AMD Ryzen 7 7840HS 3.8GHz
Radeon RX 7600M XT
min:
6 fps, P1:
6 fps, max:
18 fps
~ 9 fps
+ Vergleich
- Vergleich einklappen
...
max:
» In Detailstufe max. mit den meisten getesteten Laptops spielbar
Additional Benchmarks
Ultra Low Preset 16xAF TAA 1280x720
423 [X] AMD Ryzen 9 7950X 4.5GHz
Radeon RX 7600M XT
min:
267 fps, P1:
242 fps, max:
476 fps
311 [X] GPD G1 Radeon RX 7600M XT (OCuLink @PCIe x4 4.0) 1050579
AMD Ryzen 7 7840HS 3.8GHz
Radeon RX 7600M XT
min:
216 fps, P1:
192 fps, max:
342 fps
97.9 [X] GPD G1 Radeon RX 7600M XT (USB4 @PCIe x4 3.0) 1050579
AMD Ryzen 7 7840HS 3.8GHz
Radeon RX 7600M XT
min:
70 fps, P1:
34 fps, max:
121 fps
348 [X] GPD G1 Radeon RX 7600M XT (120 Watt, OCuLink @PCIe x4 4.0) 1057599
AMD Ryzen 7 7840HS 3.8GHz
Radeon RX 7600M XT
min:
255 fps, P1:
220 fps, max:
380 fps
152 [X] Aoostar GOD77 (GPD G1 Radeon RX 7600M XT @USB4) AMD Ryzen 7 7735HS 3.2GHz
Radeon RX 7600M XT
min:
110 fps, P1:
92 fps, max:
179 fps
...
max:
...
max:
...
max:
...
max:
...
max:
max:
» In Detailstufe max. mit allen getesteten Notebooks spielbar
Additional Benchmarks
Lowest Settings 1280x720
257 [X] AMD Ryzen 9 7950X 4.5GHz
Radeon RX 7600M XT
min:
39.9 fps, P0.1:
109.9 fps, P1:
171.9 fps, max:
362 fps
Highest Settings + Maximum Ray Tracing 1920x1080
46.2 [X] AMD Ryzen 9 7950X 4.5GHz
Radeon RX 7600M XT
min:
23.8 fps, P0.1:
24.8 fps, P1:
25.6 fps, max:
180.7 fps
158 [X] Aoostar GOD77 (GPD G1 Radeon RX 7600M XT @USB4) AMD Ryzen 7 7735HS 3.2GHz
Radeon RX 7600M XT
169.3 [X] GPD G1 Radeon RX 7600M XT (USB4 @PCIe x4 3.0) AMD Ryzen 7 7840HS 3.8GHz
Radeon RX 7600M XT
219 [X] GPD G1 Radeon RX 7600M XT (120 Watt, OCuLink @PCIe x4 4.0) AMD Ryzen 7 7840HS 3.8GHz
Radeon RX 7600M XT
220 [X] GPD G1 Radeon RX 7600M XT (OCuLink @PCIe x4 4.0) AMD Ryzen 7 7840HS 3.8GHz
Radeon RX 7600M XT
237 [X] AMD Ryzen 9 7950X 4.5GHz
Radeon RX 7600M XT
~ 201 fps
+ Vergleich
- Vergleich einklappen
...
max:
122.5 [X] Aoostar GOD77 (GPD G1 Radeon RX 7600M XT @USB4) AMD Ryzen 7 7735HS 3.2GHz
Radeon RX 7600M XT
129.8 [X] GPD G1 Radeon RX 7600M XT (USB4 @PCIe x4 3.0) AMD Ryzen 7 7840HS 3.8GHz
Radeon RX 7600M XT
165.2 [X] GPD G1 Radeon RX 7600M XT (120 Watt, OCuLink @PCIe x4 4.0) AMD Ryzen 7 7840HS 3.8GHz
Radeon RX 7600M XT
177.3 [X] GPD G1 Radeon RX 7600M XT (OCuLink @PCIe x4 4.0) AMD Ryzen 7 7840HS 3.8GHz
Radeon RX 7600M XT
183.9 [X] AMD Ryzen 9 7950X 4.5GHz
Radeon RX 7600M XT
~ 156 fps
+ Vergleich
- Vergleich einklappen
...
...
max:
80.8 [X] Aoostar GOD77 (GPD G1 Radeon RX 7600M XT @USB4) AMD Ryzen 7 7735HS 3.2GHz
Radeon RX 7600M XT
87.4 [X] GPD G1 Radeon RX 7600M XT (USB4 @PCIe x4 3.0) AMD Ryzen 7 7840HS 3.8GHz
Radeon RX 7600M XT
105.8 [X] GPD G1 Radeon RX 7600M XT (120 Watt, OCuLink @PCIe x4 4.0) AMD Ryzen 7 7840HS 3.8GHz
Radeon RX 7600M XT
116.5 [X] GPD G1 Radeon RX 7600M XT (OCuLink @PCIe x4 4.0) AMD Ryzen 7 7840HS 3.8GHz
Radeon RX 7600M XT
117.1 [X] AMD Ryzen 9 7950X 4.5GHz
Radeon RX 7600M XT
~ 102 fps
+ Vergleich
- Vergleich einklappen
...
...
max:
68.2 [X] Aoostar GOD77 (GPD G1 Radeon RX 7600M XT @USB4) AMD Ryzen 7 7735HS 3.2GHz
Radeon RX 7600M XT
70.9 [X] GPD G1 Radeon RX 7600M XT (USB4 @PCIe x4 3.0) AMD Ryzen 7 7840HS 3.8GHz
Radeon RX 7600M XT
82.4 [X] GPD G1 Radeon RX 7600M XT (120 Watt, OCuLink @PCIe x4 4.0) AMD Ryzen 7 7840HS 3.8GHz
Radeon RX 7600M XT
89.9 [X] GPD G1 Radeon RX 7600M XT (OCuLink @PCIe x4 4.0) AMD Ryzen 7 7840HS 3.8GHz
Radeon RX 7600M XT
90.1 [X] AMD Ryzen 9 7950X 4.5GHz
Radeon RX 7600M XT
~ 80 fps
+ Vergleich
- Vergleich einklappen
...
...
max:
49.1 [X] Aoostar GOD77 (GPD G1 Radeon RX 7600M XT @USB4) AMD Ryzen 7 7735HS 3.2GHz
Radeon RX 7600M XT
51.4 [X] GPD G1 Radeon RX 7600M XT (USB4 @PCIe x4 3.0) AMD Ryzen 7 7840HS 3.8GHz
Radeon RX 7600M XT
57 [X] GPD G1 Radeon RX 7600M XT (120 Watt, OCuLink @PCIe x4 4.0) AMD Ryzen 7 7840HS 3.8GHz
Radeon RX 7600M XT
59.5 [X] AMD Ryzen 9 7950X 4.5GHz
Radeon RX 7600M XT
59.5 [X] GPD G1 Radeon RX 7600M XT (OCuLink @PCIe x4 4.0) AMD Ryzen 7 7840HS 3.8GHz
Radeon RX 7600M XT
~ 55 fps
+ Vergleich
- Vergleich einklappen
...
...
max:
16.2 [X] GPD G1 Radeon RX 7600M XT (OCuLink @PCIe x4 4.0) AMD Ryzen 7 7840HS 3.8GHz
Radeon RX 7600M XT
17.4 [X] Aoostar GOD77 (GPD G1 Radeon RX 7600M XT @USB4) AMD Ryzen 7 7735HS 3.2GHz
Radeon RX 7600M XT
18.3 [X] GPD G1 Radeon RX 7600M XT (120 Watt, OCuLink @PCIe x4 4.0) AMD Ryzen 7 7840HS 3.8GHz
Radeon RX 7600M XT
19.6 [X] AMD Ryzen 9 7950X 4.5GHz
Radeon RX 7600M XT
26.8 [X] GPD G1 Radeon RX 7600M XT (USB4 @PCIe x4 3.0) AMD Ryzen 7 7840HS 3.8GHz
Radeon RX 7600M XT
~ 20 fps
+ Vergleich
- Vergleich einklappen
...
max:
» In Detailstufe max. mit allen getesteten Notebooks spielbar
Additional Benchmarks
Lowest Preset (DX12) 1280x720
414 [X] AMD Ryzen 9 7950X 4.5GHz
Radeon RX 7600M XT
253 [X] GPD G1 Radeon RX 7600M XT (OCuLink @PCIe x4 4.0) 1050579
AMD Ryzen 7 7840HS 3.8GHz
Radeon RX 7600M XT
219 [X] GPD G1 Radeon RX 7600M XT (USB4 @PCIe x4 3.0) 1050579
AMD Ryzen 7 7840HS 3.8GHz
Radeon RX 7600M XT
279 [X] GPD G1 Radeon RX 7600M XT (120 Watt, OCuLink @PCIe x4 4.0) 1057599
AMD Ryzen 7 7840HS 3.8GHz
Radeon RX 7600M XT
167.3 [X] Aoostar GOD77 (GPD G1 Radeon RX 7600M XT @USB4) AMD Ryzen 7 7735HS 3.2GHz
Radeon RX 7600M XT
...
...
max:
...
...
max:
...
...
max:
...
...
max:
...
...
max:
...
...
max:
» In Detailstufe max. mit allen getesteten Notebooks spielbar
Additional Benchmarks
Low Preset 1280x720
162.3 [X] AMD Ryzen 9 7950X 4.5GHz
Radeon RX 7600M XT
min:
51.9 fps, max:
274 fps
Ray Tracing Ultra Preset (DLSS off) 1920x1080
16.1 [X] AMD Ryzen 9 7950X 4.5GHz
Radeon RX 7600M XT
min:
11.1 fps, max:
26.2 fps
Ray Tracing Ultra Preset (DLSS off) 3840x2160
1.5 [X] AMD Ryzen 9 7950X 4.5GHz
Radeon RX 7600M XT
min:
0.81 fps, max:
3.38 fps
74.9 [X] Aoostar GOD77 (GPD G1 Radeon RX 7600M XT @USB4) 800660
AMD Ryzen 7 7735HS 3.2GHz
Radeon RX 7600M XT
min:
2.57 fps, max:
219 fps
102 [X] GPD G1 Radeon RX 7600M XT (USB4 @PCIe x4 3.0) 800660
AMD Ryzen 7 7840HS 3.8GHz
Radeon RX 7600M XT
min:
41.6 fps, max:
299 fps
174.4 [X] GPD G1 Radeon RX 7600M XT (OCuLink @PCIe x4 4.0) 800660
AMD Ryzen 7 7840HS 3.8GHz
Radeon RX 7600M XT
min:
71.7 fps, max:
361 fps
187.8 [X] GPD G1 Radeon RX 7600M XT (120 Watt, OCuLink @PCIe x4 4.0) 800660
AMD Ryzen 7 7840HS 3.8GHz
Radeon RX 7600M XT
min:
79.2 fps, max:
375 fps
208 [X] 800660
AMD Ryzen 9 7950X 4.5GHz
Radeon RX 7600M XT
min:
69.6 fps, max:
383 fps
~ 149 fps
+ Vergleich
- Vergleich einklappen
...
...
max:
60.2 [X] Aoostar GOD77 (GPD G1 Radeon RX 7600M XT @USB4) 800660
AMD Ryzen 7 7735HS 3.2GHz
Radeon RX 7600M XT
min:
2.52 fps, max:
165.6 fps
82.9 [X] GPD G1 Radeon RX 7600M XT (USB4 @PCIe x4 3.0) 800660
AMD Ryzen 7 7840HS 3.8GHz
Radeon RX 7600M XT
min:
38.7 fps, max:
255 fps
154.3 [X] GPD G1 Radeon RX 7600M XT (OCuLink @PCIe x4 4.0) 800660
AMD Ryzen 7 7840HS 3.8GHz
Radeon RX 7600M XT
min:
65.1 fps, max:
302 fps
157.6 [X] GPD G1 Radeon RX 7600M XT (120 Watt, OCuLink @PCIe x4 4.0) 800660
AMD Ryzen 7 7840HS 3.8GHz
Radeon RX 7600M XT
min:
65.8 fps, max:
343 fps
176.1 [X] 800660
AMD Ryzen 9 7950X 4.5GHz
Radeon RX 7600M XT
min:
78.7 fps, max:
348 fps
~ 126 fps
+ Vergleich
- Vergleich einklappen
...
...
max:
49 [X] Aoostar GOD77 (GPD G1 Radeon RX 7600M XT @USB4) 800660
AMD Ryzen 7 7735HS 3.2GHz
Radeon RX 7600M XT
min:
2.54 fps, max:
106.9 fps
67.4 [X] GPD G1 Radeon RX 7600M XT (USB4 @PCIe x4 3.0) 800660
AMD Ryzen 7 7840HS 3.8GHz
Radeon RX 7600M XT
min:
39.4 fps, max:
124.4 fps
132.3 [X] GPD G1 Radeon RX 7600M XT (120 Watt, OCuLink @PCIe x4 4.0) 800660
AMD Ryzen 7 7840HS 3.8GHz
Radeon RX 7600M XT
min:
64.7 fps, max:
213 fps
136.1 [X] GPD G1 Radeon RX 7600M XT (OCuLink @PCIe x4 4.0) 800660
AMD Ryzen 7 7840HS 3.8GHz
Radeon RX 7600M XT
min:
48.7 fps, max:
274 fps
148.9 [X] 800660
AMD Ryzen 9 7950X 4.5GHz
Radeon RX 7600M XT
min:
58.5 fps, max:
308 fps
~ 107 fps
+ Vergleich
- Vergleich einklappen
...
...
max:
44 [X] Aoostar GOD77 (GPD G1 Radeon RX 7600M XT @USB4) 800660
AMD Ryzen 7 7735HS 3.2GHz
Radeon RX 7600M XT
min:
2.54 fps, max:
103.9 fps
60.7 [X] GPD G1 Radeon RX 7600M XT (USB4 @PCIe x4 3.0) 800660
AMD Ryzen 7 7840HS 3.8GHz
Radeon RX 7600M XT
min:
36.9 fps, max:
99 fps
116.1 [X] GPD G1 Radeon RX 7600M XT (120 Watt, OCuLink @PCIe x4 4.0) 800660
AMD Ryzen 7 7840HS 3.8GHz
Radeon RX 7600M XT
min:
61.6 fps, max:
198.8 fps
121.4 [X] GPD G1 Radeon RX 7600M XT (OCuLink @PCIe x4 4.0) 800660
AMD Ryzen 7 7840HS 3.8GHz
Radeon RX 7600M XT
min:
7.84 fps, max:
193.8 fps
128.9 [X] 800660
AMD Ryzen 9 7950X 4.5GHz
Radeon RX 7600M XT
min:
53 fps, max:
261 fps
~ 94 fps
+ Vergleich
- Vergleich einklappen
...
...
max:
40.9 [X] Aoostar GOD77 (GPD G1 Radeon RX 7600M XT @USB4) 800660
AMD Ryzen 7 7735HS 3.2GHz
Radeon RX 7600M XT
min:
2.48 fps, max:
82 fps
56.2 [X] GPD G1 Radeon RX 7600M XT (USB4 @PCIe x4 3.0) 800660
AMD Ryzen 7 7840HS 3.8GHz
Radeon RX 7600M XT
min:
35.5 fps, max:
114.5 fps
99.7 [X] GPD G1 Radeon RX 7600M XT (120 Watt, OCuLink @PCIe x4 4.0) 800660
AMD Ryzen 7 7840HS 3.8GHz
Radeon RX 7600M XT
min:
60.6 fps, max:
232 fps
105.1 [X] GPD G1 Radeon RX 7600M XT (OCuLink @PCIe x4 4.0) 800660
AMD Ryzen 7 7840HS 3.8GHz
Radeon RX 7600M XT
min:
55.2 fps, max:
203 fps
107.7 [X] 800660
AMD Ryzen 9 7950X 4.5GHz
Radeon RX 7600M XT
min:
49.4 fps, max:
238 fps
~ 82 fps
+ Vergleich
- Vergleich einklappen
...
...
max:
35.3 [X] Aoostar GOD77 (GPD G1 Radeon RX 7600M XT @USB4) 800660
AMD Ryzen 7 7735HS 3.2GHz
Radeon RX 7600M XT
min:
2.46 fps, max:
94.3 fps
44.3 [X] GPD G1 Radeon RX 7600M XT (USB4 @PCIe x4 3.0) 800660
AMD Ryzen 7 7840HS 3.8GHz
Radeon RX 7600M XT
min:
34.2 fps, max:
84.8 fps
59.9 [X] GPD G1 Radeon RX 7600M XT (OCuLink @PCIe x4 4.0) 800660
AMD Ryzen 7 7840HS 3.8GHz
Radeon RX 7600M XT
min:
3.15 fps, max:
116.5 fps
65.2 [X] GPD G1 Radeon RX 7600M XT (120 Watt, OCuLink @PCIe x4 4.0) 800660
AMD Ryzen 7 7840HS 3.8GHz
Radeon RX 7600M XT
min:
49 fps, max:
119.3 fps
67.5 [X] 800660
AMD Ryzen 9 7950X 4.5GHz
Radeon RX 7600M XT
min:
51.7 fps, max:
108.8 fps
~ 54 fps
+ Vergleich
- Vergleich einklappen
max:
» In Detailstufe max. mit allen getesteten Notebooks spielbar
Additional Benchmarks
Low Preset 1280x720
215 [X] AMD Ryzen 9 7950X 4.5GHz
Radeon RX 7600M XT
min:
78.4 fps, max:
417 fps
179.1 [X] GPD G1 Radeon RX 7600M XT (OCuLink @PCIe x4 4.0) 1050579
AMD Ryzen 7 7840HS 3.8GHz
Radeon RX 7600M XT
min:
70.4 fps, max:
370 fps
105.5 [X] GPD G1 Radeon RX 7600M XT (USB4 @PCIe x4 3.0) 1050579
AMD Ryzen 7 7840HS 3.8GHz
Radeon RX 7600M XT
min:
38.9 fps, max:
319 fps
193.9 [X] GPD G1 Radeon RX 7600M XT (120 Watt, OCuLink @PCIe x4 4.0) 1057599
AMD Ryzen 7 7840HS 3.8GHz
Radeon RX 7600M XT
min:
60.1 fps, max:
419 fps
77.9 [X] Aoostar GOD77 (GPD G1 Radeon RX 7600M XT @USB4) AMD Ryzen 7 7735HS 3.2GHz
Radeon RX 7600M XT
min:
2.57 fps, max:
268 fps
76.3 [X] GPD G1 Radeon RX 7600M XT (USB4 @PCIe x4 3.0) AMD Ryzen 7 7840HS 3.8GHz
Radeon RX 7600M XT
min:
55.8 fps, P0.1:
57.1 fps, P1:
61.6 fps, max:
107.3 fps
130.2 [X] GPD G1 Radeon RX 7600M XT (OCuLink @PCIe x4 4.0) AMD Ryzen 7 7840HS 3.8GHz
Radeon RX 7600M XT
min:
32.7 fps, P0.1:
95.2 fps, P1:
103 fps, max:
207 fps
139.2 [X] AMD Ryzen 9 7950X 4.5GHz
Radeon RX 7600M XT
min:
107.8 fps, P0.1:
114.3 fps, P1:
119.4 fps, max:
178.9 fps
~ 115 fps
+ Vergleich
- Vergleich einklappen
+ 📈 Graph
- 📈 Hide Graph
0 100 200 Tooltip : Ø82.6 (67.367-191.2)
: Ø131.9 (107.546-155.3)
: Ø149 (128.761-292.1)
...
max:
76.2 [X] GPD G1 Radeon RX 7600M XT (USB4 @PCIe x4 3.0) AMD Ryzen 7 7840HS 3.8GHz
Radeon RX 7600M XT
min:
58.1 fps, P0.1:
59.5 fps, P1:
62.6 fps, max:
104.5 fps
115.4 [X] AMD Ryzen 9 7950X 4.5GHz
Radeon RX 7600M XT
min:
95.4 fps, P0.1:
96.2 fps, P1:
100.4 fps, max:
141.1 fps
117.6 [X] GPD G1 Radeon RX 7600M XT (OCuLink @PCIe x4 4.0) AMD Ryzen 7 7840HS 3.8GHz
Radeon RX 7600M XT
min:
97.7 fps, P0.1:
99.9 fps, P1:
104.3 fps, max:
163.7 fps
~ 103 fps
+ Vergleich
- Vergleich einklappen
+ 📈 Graph
- 📈 Hide Graph
0 100 Tooltip : Ø79.2 (65.16-120)
: Ø118.5 (106.562-167.9)
: Ø122.6 (109.09-158.8)
...
max:
73.3 [X] GPD G1 Radeon RX 7600M XT (USB4 @PCIe x4 3.0) AMD Ryzen 7 7840HS 3.8GHz
Radeon RX 7600M XT
min:
40.8 fps, P0.1:
52.4 fps, P1:
58.5 fps, max:
105.4 fps
92.6 [X] AMD Ryzen 9 7950X 4.5GHz
Radeon RX 7600M XT
min:
70.8 fps, P0.1:
76.2 fps, P1:
82.1 fps, max:
122.1 fps
95.1 [X] GPD G1 Radeon RX 7600M XT (OCuLink @PCIe x4 4.0) AMD Ryzen 7 7840HS 3.8GHz
Radeon RX 7600M XT
min:
82.1 fps, P0.1:
82.8 fps, P1:
85.7 fps, max:
111.3 fps
~ 87 fps
+ Vergleich
- Vergleich einklappen
+ 📈 Graph
- 📈 Hide Graph
0 100 200 Tooltip : Ø75.9 (60.976-104.2)
: Ø96.2 (87.958-125)
: Ø104.3 (90.762-261.2)
...
max:
62.4 [X] GPD G1 Radeon RX 7600M XT (USB4 @PCIe x4 3.0) AMD Ryzen 7 7840HS 3.8GHz
Radeon RX 7600M XT
min:
22.4 fps, P0.1:
38.2 fps, P1:
43.5 fps, max:
89.8 fps
64.1 [X] AMD Ryzen 9 7950X 4.5GHz
Radeon RX 7600M XT
min:
50.4 fps, P0.1:
52.9 fps, P1:
55.4 fps, max:
79.6 fps
66 [X] GPD G1 Radeon RX 7600M XT (OCuLink @PCIe x4 4.0) AMD Ryzen 7 7840HS 3.8GHz
Radeon RX 7600M XT
min:
54.6 fps, P0.1:
55 fps, P1:
57 fps, max:
82.9 fps
~ 64 fps
+ Vergleich
- Vergleich einklappen
+ 📈 Graph
- 📈 Hide Graph
0 100 200 300 400 500 600 700 800 900 1000 Tooltip : Ø66.5 (53.491-78.1)
: Ø99 (58.66-1022)
: Ø72.4 (57.056-130.8)
...
max:
50.7 [X] GPD G1 Radeon RX 7600M XT (USB4 @PCIe x4 3.0) AMD Ryzen 7 7840HS 3.8GHz
Radeon RX 7600M XT
min:
32.1 fps, P0.1:
33.2 fps, P1:
37 fps, max:
64.8 fps
52 [X] GPD G1 Radeon RX 7600M XT (OCuLink @PCIe x4 4.0) AMD Ryzen 7 7840HS 3.8GHz
Radeon RX 7600M XT
min:
44.6 fps, P0.1:
44.9 fps, P1:
45.7 fps, max:
66.1 fps
52.3 [X] AMD Ryzen 9 7950X 4.5GHz
Radeon RX 7600M XT
min:
44 fps, P0.1:
44.4 fps, P1:
45.4 fps, max:
60.9 fps
~ 52 fps
+ Vergleich
- Vergleich einklappen
+ 📈 Graph
- 📈 Hide Graph
0 Tooltip : Ø53.5 (45.199-89.1)
: Ø54.6 (46.177-71.6)
: Ø55.9 (46.188-98.5)
...
...
max:
32.2 [X] GPD G1 Radeon RX 7600M XT (USB4 @PCIe x4 3.0) AMD Ryzen 7 7840HS 3.8GHz
Radeon RX 7600M XT
min:
26 fps, P0.1:
26.5 fps, P1:
29.2 fps, max:
36.6 fps
33.1 [X] AMD Ryzen 9 7950X 4.5GHz
Radeon RX 7600M XT
min:
29.8 fps, P0.1:
30.3 fps, P1:
30.6 fps, max:
40.2 fps
33.2 [X] GPD G1 Radeon RX 7600M XT (OCuLink @PCIe x4 4.0) AMD Ryzen 7 7840HS 3.8GHz
Radeon RX 7600M XT
min:
29.4 fps, P0.1:
29.6 fps, P1:
30.2 fps, max:
39 fps
~ 33 fps
+ Vergleich
- Vergleich einklappen
+ 📈 Graph
- 📈 Hide Graph
0 100 Tooltip : Ø38 (30.563-134.7)
: Ø41.3 (31.09-137.6)
: Ø35.5 (31.385-46.6)
...
max:
» In Detailstufe max. mit allen getesteten Notebooks spielbar
Additional Benchmarks
Low Preset 1280x720
182 [X] AMD Ryzen 9 7950X 4.5GHz
Radeon RX 7600M XT
min:
18.2 fps, P0.1:
87.1 fps, P1:
119.3 fps, max:
304 fps
131.8 [X] GPD G1 Radeon RX 7600M XT (OCuLink @PCIe x4 4.0) 1050579
AMD Ryzen 7 7840HS 3.8GHz
Radeon RX 7600M XT
min:
88.6 fps, P0.1:
96.5 fps, P1:
104.6 fps, max:
172.3 fps
76.5 [X] GPD G1 Radeon RX 7600M XT (USB4 @PCIe x4 3.0) 1050579
AMD Ryzen 7 7840HS 3.8GHz
Radeon RX 7600M XT
min:
16.7 fps, P0.1:
52.5 fps, P1:
61.9 fps, max:
107.7 fps
0 100 200 300 400 500 600 700 800 900 1000 1100 1200 1300 1400 1500 1600 1700 1800 1900 2000 2100 2200 2300 Tooltip
...
max:
...
max:
...
max:
...
max:
...
max:
...
max:
» In Detailstufe max. mit allen getesteten Notebooks spielbar
Additional Benchmarks
Low Preset 1920x1080
412 [X] AMD Ryzen 9 7950X 4.5GHz
Radeon RX 7600M XT
min:
33.4 fps, P0.1:
190.4 fps, P1:
224 fps, max:
554 fps
...
max:
...
max:
...
max:
...
...
max:
max:
max:
» In Detailstufe max. mit allen getesteten Notebooks spielbar
Additional Benchmarks
Low Preset 1920x1080
213 [X] AMD Ryzen 9 7950X 4.5GHz
Radeon RX 7600M XT
...
max:
...
...
max:
...
...
max:
...
...
max:
...
max:
max:
» In Detailstufe max. mit allen getesteten Notebooks spielbar
Additional Benchmarks
Low Preset 1920x1080
121 [X] AMD Ryzen 9 7950X 4.5GHz
Radeon RX 7600M XT
Ultra Preset + Ultra Ray-Tracing 1920x1080
45 [X] AMD Ryzen 9 7950X 4.5GHz
Radeon RX 7600M XT
99.9 [X] GPD G1 Radeon RX 7600M XT (USB4 @PCIe x4 3.0) AMD Ryzen 7 7840HS 3.8GHz
Radeon RX 7600M XT
min:
76 fps, max:
152 fps
139.3 [X] GPD G1 Radeon RX 7600M XT (OCuLink @PCIe x4 4.0) AMD Ryzen 7 7840HS 3.8GHz
Radeon RX 7600M XT
min:
114 fps, max:
192 fps
187.8 [X] AMD Ryzen 9 7950X 4.5GHz
Radeon RX 7600M XT
min:
143 fps, max:
301 fps
~ 142 fps
+ Vergleich
- Vergleich einklappen
+ 📈 Graph
- 📈 Hide Graph
0 100 200 300 Tooltip : Ø99.9 (76-152)
: Ø139.3 (114-192)
: Ø187.8 (143-301)
...
max:
87.4 [X] GPD G1 Radeon RX 7600M XT (USB4 @PCIe x4 3.0) AMD Ryzen 7 7840HS 3.8GHz
Radeon RX 7600M XT
min:
62 fps, max:
131 fps
122.9 [X] GPD G1 Radeon RX 7600M XT (OCuLink @PCIe x4 4.0) AMD Ryzen 7 7840HS 3.8GHz
Radeon RX 7600M XT
min:
99 fps, max:
156 fps
156.4 [X] AMD Ryzen 9 7950X 4.5GHz
Radeon RX 7600M XT
min:
121 fps, max:
193 fps
~ 122 fps
+ Vergleich
- Vergleich einklappen
+ 📈 Graph
- 📈 Hide Graph
0 100 Tooltip : Ø87.4 (62-131)
: Ø122.9 (99-156)
: Ø156.4 (121-193)
...
max:
74.7 [X] GPD G1 Radeon RX 7600M XT (USB4 @PCIe x4 3.0) AMD Ryzen 7 7840HS 3.8GHz
Radeon RX 7600M XT
min:
50 fps, max:
115 fps
112.8 [X] GPD G1 Radeon RX 7600M XT (OCuLink @PCIe x4 4.0) AMD Ryzen 7 7840HS 3.8GHz
Radeon RX 7600M XT
min:
86 fps, max:
145 fps
135.7 [X] AMD Ryzen 9 7950X 4.5GHz
Radeon RX 7600M XT
min:
104 fps, max:
159 fps
~ 108 fps
+ Vergleich
- Vergleich einklappen
+ 📈 Graph
- 📈 Hide Graph
0 100 Tooltip : Ø74.7 (50-115)
: Ø112.8 (86-145)
: Ø135.7 (104-159)
...
...
max:
58.7 [X] GPD G1 Radeon RX 7600M XT (USB4 @PCIe x4 3.0) AMD Ryzen 7 7840HS 3.8GHz
Radeon RX 7600M XT
min:
41 fps, max:
98 fps
103.1 [X] GPD G1 Radeon RX 7600M XT (OCuLink @PCIe x4 4.0) AMD Ryzen 7 7840HS 3.8GHz
Radeon RX 7600M XT
min:
86 fps, max:
121 fps
103.9 [X] AMD Ryzen 9 7950X 4.5GHz
Radeon RX 7600M XT
min:
74 fps, max:
125 fps
~ 89 fps
+ Vergleich
- Vergleich einklappen
+ 📈 Graph
- 📈 Hide Graph
0 100 Tooltip : Ø58.7 (41-98)
: Ø103.1 (86-121)
: Ø103.9 (74-125)
...
max:
55.2 [X] GPD G1 Radeon RX 7600M XT (USB4 @PCIe x4 3.0) AMD Ryzen 7 7840HS 3.8GHz
Radeon RX 7600M XT
min:
39 fps, max:
71 fps
64.9 [X] AMD Ryzen 9 7950X 4.5GHz
Radeon RX 7600M XT
min:
48 fps, max:
77 fps
71.1 [X] GPD G1 Radeon RX 7600M XT (OCuLink @PCIe x4 4.0) AMD Ryzen 7 7840HS 3.8GHz
Radeon RX 7600M XT
min:
62 fps, max:
79 fps
~ 64 fps
+ Vergleich
- Vergleich einklappen
+ 📈 Graph
- 📈 Hide Graph
0 Tooltip : Ø55.2 (39-71)
: Ø64.9 (48-77)
: Ø71.1 (62-79)
...
...
max:
1 [X] AMD Ryzen 9 7950X 4.5GHz
Radeon RX 7600M XT
max:
2 fps
3.9 [X] GPD G1 Radeon RX 7600M XT (OCuLink @PCIe x4 4.0) AMD Ryzen 7 7840HS 3.8GHz
Radeon RX 7600M XT
min:
3 fps, max:
5 fps
5.5 [X] GPD G1 Radeon RX 7600M XT (USB4 @PCIe x4 3.0) AMD Ryzen 7 7840HS 3.8GHz
Radeon RX 7600M XT
min:
5 fps, max:
6 fps
~ 3 fps
+ Vergleich
- Vergleich einklappen
+ 📈 Graph
- 📈 Hide Graph
0 Tooltip : Ø1 (0-2)
: Ø3.91 (3-5)
: Ø5.5 (5-6)
...
...
max:
» In Detailstufe max. mit allen getesteten Notebooks spielbar
Additional Benchmarks
Low Graphics Quality 1920x1080
176.8 [X] AMD Ryzen 9 7950X 4.5GHz
Radeon RX 7600M XT
min:
136 fps, max:
230 fps
135.3 [X] GPD G1 Radeon RX 7600M XT (OCuLink @PCIe x4 4.0) 1050579
AMD Ryzen 7 7840HS 3.8GHz
Radeon RX 7600M XT
min:
110 fps, max:
171 fps
98.7 [X] GPD G1 Radeon RX 7600M XT (USB4 @PCIe x4 3.0) 1050579
AMD Ryzen 7 7840HS 3.8GHz
Radeon RX 7600M XT
min:
74 fps, max:
148 fps
Ultra Graphics Quality + HD Textures + DXR TAA 1920x1080
4 [X] AMD Ryzen 9 7950X 4.5GHz
Radeon RX 7600M XT
min:
1 fps, max:
5 fps
51.1 [X] GPD G1 Radeon RX 7600M XT (OCuLink @PCIe x4 4.0) 1050579
AMD Ryzen 7 7840HS 3.8GHz
Radeon RX 7600M XT
min:
18 fps, max:
85 fps
34.8 [X] GPD G1 Radeon RX 7600M XT (USB4 @PCIe x4 3.0) 1050579
AMD Ryzen 7 7840HS 3.8GHz
Radeon RX 7600M XT
min:
14 fps, max:
70 fps
129 [X] GPD G1 Radeon RX 7600M XT (USB4 @PCIe x4 3.0) 874931
AMD Ryzen 7 7840HS 3.8GHz
Radeon RX 7600M XT
min:
99 fps, P1:
36 fps, max:
153 fps
187.5 [X] Aoostar GOD77 (GPD G1 Radeon RX 7600M XT @USB4) 874931
AMD Ryzen 7 7735HS 3.2GHz
Radeon RX 7600M XT
min:
140 fps, P1:
123 fps, max:
221 fps
350 [X] GPD G1 Radeon RX 7600M XT (OCuLink @PCIe x4 4.0) 874931
AMD Ryzen 7 7840HS 3.8GHz
Radeon RX 7600M XT
min:
243 fps, P1:
238 fps, max:
413 fps
405 [X] GPD G1 Radeon RX 7600M XT (120 Watt, OCuLink @PCIe x4 4.0) 874931
AMD Ryzen 7 7840HS 3.8GHz
Radeon RX 7600M XT
min:
281 fps, P1:
263 fps, max:
456 fps
512 [X] 874931
AMD Ryzen 9 7950X 4.5GHz
Radeon RX 7600M XT
min:
360 fps, P1:
297 fps, max:
598 fps
~ 317 fps
+ Vergleich
- Vergleich einklappen
...
max:
101 [X] GPD G1 Radeon RX 7600M XT (USB4 @PCIe x4 3.0) 874931
AMD Ryzen 7 7840HS 3.8GHz
Radeon RX 7600M XT
min:
66 fps, P1:
31 fps, max:
124 fps
150.5 [X] Aoostar GOD77 (GPD G1 Radeon RX 7600M XT @USB4) 874931
AMD Ryzen 7 7735HS 3.2GHz
Radeon RX 7600M XT
min:
50 fps, P1:
49 fps, max:
195 fps
315 [X] GPD G1 Radeon RX 7600M XT (OCuLink @PCIe x4 4.0) 874931
AMD Ryzen 7 7840HS 3.8GHz
Radeon RX 7600M XT
min:
209 fps, P1:
213 fps, max:
366 fps
320 [X] GPD G1 Radeon RX 7600M XT (120 Watt, OCuLink @PCIe x4 4.0) 874931
AMD Ryzen 7 7840HS 3.8GHz
Radeon RX 7600M XT
min:
257 fps, P1:
222 fps, max:
374 fps
349 [X] 874931
AMD Ryzen 9 7950X 4.5GHz
Radeon RX 7600M XT
min:
296 fps, P1:
238 fps, max:
411 fps
~ 247 fps
+ Vergleich
- Vergleich einklappen
...
max:
72.9 [X] GPD G1 Radeon RX 7600M XT (USB4 @PCIe x4 3.0) 874931
AMD Ryzen 7 7840HS 3.8GHz
Radeon RX 7600M XT
min:
20 fps, P1:
16 fps, max:
98 fps
98.2 [X] Aoostar GOD77 (GPD G1 Radeon RX 7600M XT @USB4) 874931
AMD Ryzen 7 7735HS 3.2GHz
Radeon RX 7600M XT
min:
29 fps, P1:
17 fps, max:
149 fps
240 [X] GPD G1 Radeon RX 7600M XT (120 Watt, OCuLink @PCIe x4 4.0) 874931
AMD Ryzen 7 7840HS 3.8GHz
Radeon RX 7600M XT
min:
196 fps, P1:
152 fps, max:
273 fps
250 [X] 874931
AMD Ryzen 9 7950X 4.5GHz
Radeon RX 7600M XT
min:
206 fps, P1:
124 fps, max:
293 fps
250 [X] GPD G1 Radeon RX 7600M XT (OCuLink @PCIe x4 4.0) 874931
AMD Ryzen 7 7840HS 3.8GHz
Radeon RX 7600M XT
min:
202 fps, P1:
149 fps, max:
285 fps
~ 182 fps
+ Vergleich
- Vergleich einklappen
...
...
max:
51.3 [X] GPD G1 Radeon RX 7600M XT (USB4 @PCIe x4 3.0) 874931
AMD Ryzen 7 7840HS 3.8GHz
Radeon RX 7600M XT
min:
24 fps, P1:
19 fps, max:
62 fps
69.7 [X] Aoostar GOD77 (GPD G1 Radeon RX 7600M XT @USB4) 874931
AMD Ryzen 7 7735HS 3.2GHz
Radeon RX 7600M XT
min:
48 fps, P1:
33 fps, max:
80 fps
103.8 [X] GPD G1 Radeon RX 7600M XT (120 Watt, OCuLink @PCIe x4 4.0) 874931
AMD Ryzen 7 7840HS 3.8GHz
Radeon RX 7600M XT
min:
86 fps, P1:
84 fps, max:
118 fps
108.1 [X] GPD G1 Radeon RX 7600M XT (OCuLink @PCIe x4 4.0) 874931
AMD Ryzen 7 7840HS 3.8GHz
Radeon RX 7600M XT
min:
90 fps, P1:
87 fps, max:
122 fps
109.2 [X] 874931
AMD Ryzen 9 7950X 4.5GHz
Radeon RX 7600M XT
min:
94 fps, P1:
91 fps, max:
122 fps
~ 88 fps
+ Vergleich
- Vergleich einklappen
...
...
max:
39.7 [X] GPD G1 Radeon RX 7600M XT (USB4 @PCIe x4 3.0) 874931
AMD Ryzen 7 7840HS 3.8GHz
Radeon RX 7600M XT
min:
22 fps, P1:
16 fps, max:
47 fps
59.3 [X] Aoostar GOD77 (GPD G1 Radeon RX 7600M XT @USB4) 874931
AMD Ryzen 7 7735HS 3.2GHz
Radeon RX 7600M XT
min:
16 fps, P1:
26 fps, max:
70 fps
68.7 [X] GPD G1 Radeon RX 7600M XT (OCuLink @PCIe x4 4.0) 874931
AMD Ryzen 7 7840HS 3.8GHz
Radeon RX 7600M XT
min:
52 fps, P1:
51 fps, max:
81 fps
69 [X] 874931
AMD Ryzen 9 7950X 4.5GHz
Radeon RX 7600M XT
min:
42 fps, P1:
43 fps, max:
83 fps
76 [X] GPD G1 Radeon RX 7600M XT (120 Watt, OCuLink @PCIe x4 4.0) 874931
AMD Ryzen 7 7840HS 3.8GHz
Radeon RX 7600M XT
min:
62 fps, P1:
62 fps, max:
85 fps
~ 63 fps
+ Vergleich
- Vergleich einklappen
...
...
max:
12.1 [X] GPD G1 Radeon RX 7600M XT (OCuLink @PCIe x4 4.0) 874931
AMD Ryzen 7 7840HS 3.8GHz
Radeon RX 7600M XT
min:
7 fps, P1:
7 fps, max:
18 fps
21.5 [X] GPD G1 Radeon RX 7600M XT (USB4 @PCIe x4 3.0) 874931
AMD Ryzen 7 7840HS 3.8GHz
Radeon RX 7600M XT
min:
15 fps, P1:
10 fps, max:
26 fps
32.5 [X] 874931
AMD Ryzen 9 7950X 4.5GHz
Radeon RX 7600M XT
min:
25 fps, P1:
24 fps, max:
41 fps
32.9 [X] Aoostar GOD77 (GPD G1 Radeon RX 7600M XT @USB4) 874931
AMD Ryzen 7 7735HS 3.2GHz
Radeon RX 7600M XT
min:
17 fps, P1:
19 fps, max:
39 fps
40.8 [X] GPD G1 Radeon RX 7600M XT (120 Watt, OCuLink @PCIe x4 4.0) 874931
AMD Ryzen 7 7840HS 3.8GHz
Radeon RX 7600M XT
min:
33 fps, P1:
33 fps, max:
48 fps
~ 28 fps
+ Vergleich
- Vergleich einklappen
...
...
max:
» In Detailstufe max. mit allen getesteten Notebooks spielbar
...
max:
...
max:
...
max:
...
max:
...
max:
...
...
max:
» In Detailstufe max. mit allen getesteten Notebooks spielbar
...
...
max:
...
...
max:
...
...
max:
...
...
max:
...
...
max:
...
max:
» In Detailstufe max. mit allen getesteten Notebooks spielbar
...
max:
...
max:
...
max:
...
...
max:
...
...
max:
...
max:
» In Detailstufe max. mit allen getesteten Notebooks spielbar
Additional Benchmarks
Ultra Preset + Ultra Ray Tracing (DX12) 1920x1080
8 [X] AMD Ryzen 9 7950X 4.5GHz
Radeon RX 7600M XT
min:
4 fps, P0.1:
4 fps, P1:
5 fps, max:
12 fps
...
max:
...
...
max:
...
max:
...
max:
76 [X] Tuxedo Sirius 16 Gen 1 AMD Ryzen 7 7840HS 3.8GHz
Radeon RX 7600M XT
min:
31 fps, max:
154 fps
79 [X] AMD Ryzen 9 7950X 4.5GHz
Radeon RX 7600M XT
min:
54 fps, max:
134 fps
~ 78 fps
+ Vergleich
- Vergleich einklappen
...
max:
...
max:
» In Detailstufe max. mit allen getesteten Notebooks spielbar
Additional Benchmarks
Ultimate Quality FidelityFX Quality 3840x2160
68 [X] AMD Ryzen 9 7950X 4.5GHz
Radeon RX 7600M XT
min:
47 fps, max:
113 fps
...
max:
...
...
max:
...
...
max:
...
...
max:
...
max:
...
max:
» In Detailstufe max. mit allen getesteten Notebooks spielbar
140 [X] GPD G1 Radeon RX 7600M XT (USB4 @PCIe x4 3.0) 759689
AMD Ryzen 7 7840HS 3.8GHz
Radeon RX 7600M XT
min:
109 fps, max:
161 fps
246 [X] Aoostar GOD77 (GPD G1 Radeon RX 7600M XT @USB4) 759689
AMD Ryzen 7 7735HS 3.2GHz
Radeon RX 7600M XT
min:
206 fps, max:
282 fps
349 [X] GPD G1 Radeon RX 7600M XT (OCuLink @PCIe x4 4.0) 759689
AMD Ryzen 7 7840HS 3.8GHz
Radeon RX 7600M XT
min:
283 fps, max:
384 fps
373 [X] GPD G1 Radeon RX 7600M XT (120 Watt, OCuLink @PCIe x4 4.0) 759689
AMD Ryzen 7 7840HS 3.8GHz
Radeon RX 7600M XT
min:
307 fps, max:
412 fps
448 [X] 759689
AMD Ryzen 9 7950X 4.5GHz
Radeon RX 7600M XT
min:
389 fps, max:
529 fps
~ 311 fps
+ Vergleich
- Vergleich einklappen
...
max:
100.8 [X] GPD G1 Radeon RX 7600M XT (USB4 @PCIe x4 3.0) 759689
AMD Ryzen 7 7840HS 3.8GHz
Radeon RX 7600M XT
min:
82 fps, max:
119 fps
162.3 [X] Aoostar GOD77 (GPD G1 Radeon RX 7600M XT @USB4) 759689
AMD Ryzen 7 7735HS 3.2GHz
Radeon RX 7600M XT
min:
137 fps, max:
186 fps
246 [X] 759689
AMD Ryzen 9 7950X 4.5GHz
Radeon RX 7600M XT
min:
199 fps, max:
292 fps
263 [X] GPD G1 Radeon RX 7600M XT (OCuLink @PCIe x4 4.0) 759689
AMD Ryzen 7 7840HS 3.8GHz
Radeon RX 7600M XT
min:
219 fps, max:
311 fps
267 [X] GPD G1 Radeon RX 7600M XT (120 Watt, OCuLink @PCIe x4 4.0) 759689
AMD Ryzen 7 7840HS 3.8GHz
Radeon RX 7600M XT
min:
223 fps, max:
310 fps
~ 208 fps
+ Vergleich
- Vergleich einklappen
...
max:
87.4 [X] GPD G1 Radeon RX 7600M XT (USB4 @PCIe x4 3.0) 759689
AMD Ryzen 7 7840HS 3.8GHz
Radeon RX 7600M XT
min:
72 fps, max:
100 fps
139.1 [X] Aoostar GOD77 (GPD G1 Radeon RX 7600M XT @USB4) 759689
AMD Ryzen 7 7735HS 3.2GHz
Radeon RX 7600M XT
min:
116 fps, max:
162 fps
196 [X] 759689
AMD Ryzen 9 7950X 4.5GHz
Radeon RX 7600M XT
min:
171 fps, max:
229 fps
215 [X] GPD G1 Radeon RX 7600M XT (OCuLink @PCIe x4 4.0) 759689
AMD Ryzen 7 7840HS 3.8GHz
Radeon RX 7600M XT
min:
176 fps, max:
252 fps
216 [X] GPD G1 Radeon RX 7600M XT (120 Watt, OCuLink @PCIe x4 4.0) 759689
AMD Ryzen 7 7840HS 3.8GHz
Radeon RX 7600M XT
min:
182 fps, max:
253 fps
~ 171 fps
+ Vergleich
- Vergleich einklappen
...
...
max:
63.9 [X] GPD G1 Radeon RX 7600M XT (USB4 @PCIe x4 3.0) 759689
AMD Ryzen 7 7840HS 3.8GHz
Radeon RX 7600M XT
min:
50 fps, max:
77 fps
98 [X] Aoostar GOD77 (GPD G1 Radeon RX 7600M XT @USB4) 759689
AMD Ryzen 7 7735HS 3.2GHz
Radeon RX 7600M XT
min:
73 fps, max:
123 fps
134.4 [X] 759689
AMD Ryzen 9 7950X 4.5GHz
Radeon RX 7600M XT
min:
100 fps, max:
168 fps
145.7 [X] GPD G1 Radeon RX 7600M XT (OCuLink @PCIe x4 4.0) 759689
AMD Ryzen 7 7840HS 3.8GHz
Radeon RX 7600M XT
min:
108 fps, max:
183 fps
147.9 [X] GPD G1 Radeon RX 7600M XT (120 Watt, OCuLink @PCIe x4 4.0) 759689
AMD Ryzen 7 7840HS 3.8GHz
Radeon RX 7600M XT
min:
109 fps, max:
187 fps
~ 118 fps
+ Vergleich
- Vergleich einklappen
...
...
max:
52.3 [X] GPD G1 Radeon RX 7600M XT (USB4 @PCIe x4 3.0) 759689
AMD Ryzen 7 7840HS 3.8GHz
Radeon RX 7600M XT
min:
40 fps, max:
62 fps
80.2 [X] Aoostar GOD77 (GPD G1 Radeon RX 7600M XT @USB4) 759689
AMD Ryzen 7 7735HS 3.2GHz
Radeon RX 7600M XT
min:
61 fps, max:
98 fps
102.2 [X] 759689
AMD Ryzen 9 7950X 4.5GHz
Radeon RX 7600M XT
min:
80 fps, max:
125 fps
109.1 [X] GPD G1 Radeon RX 7600M XT (OCuLink @PCIe x4 4.0) 759689
AMD Ryzen 7 7840HS 3.8GHz
Radeon RX 7600M XT
min:
84 fps, max:
132 fps
111.1 [X] GPD G1 Radeon RX 7600M XT (120 Watt, OCuLink @PCIe x4 4.0) 759689
AMD Ryzen 7 7840HS 3.8GHz
Radeon RX 7600M XT
min:
86 fps, max:
134 fps
~ 91 fps
+ Vergleich
- Vergleich einklappen
...
max:
31.3 [X] GPD G1 Radeon RX 7600M XT (USB4 @PCIe x4 3.0) 759689
AMD Ryzen 7 7840HS 3.8GHz
Radeon RX 7600M XT
min:
23 fps, max:
38 fps
52 [X] Aoostar GOD77 (GPD G1 Radeon RX 7600M XT @USB4) 759689
AMD Ryzen 7 7735HS 3.2GHz
Radeon RX 7600M XT
min:
41 fps, max:
63 fps
60 [X] 759689
AMD Ryzen 9 7950X 4.5GHz
Radeon RX 7600M XT
min:
48 fps, max:
72 fps
61.6 [X] GPD G1 Radeon RX 7600M XT (OCuLink @PCIe x4 4.0) 759689
AMD Ryzen 7 7840HS 3.8GHz
Radeon RX 7600M XT
min:
49 fps, max:
74 fps
63.7 [X] GPD G1 Radeon RX 7600M XT (120 Watt, OCuLink @PCIe x4 4.0) 759689
AMD Ryzen 7 7840HS 3.8GHz
Radeon RX 7600M XT
min:
52 fps, max:
77 fps
~ 54 fps
+ Vergleich
- Vergleich einklappen
...
max:
» In Detailstufe max. mit allen getesteten Notebooks spielbar
86.7 [X] Aoostar GOD77 (GPD G1 Radeon RX 7600M XT @USB4) AMD Ryzen 7 7735HS 3.2GHz
Radeon RX 7600M XT
107 [X] GPD G1 Radeon RX 7600M XT (USB4 @PCIe x4 3.0) AMD Ryzen 7 7840HS 3.8GHz
Radeon RX 7600M XT
124 [X] GPD G1 Radeon RX 7600M XT (OCuLink @PCIe x4 4.0) AMD Ryzen 7 7840HS 3.8GHz
Radeon RX 7600M XT
131.8 [X] GPD G1 Radeon RX 7600M XT (120 Watt, OCuLink @PCIe x4 4.0) AMD Ryzen 7 7840HS 3.8GHz
Radeon RX 7600M XT
225 [X] AMD Ryzen 9 7950X 4.5GHz
Radeon RX 7600M XT
~ 135 fps
+ Vergleich
- Vergleich einklappen
...
...
max:
73.9 [X] Aoostar GOD77 (GPD G1 Radeon RX 7600M XT @USB4) AMD Ryzen 7 7735HS 3.2GHz
Radeon RX 7600M XT
94.2 [X] GPD G1 Radeon RX 7600M XT (USB4 @PCIe x4 3.0) AMD Ryzen 7 7840HS 3.8GHz
Radeon RX 7600M XT
109.2 [X] GPD G1 Radeon RX 7600M XT (OCuLink @PCIe x4 4.0) AMD Ryzen 7 7840HS 3.8GHz
Radeon RX 7600M XT
113.8 [X] GPD G1 Radeon RX 7600M XT (120 Watt, OCuLink @PCIe x4 4.0) AMD Ryzen 7 7840HS 3.8GHz
Radeon RX 7600M XT
162.4 [X] AMD Ryzen 9 7950X 4.5GHz
Radeon RX 7600M XT
~ 111 fps
+ Vergleich
- Vergleich einklappen
...
...
max:
67.1 [X] Aoostar GOD77 (GPD G1 Radeon RX 7600M XT @USB4) AMD Ryzen 7 7735HS 3.2GHz
Radeon RX 7600M XT
84.9 [X] GPD G1 Radeon RX 7600M XT (USB4 @PCIe x4 3.0) AMD Ryzen 7 7840HS 3.8GHz
Radeon RX 7600M XT
95.5 [X] GPD G1 Radeon RX 7600M XT (OCuLink @PCIe x4 4.0) AMD Ryzen 7 7840HS 3.8GHz
Radeon RX 7600M XT
101.7 [X] GPD G1 Radeon RX 7600M XT (120 Watt, OCuLink @PCIe x4 4.0) AMD Ryzen 7 7840HS 3.8GHz
Radeon RX 7600M XT
110.5 [X] AMD Ryzen 9 7950X 4.5GHz
Radeon RX 7600M XT
~ 92 fps
+ Vergleich
- Vergleich einklappen
...
...
max:
62.5 [X] Aoostar GOD77 (GPD G1 Radeon RX 7600M XT @USB4) AMD Ryzen 7 7735HS 3.2GHz
Radeon RX 7600M XT
76.2 [X] GPD G1 Radeon RX 7600M XT (USB4 @PCIe x4 3.0) AMD Ryzen 7 7840HS 3.8GHz
Radeon RX 7600M XT
81.5 [X] GPD G1 Radeon RX 7600M XT (OCuLink @PCIe x4 4.0) AMD Ryzen 7 7840HS 3.8GHz
Radeon RX 7600M XT
85 [X] AMD Ryzen 9 7950X 4.5GHz
Radeon RX 7600M XT
85.1 [X] GPD G1 Radeon RX 7600M XT (120 Watt, OCuLink @PCIe x4 4.0) AMD Ryzen 7 7840HS 3.8GHz
Radeon RX 7600M XT
~ 78 fps
+ Vergleich
- Vergleich einklappen
...
...
max:
55.5 [X] Aoostar GOD77 (GPD G1 Radeon RX 7600M XT @USB4) AMD Ryzen 7 7735HS 3.2GHz
Radeon RX 7600M XT
57.7 [X] GPD G1 Radeon RX 7600M XT (USB4 @PCIe x4 3.0) AMD Ryzen 7 7840HS 3.8GHz
Radeon RX 7600M XT
58.1 [X] AMD Ryzen 9 7950X 4.5GHz
Radeon RX 7600M XT
58.3 [X] GPD G1 Radeon RX 7600M XT (OCuLink @PCIe x4 4.0) AMD Ryzen 7 7840HS 3.8GHz
Radeon RX 7600M XT
60.4 [X] GPD G1 Radeon RX 7600M XT (120 Watt, OCuLink @PCIe x4 4.0) AMD Ryzen 7 7840HS 3.8GHz
Radeon RX 7600M XT
~ 58 fps
+ Vergleich
- Vergleich einklappen
...
...
max:
30.7 [X] AMD Ryzen 9 7950X 4.5GHz
Radeon RX 7600M XT
30.7 [X] GPD G1 Radeon RX 7600M XT (USB4 @PCIe x4 3.0) AMD Ryzen 7 7840HS 3.8GHz
Radeon RX 7600M XT
30.8 [X] GPD G1 Radeon RX 7600M XT (OCuLink @PCIe x4 4.0) AMD Ryzen 7 7840HS 3.8GHz
Radeon RX 7600M XT
31.5 [X] Aoostar GOD77 (GPD G1 Radeon RX 7600M XT @USB4) AMD Ryzen 7 7735HS 3.2GHz
Radeon RX 7600M XT
31.8 [X] GPD G1 Radeon RX 7600M XT (120 Watt, OCuLink @PCIe x4 4.0) AMD Ryzen 7 7840HS 3.8GHz
Radeon RX 7600M XT
~ 31 fps
+ Vergleich
- Vergleich einklappen
...
...
max:
» In Detailstufe max. mit allen getesteten Notebooks spielbar
Additional Benchmarks
Very Low Overall Quality (DX11) 1920x1080
221 [X] AMD Ryzen 9 7950X 4.5GHz
Radeon RX 7600M XT
120 [X] GPD G1 Radeon RX 7600M XT (OCuLink @PCIe x4 4.0) 1050579
AMD Ryzen 7 7840HS 3.8GHz
Radeon RX 7600M XT
107.7 [X] GPD G1 Radeon RX 7600M XT (USB4 @PCIe x4 3.0) 1050579
AMD Ryzen 7 7840HS 3.8GHz
Radeon RX 7600M XT
129.2 [X] GPD G1 Radeon RX 7600M XT (120 Watt, OCuLink @PCIe x4 4.0) 1057599
AMD Ryzen 7 7840HS 3.8GHz
Radeon RX 7600M XT
84.9 [X] Aoostar GOD77 (GPD G1 Radeon RX 7600M XT @USB4) AMD Ryzen 7 7735HS 3.2GHz
Radeon RX 7600M XT
...
...
max:
...
...
max:
...
...
max:
...
max:
...
max:
» In Detailstufe hoch mit allen getesteten Notebooks spielbar
Additional Benchmarks
High Quality Preset & High Ray Tracing Preset (DX12) 1920x1080
45.6 [X] AMD Ryzen 9 7950X 4.5GHz
Radeon RX 7600M XT
min:
15.6 fps, P0.1:
28.5 fps, P1:
38.3 fps, max:
95.6 fps
High Quality Preset & High Ray Tracing Preset (DX12) 3840x2160
2.6 [X] AMD Ryzen 9 7950X 4.5GHz
Radeon RX 7600M XT
min:
2.09 fps, P0.1:
2.1 fps, P1:
2.11 fps, max:
3.51 fps
...
max:
...
max:
...
max:
...
max:
...
max:
...
max:
» In Detailstufe max. mit allen getesteten Notebooks spielbar
...
max:
...
max:
...
max:
...
max:
...
max:
...
...
max:
» In Detailstufe max. mit allen getesteten Notebooks spielbar
91 [X] Aoostar GOD77 (GPD G1 Radeon RX 7600M XT @USB4) AMD Ryzen 7 7735HS 3.2GHz
Radeon RX 7600M XT
min:
63 fps, max:
130 fps
111 [X] GPD G1 Radeon RX 7600M XT (USB4 @PCIe x4 3.0) AMD Ryzen 7 7840HS 3.8GHz
Radeon RX 7600M XT
min:
85 fps, max:
159 fps
122 [X] GPD G1 Radeon RX 7600M XT (OCuLink @PCIe x4 4.0) AMD Ryzen 7 7840HS 3.8GHz
Radeon RX 7600M XT
min:
94 fps, max:
178 fps
127 [X] GPD G1 Radeon RX 7600M XT (120 Watt, OCuLink @PCIe x4 4.0) AMD Ryzen 7 7840HS 3.8GHz
Radeon RX 7600M XT
min:
93 fps, max:
175 fps
158 [X] AMD Ryzen 9 7950X 4.5GHz
Radeon RX 7600M XT
min:
99 fps, max:
236 fps
~ 122 fps
+ Vergleich
- Vergleich einklappen
+ 📈 Graph
- 📈 Hide Graph
0 100 200 Tooltip : Ø91 (63-130)
: Ø111.2 (85-159)
: Ø121.7 (94-178)
: Ø127.1 (93-175)
: Ø157.5 (99-236)
...
max:
68 [X] Aoostar GOD77 (GPD G1 Radeon RX 7600M XT @USB4) AMD Ryzen 7 7735HS 3.2GHz
Radeon RX 7600M XT
min:
49 fps, max:
107 fps
82 [X] GPD G1 Radeon RX 7600M XT (USB4 @PCIe x4 3.0) AMD Ryzen 7 7840HS 3.8GHz
Radeon RX 7600M XT
min:
60 fps, max:
130 fps
108 [X] GPD G1 Radeon RX 7600M XT (OCuLink @PCIe x4 4.0) AMD Ryzen 7 7840HS 3.8GHz
Radeon RX 7600M XT
min:
85 fps, max:
158 fps
109 [X] GPD G1 Radeon RX 7600M XT (120 Watt, OCuLink @PCIe x4 4.0) AMD Ryzen 7 7840HS 3.8GHz
Radeon RX 7600M XT
min:
85 fps, max:
162 fps
141 [X] AMD Ryzen 9 7950X 4.5GHz
Radeon RX 7600M XT
min:
107 fps, max:
216 fps
~ 102 fps
+ Vergleich
- Vergleich einklappen
+ 📈 Graph
- 📈 Hide Graph
0 100 200 Tooltip : Ø67.7 (49-107)
: Ø82.1 (60-130)
: Ø107.6 (85-158)
: Ø109.1 (85-162)
: Ø141.3 (107-216)
...
...
max:
63 [X] Aoostar GOD77 (GPD G1 Radeon RX 7600M XT @USB4) AMD Ryzen 7 7735HS 3.2GHz
Radeon RX 7600M XT
min:
46 fps, max:
96 fps
75 [X] GPD G1 Radeon RX 7600M XT (USB4 @PCIe x4 3.0) AMD Ryzen 7 7840HS 3.8GHz
Radeon RX 7600M XT
min:
54 fps, max:
118 fps
105 [X] GPD G1 Radeon RX 7600M XT (OCuLink @PCIe x4 4.0) AMD Ryzen 7 7840HS 3.8GHz
Radeon RX 7600M XT
min:
82 fps, max:
154 fps
106 [X] GPD G1 Radeon RX 7600M XT (120 Watt, OCuLink @PCIe x4 4.0) AMD Ryzen 7 7840HS 3.8GHz
Radeon RX 7600M XT
min:
83 fps, max:
155 fps
137 [X] AMD Ryzen 9 7950X 4.5GHz
Radeon RX 7600M XT
min:
105 fps, max:
202 fps
~ 97 fps
+ Vergleich
- Vergleich einklappen
+ 📈 Graph
- 📈 Hide Graph
0 100 200 Tooltip : Ø62.7 (46-96)
: Ø75.5 (54-118)
: Ø104.8 (82-154)
: Ø105.6 (83-155)
: Ø137.2 (105-202)
...
...
max:
51 [X] Aoostar GOD77 (GPD G1 Radeon RX 7600M XT @USB4) AMD Ryzen 7 7735HS 3.2GHz
Radeon RX 7600M XT
min:
34 fps, max:
89 fps
68 [X] GPD G1 Radeon RX 7600M XT (USB4 @PCIe x4 3.0) AMD Ryzen 7 7840HS 3.8GHz
Radeon RX 7600M XT
min:
47 fps, max:
113 fps
94 [X] GPD G1 Radeon RX 7600M XT (OCuLink @PCIe x4 4.0) AMD Ryzen 7 7840HS 3.8GHz
Radeon RX 7600M XT
min:
68 fps, max:
149 fps
96 [X] GPD G1 Radeon RX 7600M XT (120 Watt, OCuLink @PCIe x4 4.0) AMD Ryzen 7 7840HS 3.8GHz
Radeon RX 7600M XT
min:
68 fps, max:
150 fps
122 [X] AMD Ryzen 9 7950X 4.5GHz
Radeon RX 7600M XT
min:
86 fps, max:
192 fps
~ 86 fps
+ Vergleich
- Vergleich einklappen
+ 📈 Graph
- 📈 Hide Graph
0 100 Tooltip : Ø50.6 (34-89)
: Ø68 (47-113)
: Ø94.1 (68-149)
: Ø96 (68-150)
: Ø121.7 (86-192)
...
...
max:
50 [X] Aoostar GOD77 (GPD G1 Radeon RX 7600M XT @USB4) AMD Ryzen 7 7735HS 3.2GHz
Radeon RX 7600M XT
min:
34 fps, max:
88 fps
68 [X] GPD G1 Radeon RX 7600M XT (USB4 @PCIe x4 3.0) AMD Ryzen 7 7840HS 3.8GHz
Radeon RX 7600M XT
min:
48 fps, max:
113 fps
91 [X] GPD G1 Radeon RX 7600M XT (OCuLink @PCIe x4 4.0) AMD Ryzen 7 7840HS 3.8GHz
Radeon RX 7600M XT
min:
66 fps, max:
136 fps
92 [X] GPD G1 Radeon RX 7600M XT (120 Watt, OCuLink @PCIe x4 4.0) AMD Ryzen 7 7840HS 3.8GHz
Radeon RX 7600M XT
min:
67 fps, max:
139 fps
105 [X] AMD Ryzen 9 7950X 4.5GHz
Radeon RX 7600M XT
min:
84 fps, max:
143 fps
~ 81 fps
+ Vergleich
- Vergleich einklappen
+ 📈 Graph
- 📈 Hide Graph
0 100 Tooltip : Ø50.4 (34-88)
: Ø68.1 (48-113)
: Ø90.7 (66-136)
: Ø92.2 (67-139)
: Ø104.8 (84-143)
...
...
max:
46 [X] Aoostar GOD77 (GPD G1 Radeon RX 7600M XT @USB4) AMD Ryzen 7 7735HS 3.2GHz
Radeon RX 7600M XT
min:
34 fps, max:
73 fps
53 [X] GPD G1 Radeon RX 7600M XT (USB4 @PCIe x4 3.0) AMD Ryzen 7 7840HS 3.8GHz
Radeon RX 7600M XT
min:
44 fps, max:
72 fps
56 [X] AMD Ryzen 9 7950X 4.5GHz
Radeon RX 7600M XT
min:
45 fps, max:
73 fps
56 [X] GPD G1 Radeon RX 7600M XT (OCuLink @PCIe x4 4.0) AMD Ryzen 7 7840HS 3.8GHz
Radeon RX 7600M XT
min:
46 fps, max:
74 fps
57 [X] GPD G1 Radeon RX 7600M XT (120 Watt, OCuLink @PCIe x4 4.0) AMD Ryzen 7 7840HS 3.8GHz
Radeon RX 7600M XT
min:
46 fps, max:
75 fps
~ 54 fps
+ Vergleich
- Vergleich einklappen
+ 📈 Graph
- 📈 Hide Graph
0 Tooltip : Ø46.3 (34-73)
: Ø52.9 (44-72)
: Ø55.6 (45-73)
: Ø56.1 (46-74)
: Ø56.6 (46-75)
...
max:
» In Detailstufe max. mit allen getesteten Notebooks spielbar
66.8 [X] GPD G1 Radeon RX 7600M XT (USB4 @PCIe x4 3.0) AMD Ryzen 7 7840HS 3.8GHz
Radeon RX 7600M XT
min:
31.41 fps, max:
115.59 fps
149.6 [X] GPD G1 Radeon RX 7600M XT (OCuLink @PCIe x4 4.0) AMD Ryzen 7 7840HS 3.8GHz
Radeon RX 7600M XT
min:
85.31 fps, max:
240.5 fps
236 [X] AMD Ryzen 9 7950X 4.5GHz
Radeon RX 7600M XT
min:
120.77 fps, max:
399.84 fps
387 [X] GPD G1 Radeon RX 7600M XT (120 Watt, OCuLink @PCIe x4 4.0) AMD Ryzen 7 7840HS 3.8GHz
Radeon RX 7600M XT
min:
284.25 fps, max:
499.25 fps
~ 210 fps
+ Vergleich
- Vergleich einklappen
...
max:
25.9 [X] GPD G1 Radeon RX 7600M XT (USB4 @PCIe x4 3.0) AMD Ryzen 7 7840HS 3.8GHz
Radeon RX 7600M XT
min:
18.05 fps, max:
31.94 fps
99.4 [X] GPD G1 Radeon RX 7600M XT (OCuLink @PCIe x4 4.0) AMD Ryzen 7 7840HS 3.8GHz
Radeon RX 7600M XT
min:
54.6 fps, max:
138.08 fps
124.7 [X] GPD G1 Radeon RX 7600M XT (120 Watt, OCuLink @PCIe x4 4.0) AMD Ryzen 7 7840HS 3.8GHz
Radeon RX 7600M XT
min:
62.04 fps, max:
175.25 fps
130 [X] AMD Ryzen 9 7950X 4.5GHz
Radeon RX 7600M XT
min:
66.76 fps, max:
192.86 fps
~ 95 fps
+ Vergleich
- Vergleich einklappen
...
...
max:
29.8 [X] GPD G1 Radeon RX 7600M XT (USB4 @PCIe x4 3.0) AMD Ryzen 7 7840HS 3.8GHz
Radeon RX 7600M XT
min:
19.08 fps, max:
37.94 fps
90 [X] GPD G1 Radeon RX 7600M XT (OCuLink @PCIe x4 4.0) AMD Ryzen 7 7840HS 3.8GHz
Radeon RX 7600M XT
min:
47.78 fps, max:
132.61 fps
95.4 [X] AMD Ryzen 9 7950X 4.5GHz
Radeon RX 7600M XT
min:
50.56 fps, max:
145.03 fps
98.3 [X] GPD G1 Radeon RX 7600M XT (120 Watt, OCuLink @PCIe x4 4.0) AMD Ryzen 7 7840HS 3.8GHz
Radeon RX 7600M XT
min:
50.57 fps, max:
149.9 fps
~ 78 fps
+ Vergleich
- Vergleich einklappen
...
...
max:
28.2 [X] GPD G1 Radeon RX 7600M XT (USB4 @PCIe x4 3.0) AMD Ryzen 7 7840HS 3.8GHz
Radeon RX 7600M XT
min:
17.22 fps, max:
38.89 fps
73 [X] GPD G1 Radeon RX 7600M XT (OCuLink @PCIe x4 4.0) AMD Ryzen 7 7840HS 3.8GHz
Radeon RX 7600M XT
min:
42.92 fps, max:
104.48 fps
74.2 [X] AMD Ryzen 9 7950X 4.5GHz
Radeon RX 7600M XT
min:
43.1 fps, max:
113.49 fps
76.1 [X] GPD G1 Radeon RX 7600M XT (120 Watt, OCuLink @PCIe x4 4.0) AMD Ryzen 7 7840HS 3.8GHz
Radeon RX 7600M XT
min:
44.05 fps, max:
114.73 fps
~ 63 fps
+ Vergleich
- Vergleich einklappen
...
...
max:
19.2 [X] GPD G1 Radeon RX 7600M XT (USB4 @PCIe x4 3.0) AMD Ryzen 7 7840HS 3.8GHz
Radeon RX 7600M XT
min:
13.43 fps, max:
23.39 fps
57.7 [X] GPD G1 Radeon RX 7600M XT (OCuLink @PCIe x4 4.0) AMD Ryzen 7 7840HS 3.8GHz
Radeon RX 7600M XT
min:
35.68 fps, max:
82.49 fps
57.9 [X] AMD Ryzen 9 7950X 4.5GHz
Radeon RX 7600M XT
min:
35.68 fps, max:
83.35 fps
59.7 [X] GPD G1 Radeon RX 7600M XT (120 Watt, OCuLink @PCIe x4 4.0) AMD Ryzen 7 7840HS 3.8GHz
Radeon RX 7600M XT
min:
36.39 fps, max:
84.53 fps
~ 49 fps
+ Vergleich
- Vergleich einklappen
...
...
max:
10.5 [X] GPD G1 Radeon RX 7600M XT (USB4 @PCIe x4 3.0) AMD Ryzen 7 7840HS 3.8GHz
Radeon RX 7600M XT
min:
8.58 fps, max:
11.47 fps
34.4 [X] GPD G1 Radeon RX 7600M XT (OCuLink @PCIe x4 4.0) AMD Ryzen 7 7840HS 3.8GHz
Radeon RX 7600M XT
min:
22.95 fps, max:
44.24 fps
34.6 [X] AMD Ryzen 9 7950X 4.5GHz
Radeon RX 7600M XT
min:
23.04 fps, max:
44.6 fps
35.7 [X] GPD G1 Radeon RX 7600M XT (120 Watt, OCuLink @PCIe x4 4.0) AMD Ryzen 7 7840HS 3.8GHz
Radeon RX 7600M XT
min:
23.57 fps, max:
45.48 fps
~ 29 fps
+ Vergleich
- Vergleich einklappen
...
...
max:
» In Detailstufe max. mit den meisten getesteten Laptops spielbar
Additional Benchmarks
Ultra Quality DXR 16xAF 1920x1080
55.7 [X] AMD Ryzen 9 7950X 4.5GHz
Radeon RX 7600M XT
min:
35.22 fps, max:
71.86 fps
...
...
...
...
...
max:
0 100 200 300 400 500 600 700 800 900 1000 1100 1200 1300 1400 1500 1600 1700 1800 1900 2000 2100 2200 2300 2400 2500 2600 2700 2800 2900 3000 3100 3200 3300 3400 3500 3600 3700 3800 3900 4000 4100 4200 4300 4400 4500 4600 4700 4800 4900 5000 5100 5200 Tooltip
...
max:
» In Detailstufe max. mit allen getesteten Notebooks spielbar
...
max:
...
max:
...
max:
...
max:
...
max:
...
...
max:
» In Detailstufe max. mit allen getesteten Notebooks spielbar
...
max:
...
max:
...
max:
...
max:
...
max:
...
max:
» In Detailstufe max. mit allen getesteten Notebooks spielbar
133.2 [X] Aoostar GOD77 (GPD G1 Radeon RX 7600M XT @USB4) AMD Ryzen 7 7735HS 3.2GHz
Radeon RX 7600M XT
max:
223.9 fps
180.2 [X] GPD G1 Radeon RX 7600M XT (USB4 @PCIe x4 3.0) AMD Ryzen 7 7840HS 3.8GHz
Radeon RX 7600M XT
max:
268 fps
196.4 [X] GPD G1 Radeon RX 7600M XT (120 Watt, OCuLink @PCIe x4 4.0) AMD Ryzen 7 7840HS 3.8GHz
Radeon RX 7600M XT
max:
271.7 fps
197.2 [X] GPD G1 Radeon RX 7600M XT (OCuLink @PCIe x4 4.0) AMD Ryzen 7 7840HS 3.8GHz
Radeon RX 7600M XT
max:
278.1 fps
317 [X] AMD Ryzen 9 7950X 4.5GHz
Radeon RX 7600M XT
max:
493.1 fps
~ 205 fps
+ Vergleich
- Vergleich einklappen
...
max:
108.5 [X] Aoostar GOD77 (GPD G1 Radeon RX 7600M XT @USB4) AMD Ryzen 7 7735HS 3.2GHz
Radeon RX 7600M XT
max:
205.1 fps
126 [X] GPD G1 Radeon RX 7600M XT (USB4 @PCIe x4 3.0) AMD Ryzen 7 7840HS 3.8GHz
Radeon RX 7600M XT
max:
237.2 fps
152.9 [X] GPD G1 Radeon RX 7600M XT (120 Watt, OCuLink @PCIe x4 4.0) AMD Ryzen 7 7840HS 3.8GHz
Radeon RX 7600M XT
max:
249.4 fps
154.8 [X] GPD G1 Radeon RX 7600M XT (OCuLink @PCIe x4 4.0) AMD Ryzen 7 7840HS 3.8GHz
Radeon RX 7600M XT
max:
241.1 fps
159.2 [X] AMD Ryzen 9 7950X 4.5GHz
Radeon RX 7600M XT
max:
267.7 fps
~ 140 fps
+ Vergleich
- Vergleich einklappen
...
max:
104.6 [X] Aoostar GOD77 (GPD G1 Radeon RX 7600M XT @USB4) AMD Ryzen 7 7735HS 3.2GHz
Radeon RX 7600M XT
max:
204.3 fps
119.4 [X] GPD G1 Radeon RX 7600M XT (USB4 @PCIe x4 3.0) AMD Ryzen 7 7840HS 3.8GHz
Radeon RX 7600M XT
max:
227.9 fps
143.2 [X] GPD G1 Radeon RX 7600M XT (120 Watt, OCuLink @PCIe x4 4.0) AMD Ryzen 7 7840HS 3.8GHz
Radeon RX 7600M XT
max:
241.7 fps
145.8 [X] GPD G1 Radeon RX 7600M XT (OCuLink @PCIe x4 4.0) AMD Ryzen 7 7840HS 3.8GHz
Radeon RX 7600M XT
max:
240.7 fps
146.8 [X] AMD Ryzen 9 7950X 4.5GHz
Radeon RX 7600M XT
max:
239.4 fps
~ 132 fps
+ Vergleich
- Vergleich einklappen
...
...
max:
93.8 [X] Aoostar GOD77 (GPD G1 Radeon RX 7600M XT @USB4) AMD Ryzen 7 7735HS 3.2GHz
Radeon RX 7600M XT
max:
174.9 fps
107.2 [X] GPD G1 Radeon RX 7600M XT (USB4 @PCIe x4 3.0) AMD Ryzen 7 7840HS 3.8GHz
Radeon RX 7600M XT
max:
184.7 fps
107.8 [X] GPD G1 Radeon RX 7600M XT (OCuLink @PCIe x4 4.0) AMD Ryzen 7 7840HS 3.8GHz
Radeon RX 7600M XT
max:
231 fps
120.6 [X] AMD Ryzen 9 7950X 4.5GHz
Radeon RX 7600M XT
max:
199.5 fps
122.8 [X] GPD G1 Radeon RX 7600M XT (120 Watt, OCuLink @PCIe x4 4.0) AMD Ryzen 7 7840HS 3.8GHz
Radeon RX 7600M XT
max:
207.9 fps
~ 110 fps
+ Vergleich
- Vergleich einklappen
...
...
max:
65.4 [X] Aoostar GOD77 (GPD G1 Radeon RX 7600M XT @USB4) AMD Ryzen 7 7735HS 3.2GHz
Radeon RX 7600M XT
max:
119.4 fps
68.4 [X] GPD G1 Radeon RX 7600M XT (USB4 @PCIe x4 3.0) AMD Ryzen 7 7840HS 3.8GHz
Radeon RX 7600M XT
max:
110.4 fps
73.6 [X] GPD G1 Radeon RX 7600M XT (OCuLink @PCIe x4 4.0) AMD Ryzen 7 7840HS 3.8GHz
Radeon RX 7600M XT
max:
114.5 fps
77.5 [X] AMD Ryzen 9 7950X 4.5GHz
Radeon RX 7600M XT
max:
121 fps
78.1 [X] GPD G1 Radeon RX 7600M XT (120 Watt, OCuLink @PCIe x4 4.0) AMD Ryzen 7 7840HS 3.8GHz
Radeon RX 7600M XT
max:
119.3 fps
~ 73 fps
+ Vergleich
- Vergleich einklappen
...
...
max:
26.6 [X] Aoostar GOD77 (GPD G1 Radeon RX 7600M XT @USB4) AMD Ryzen 7 7735HS 3.2GHz
Radeon RX 7600M XT
max:
46.6 fps
30.7 [X] GPD G1 Radeon RX 7600M XT (USB4 @PCIe x4 3.0) AMD Ryzen 7 7840HS 3.8GHz
Radeon RX 7600M XT
max:
49.4 fps
32.5 [X] AMD Ryzen 9 7950X 4.5GHz
Radeon RX 7600M XT
max:
50.9 fps
33.2 [X] GPD G1 Radeon RX 7600M XT (OCuLink @PCIe x4 4.0) AMD Ryzen 7 7840HS 3.8GHz
Radeon RX 7600M XT
max:
49.9 fps
36.7 [X] GPD G1 Radeon RX 7600M XT (120 Watt, OCuLink @PCIe x4 4.0) AMD Ryzen 7 7840HS 3.8GHz
Radeon RX 7600M XT
max:
53.1 fps
~ 32 fps
+ Vergleich
- Vergleich einklappen
...
...
max:
» In Detailstufe max. mit allen getesteten Notebooks spielbar
Additional Benchmarks
Lowest Preset 1920x1080
263 [X] AMD Ryzen 9 7950X 4.5GHz
Radeon RX 7600M XT
max:
450.6 fps
191.4 [X] GPD G1 Radeon RX 7600M XT (OCuLink @PCIe x4 4.0) 1050579
AMD Ryzen 7 7840HS 3.8GHz
Radeon RX 7600M XT
max:
288.7 fps
174.8 [X] GPD G1 Radeon RX 7600M XT (USB4 @PCIe x4 3.0) 1050579
AMD Ryzen 7 7840HS 3.8GHz
Radeon RX 7600M XT
max:
249.9 fps
193.9 [X] GPD G1 Radeon RX 7600M XT (120 Watt, OCuLink @PCIe x4 4.0) 1057599
AMD Ryzen 7 7840HS 3.8GHz
Radeon RX 7600M XT
max:
280.5 fps
138.7 [X] Aoostar GOD77 (GPD G1 Radeon RX 7600M XT @USB4) AMD Ryzen 7 7735HS 3.2GHz
Radeon RX 7600M XT
max:
234.9 fps
107.4 [X] GPD G1 Radeon RX 7600M XT (USB4 @PCIe x4 3.0) 1.47.22.14 D3D12
AMD Ryzen 7 7840HS 3.8GHz
Radeon RX 7600M XT
min:
31.1 fps, P1:
37.7 fps, max:
429 fps
176 [X] Aoostar GOD77 (GPD G1 Radeon RX 7600M XT @USB4) 1.47.22.14 D3D12
AMD Ryzen 7 7735HS 3.2GHz
Radeon RX 7600M XT
min:
43.5 fps, P1:
111.4 fps, max:
380 fps
422 [X] GPD G1 Radeon RX 7600M XT (OCuLink @PCIe x4 4.0) 1.47.22.14 D3D12
AMD Ryzen 7 7840HS 3.8GHz
Radeon RX 7600M XT
min:
215 fps, P1:
299 fps, max:
740 fps
442 [X] GPD G1 Radeon RX 7600M XT (120 Watt, OCuLink @PCIe x4 4.0) 1.47.22.14 D3D12
AMD Ryzen 7 7840HS 3.8GHz
Radeon RX 7600M XT
min:
166.9 fps, P1:
308 fps, max:
791 fps
598 [X] 1.47.22.14 D3D12
AMD Ryzen 9 7950X 4.5GHz
Radeon RX 7600M XT
min:
267 fps, P1:
461 fps, max:
877 fps
~ 349 fps
+ Vergleich
- Vergleich einklappen
...
...
max:
88.9 [X] GPD G1 Radeon RX 7600M XT (USB4 @PCIe x4 3.0) 1.47.22.14 D3D12
AMD Ryzen 7 7840HS 3.8GHz
Radeon RX 7600M XT
min:
25.1 fps, P1:
32.6 fps, max:
349 fps
141.5 [X] Aoostar GOD77 (GPD G1 Radeon RX 7600M XT @USB4) 1.47.22.14 D3D12
AMD Ryzen 7 7735HS 3.2GHz
Radeon RX 7600M XT
min:
77.3 fps, P1:
93.2 fps, max:
301 fps
254 [X] 1.47.22.14 D3D12
AMD Ryzen 9 7950X 4.5GHz
Radeon RX 7600M XT
min:
194.9 fps, P1:
216 fps, max:
352 fps
256 [X] GPD G1 Radeon RX 7600M XT (OCuLink @PCIe x4 4.0) 1.47.22.14 D3D12
AMD Ryzen 7 7840HS 3.8GHz
Radeon RX 7600M XT
min:
177.3 fps, P1:
215 fps, max:
357 fps
257 [X] GPD G1 Radeon RX 7600M XT (120 Watt, OCuLink @PCIe x4 4.0) 1.47.22.14 D3D12
AMD Ryzen 7 7840HS 3.8GHz
Radeon RX 7600M XT
min:
127.1 fps, P1:
210 fps, max:
381 fps
~ 199 fps
+ Vergleich
- Vergleich einklappen
...
...
max:
78.4 [X] GPD G1 Radeon RX 7600M XT (USB4 @PCIe x4 3.0) 1.47.22.14 D3D12
AMD Ryzen 7 7840HS 3.8GHz
Radeon RX 7600M XT
min:
20 fps, P1:
29.8 fps, max:
332 fps
133.9 [X] Aoostar GOD77 (GPD G1 Radeon RX 7600M XT @USB4) 1.47.22.14 D3D12
AMD Ryzen 7 7735HS 3.2GHz
Radeon RX 7600M XT
min:
43.7 fps, P1:
84.8 fps, max:
268 fps
199 [X] Tuxedo Sirius 16 Gen 1 AMD Ryzen 7 7840HS 3.8GHz
Radeon RX 7600M XT
208 [X] 1.47.22.14 D3D12
AMD Ryzen 9 7950X 4.5GHz
Radeon RX 7600M XT
min:
139 fps, P1:
152.4 fps, max:
349 fps
210 [X] GPD G1 Radeon RX 7600M XT (OCuLink @PCIe x4 4.0) 1.47.22.14 D3D12
AMD Ryzen 7 7840HS 3.8GHz
Radeon RX 7600M XT
min:
149.5 fps, P1:
154.4 fps, max:
340 fps
212 [X] GPD G1 Radeon RX 7600M XT (120 Watt, OCuLink @PCIe x4 4.0) 1.47.22.14 D3D12
AMD Ryzen 7 7840HS 3.8GHz
Radeon RX 7600M XT
min:
102.1 fps, P1:
152.3 fps, max:
357 fps
~ 174 fps
+ Vergleich
- Vergleich einklappen
...
...
max:
78.6 [X] GPD G1 Radeon RX 7600M XT (USB4 @PCIe x4 3.0) 1.47.22.14 D3D12
AMD Ryzen 7 7840HS 3.8GHz
Radeon RX 7600M XT
min:
19.7 fps, P1:
30.4 fps, max:
326 fps
126.9 [X] Aoostar GOD77 (GPD G1 Radeon RX 7600M XT @USB4) 1.47.22.14 D3D12
AMD Ryzen 7 7735HS 3.2GHz
Radeon RX 7600M XT
min:
59.8 fps, P1:
78.7 fps, max:
236 fps
173 [X] Tuxedo Sirius 16 Gen 1 AMD Ryzen 7 7840HS 3.8GHz
Radeon RX 7600M XT
180.2 [X] 1.47.22.14 D3D12
AMD Ryzen 9 7950X 4.5GHz
Radeon RX 7600M XT
min:
112.5 fps, P1:
132.6 fps, max:
332 fps
181.3 [X] GPD G1 Radeon RX 7600M XT (OCuLink @PCIe x4 4.0) 1.47.22.14 D3D12
AMD Ryzen 7 7840HS 3.8GHz
Radeon RX 7600M XT
min:
94.4 fps, P1:
133.3 fps, max:
308 fps
182.9 [X] GPD G1 Radeon RX 7600M XT (120 Watt, OCuLink @PCIe x4 4.0) 1.47.22.14 D3D12
AMD Ryzen 7 7840HS 3.8GHz
Radeon RX 7600M XT
min:
57.3 fps, P1:
132.7 fps, max:
349 fps
~ 154 fps
+ Vergleich
- Vergleich einklappen
...
...
max:
103.2 [X] Aoostar GOD77 (GPD G1 Radeon RX 7600M XT @USB4) 1.47.22.14 D3D12
AMD Ryzen 7 7735HS 3.2GHz
Radeon RX 7600M XT
min:
56.9 fps, P1:
68.6 fps, max:
166.2 fps
116 [X] Tuxedo Sirius 16 Gen 1 AMD Ryzen 7 7840HS 3.8GHz
Radeon RX 7600M XT
119.3 [X] 1.47.22.14 D3D12
AMD Ryzen 9 7950X 4.5GHz
Radeon RX 7600M XT
min:
94.7 fps, P1:
97.1 fps, max:
163.7 fps
119.8 [X] GPD G1 Radeon RX 7600M XT (OCuLink @PCIe x4 4.0) 1.47.22.14 D3D12
AMD Ryzen 7 7840HS 3.8GHz
Radeon RX 7600M XT
min:
43.9 fps, P1:
96.9 fps, max:
328 fps
120.4 [X] GPD G1 Radeon RX 7600M XT (120 Watt, OCuLink @PCIe x4 4.0) 1.47.22.14 D3D12
AMD Ryzen 7 7840HS 3.8GHz
Radeon RX 7600M XT
min:
66.7 fps, P1:
96.2 fps, max:
256 fps
~ 116 fps
+ Vergleich
- Vergleich einklappen
...
...
max:
35.4 [X] GPD G1 Radeon RX 7600M XT (USB4 @PCIe x4 3.0) 1.47.22.14 D3D12
AMD Ryzen 7 7840HS 3.8GHz
Radeon RX 7600M XT
min:
16.6 fps, P1:
17.8 fps, max:
263 fps
60.7 [X] Aoostar GOD77 (GPD G1 Radeon RX 7600M XT @USB4) 1.47.22.14 D3D12
AMD Ryzen 7 7735HS 3.2GHz
Radeon RX 7600M XT
min:
43.2 fps, P1:
50.5 fps, max:
83.8 fps
63.9 [X] GPD G1 Radeon RX 7600M XT (OCuLink @PCIe x4 4.0) 1.47.22.14 D3D12
AMD Ryzen 7 7840HS 3.8GHz
Radeon RX 7600M XT
min:
53 fps, P1:
55.6 fps, max:
87.7 fps
64.2 [X] GPD G1 Radeon RX 7600M XT (120 Watt, OCuLink @PCIe x4 4.0) 1.47.22.14 D3D12
AMD Ryzen 7 7840HS 3.8GHz
Radeon RX 7600M XT
min:
43.7 fps, P1:
54.7 fps, max:
111.5 fps
64.7 [X] 1.47.22.14 D3D12
AMD Ryzen 9 7950X 4.5GHz
Radeon RX 7600M XT
min:
56 fps, P1:
57 fps, max:
90.5 fps
~ 58 fps
+ Vergleich
- Vergleich einklappen
...
...
max:
» In Detailstufe max. mit allen getesteten Notebooks spielbar
106 [X] Aoostar GOD77 (GPD G1 Radeon RX 7600M XT @USB4) AMD Ryzen 7 7735HS 3.2GHz
Radeon RX 7600M XT
min:
78 fps, max:
157 fps
108 [X] GPD G1 Radeon RX 7600M XT (USB4 @PCIe x4 3.0) AMD Ryzen 7 7840HS 3.8GHz
Radeon RX 7600M XT
min:
75 fps, max:
166 fps
141 [X] GPD G1 Radeon RX 7600M XT (120 Watt, OCuLink @PCIe x4 4.0) AMD Ryzen 7 7840HS 3.8GHz
Radeon RX 7600M XT
min:
111 fps, max:
186 fps
142 [X] GPD G1 Radeon RX 7600M XT (OCuLink @PCIe x4 4.0) AMD Ryzen 7 7840HS 3.8GHz
Radeon RX 7600M XT
min:
113 fps, max:
182 fps
193 [X] AMD Ryzen 9 7950X 4.5GHz
Radeon RX 7600M XT
min:
153 fps, max:
273 fps
~ 138 fps
+ Vergleich
- Vergleich einklappen
+ 📈 Graph
- 📈 Hide Graph
0 100 200 Tooltip : Ø105.6 (78-157)
: Ø108.5 (75-166)
: Ø141.3 (111-186)
: Ø142.4 (113-182)
: Ø193.5 (153-273)
...
...
max:
81 [X] Aoostar GOD77 (GPD G1 Radeon RX 7600M XT @USB4) AMD Ryzen 7 7735HS 3.2GHz
Radeon RX 7600M XT
min:
52 fps, max:
131 fps
98 [X] GPD G1 Radeon RX 7600M XT (USB4 @PCIe x4 3.0) AMD Ryzen 7 7840HS 3.8GHz
Radeon RX 7600M XT
min:
69 fps, max:
146 fps
125 [X] GPD G1 Radeon RX 7600M XT (120 Watt, OCuLink @PCIe x4 4.0) AMD Ryzen 7 7840HS 3.8GHz
Radeon RX 7600M XT
min:
103 fps, max:
163 fps
127 [X] GPD G1 Radeon RX 7600M XT (OCuLink @PCIe x4 4.0) AMD Ryzen 7 7840HS 3.8GHz
Radeon RX 7600M XT
min:
103 fps, max:
166 fps
161 [X] AMD Ryzen 9 7950X 4.5GHz
Radeon RX 7600M XT
min:
133 fps, max:
199 fps
~ 118 fps
+ Vergleich
- Vergleich einklappen
+ 📈 Graph
- 📈 Hide Graph
0 100 Tooltip : Ø81.4 (52-131)
: Ø97.7 (69-146)
: Ø124.9 (103-163)
: Ø126.8 (103-166)
: Ø161.1 (133-199)
...
...
max:
78 [X] Aoostar GOD77 (GPD G1 Radeon RX 7600M XT @USB4) AMD Ryzen 7 7735HS 3.2GHz
Radeon RX 7600M XT
min:
49 fps, max:
122 fps
93 [X] GPD G1 Radeon RX 7600M XT (USB4 @PCIe x4 3.0) AMD Ryzen 7 7840HS 3.8GHz
Radeon RX 7600M XT
min:
66 fps, max:
139 fps
121 [X] GPD G1 Radeon RX 7600M XT (OCuLink @PCIe x4 4.0) AMD Ryzen 7 7840HS 3.8GHz
Radeon RX 7600M XT
min:
97 fps, max:
158 fps
122 [X] GPD G1 Radeon RX 7600M XT (120 Watt, OCuLink @PCIe x4 4.0) AMD Ryzen 7 7840HS 3.8GHz
Radeon RX 7600M XT
min:
97 fps, max:
159 fps
143 [X] Tuxedo Sirius 16 Gen 1 AMD Ryzen 7 7840HS 3.8GHz
Radeon RX 7600M XT
min:
122 fps, max:
166 fps
152 [X] AMD Ryzen 9 7950X 4.5GHz
Radeon RX 7600M XT
min:
127 fps, max:
183 fps
~ 118 fps
+ Vergleich
- Vergleich einklappen
+ 📈 Graph
- 📈 Hide Graph
0 100 Tooltip : Ø77.8 (49-122)
: Ø93.5 (66-139)
: Ø121.3 (97-158)
: Ø122.3 (97-159)
: Ø151.8 (127-183)
...
...
max:
71 [X] Aoostar GOD77 (GPD G1 Radeon RX 7600M XT @USB4) AMD Ryzen 7 7735HS 3.2GHz
Radeon RX 7600M XT
min:
44 fps, max:
123 fps
86 [X] GPD G1 Radeon RX 7600M XT (USB4 @PCIe x4 3.0) AMD Ryzen 7 7840HS 3.8GHz
Radeon RX 7600M XT
min:
58 fps, max:
129 fps
112 [X] GPD G1 Radeon RX 7600M XT (120 Watt, OCuLink @PCIe x4 4.0) AMD Ryzen 7 7840HS 3.8GHz
Radeon RX 7600M XT
min:
86 fps, max:
148 fps
115 [X] GPD G1 Radeon RX 7600M XT (OCuLink @PCIe x4 4.0) AMD Ryzen 7 7840HS 3.8GHz
Radeon RX 7600M XT
min:
88 fps, max:
148 fps
133 [X] Tuxedo Sirius 16 Gen 1 AMD Ryzen 7 7840HS 3.8GHz
Radeon RX 7600M XT
min:
106 fps, max:
157 fps
141 [X] AMD Ryzen 9 7950X 4.5GHz
Radeon RX 7600M XT
min:
111 fps, max:
173 fps
~ 110 fps
+ Vergleich
- Vergleich einklappen
+ 📈 Graph
- 📈 Hide Graph
0 100 Tooltip : Ø70.9 (44-123)
: Ø86 (58-129)
: Ø112.3 (86-148)
: Ø115 (88-148)
: Ø141.4 (111-173)
...
...
max:
72 [X] Aoostar GOD77 (GPD G1 Radeon RX 7600M XT @USB4) AMD Ryzen 7 7735HS 3.2GHz
Radeon RX 7600M XT
min:
47 fps, max:
118 fps
82 [X] GPD G1 Radeon RX 7600M XT (USB4 @PCIe x4 3.0) AMD Ryzen 7 7840HS 3.8GHz
Radeon RX 7600M XT
min:
55 fps, max:
116 fps
93 [X] Tuxedo Sirius 16 Gen 1 AMD Ryzen 7 7840HS 3.8GHz
Radeon RX 7600M XT
min:
83 fps, max:
109 fps
101 [X] GPD G1 Radeon RX 7600M XT (OCuLink @PCIe x4 4.0) AMD Ryzen 7 7840HS 3.8GHz
Radeon RX 7600M XT
min:
87 fps, max:
119 fps
102 [X] AMD Ryzen 9 7950X 4.5GHz
Radeon RX 7600M XT
min:
89 fps, max:
126 fps
102 [X] GPD G1 Radeon RX 7600M XT (120 Watt, OCuLink @PCIe x4 4.0) AMD Ryzen 7 7840HS 3.8GHz
Radeon RX 7600M XT
min:
90 fps, max:
119 fps
~ 92 fps
+ Vergleich
- Vergleich einklappen
+ 📈 Graph
- 📈 Hide Graph
0 100 Tooltip : Ø71.7 (47-118)
: Ø81.9 (55-116)
: Ø100.8 (87-119)
: Ø101.7 (89-126)
: Ø101.6 (90-119)
...
...
max:
49 [X] Aoostar GOD77 (GPD G1 Radeon RX 7600M XT @USB4) AMD Ryzen 7 7735HS 3.2GHz
Radeon RX 7600M XT
min:
43 fps, max:
59 fps
50 [X] AMD Ryzen 9 7950X 4.5GHz
Radeon RX 7600M XT
min:
44 fps, max:
63 fps
50 [X] GPD G1 Radeon RX 7600M XT (USB4 @PCIe x4 3.0) AMD Ryzen 7 7840HS 3.8GHz
Radeon RX 7600M XT
min:
43 fps, max:
60 fps
51 [X] GPD G1 Radeon RX 7600M XT (OCuLink @PCIe x4 4.0) AMD Ryzen 7 7840HS 3.8GHz
Radeon RX 7600M XT
min:
44 fps, max:
64 fps
51 [X] GPD G1 Radeon RX 7600M XT (120 Watt, OCuLink @PCIe x4 4.0) AMD Ryzen 7 7840HS 3.8GHz
Radeon RX 7600M XT
min:
45 fps, max:
64 fps
~ 50 fps
+ Vergleich
- Vergleich einklappen
+ 📈 Graph
- 📈 Hide Graph
0 Tooltip : Ø49.5 (43-59)
: Ø50.3 (44-63)
: Ø49.6 (43-60)
: Ø50.8 (44-64)
: Ø51.3 (45-64)
...
...
max:
» In Detailstufe max. mit allen getesteten Notebooks spielbar
Additional Benchmarks
Low Preset TAA 1920x1080
184 [X] AMD Ryzen 9 7950X 4.5GHz
Radeon RX 7600M XT
min:
154 fps, max:
229 fps
138 [X] GPD G1 Radeon RX 7600M XT (OCuLink @PCIe x4 4.0) 1050579
AMD Ryzen 7 7840HS 3.8GHz
Radeon RX 7600M XT
min:
111 fps, max:
179 fps
106 [X] GPD G1 Radeon RX 7600M XT (USB4 @PCIe x4 3.0) 1050579
AMD Ryzen 7 7840HS 3.8GHz
Radeon RX 7600M XT
min:
73 fps, max:
163 fps
139 [X] GPD G1 Radeon RX 7600M XT (120 Watt, OCuLink @PCIe x4 4.0) 1057599
AMD Ryzen 7 7840HS 3.8GHz
Radeon RX 7600M XT
min:
113 fps, max:
180 fps
91 [X] Aoostar GOD77 (GPD G1 Radeon RX 7600M XT @USB4) AMD Ryzen 7 7735HS 3.2GHz
Radeon RX 7600M XT
min:
60 fps, max:
143 fps
56.7 [X] Aoostar GOD77 (GPD G1 Radeon RX 7600M XT @USB4) AMD Ryzen 7 7735HS 3.2GHz
Radeon RX 7600M XT
72.7 [X] GPD G1 Radeon RX 7600M XT (USB4 @PCIe x4 3.0) AMD Ryzen 7 7840HS 3.8GHz
Radeon RX 7600M XT
94 [X] GPD G1 Radeon RX 7600M XT (120 Watt, OCuLink @PCIe x4 4.0) AMD Ryzen 7 7840HS 3.8GHz
Radeon RX 7600M XT
105.8 [X] GPD G1 Radeon RX 7600M XT (OCuLink @PCIe x4 4.0) AMD Ryzen 7 7840HS 3.8GHz
Radeon RX 7600M XT
148.4 [X] AMD Ryzen 9 7950X 4.5GHz
Radeon RX 7600M XT
~ 96 fps
+ Vergleich
- Vergleich einklappen
...
...
max:
39.3 [X] Aoostar GOD77 (GPD G1 Radeon RX 7600M XT @USB4) AMD Ryzen 7 7735HS 3.2GHz
Radeon RX 7600M XT
51.9 [X] GPD G1 Radeon RX 7600M XT (USB4 @PCIe x4 3.0) AMD Ryzen 7 7840HS 3.8GHz
Radeon RX 7600M XT
70.4 [X] GPD G1 Radeon RX 7600M XT (120 Watt, OCuLink @PCIe x4 4.0) AMD Ryzen 7 7840HS 3.8GHz
Radeon RX 7600M XT
85.9 [X] GPD G1 Radeon RX 7600M XT (OCuLink @PCIe x4 4.0) AMD Ryzen 7 7840HS 3.8GHz
Radeon RX 7600M XT
116 [X] AMD Ryzen 9 7950X 4.5GHz
Radeon RX 7600M XT
~ 73 fps
+ Vergleich
- Vergleich einklappen
...
...
max:
29 [X] Aoostar GOD77 (GPD G1 Radeon RX 7600M XT @USB4) AMD Ryzen 7 7735HS 3.2GHz
Radeon RX 7600M XT
38.1 [X] GPD G1 Radeon RX 7600M XT (USB4 @PCIe x4 3.0) AMD Ryzen 7 7840HS 3.8GHz
Radeon RX 7600M XT
52.8 [X] GPD G1 Radeon RX 7600M XT (120 Watt, OCuLink @PCIe x4 4.0) AMD Ryzen 7 7840HS 3.8GHz
Radeon RX 7600M XT
67.5 [X] GPD G1 Radeon RX 7600M XT (OCuLink @PCIe x4 4.0) AMD Ryzen 7 7840HS 3.8GHz
Radeon RX 7600M XT
92.2 [X] AMD Ryzen 9 7950X 4.5GHz
Radeon RX 7600M XT
~ 56 fps
+ Vergleich
- Vergleich einklappen
...
...
max:
22.7 [X] Aoostar GOD77 (GPD G1 Radeon RX 7600M XT @USB4) AMD Ryzen 7 7735HS 3.2GHz
Radeon RX 7600M XT
29.6 [X] GPD G1 Radeon RX 7600M XT (USB4 @PCIe x4 3.0) AMD Ryzen 7 7840HS 3.8GHz
Radeon RX 7600M XT
39.2 [X] GPD G1 Radeon RX 7600M XT (120 Watt, OCuLink @PCIe x4 4.0) AMD Ryzen 7 7840HS 3.8GHz
Radeon RX 7600M XT
49.9 [X] GPD G1 Radeon RX 7600M XT (OCuLink @PCIe x4 4.0) AMD Ryzen 7 7840HS 3.8GHz
Radeon RX 7600M XT
63.3 [X] AMD Ryzen 9 7950X 4.5GHz
Radeon RX 7600M XT
~ 41 fps
+ Vergleich
- Vergleich einklappen
...
...
max:
» In Detailstufe hoch mit den meisten getesteten Laptops spielbar
159.5 [X] Aoostar GOD77 (GPD G1 Radeon RX 7600M XT @USB4) 1.3
AMD Ryzen 7 7735HS 3.2GHz
Radeon RX 7600M XT
205 [X] GPD G1 Radeon RX 7600M XT (USB4 @PCIe x4 3.0) 1.3
AMD Ryzen 7 7840HS 3.8GHz
Radeon RX 7600M XT
222 [X] GPD G1 Radeon RX 7600M XT (120 Watt, OCuLink @PCIe x4 4.0) 1.3
AMD Ryzen 7 7840HS 3.8GHz
Radeon RX 7600M XT
226 [X] GPD G1 Radeon RX 7600M XT (OCuLink @PCIe x4 4.0) 1.3
AMD Ryzen 7 7840HS 3.8GHz
Radeon RX 7600M XT
234 [X] 1.3
AMD Ryzen 9 7950X 4.5GHz
Radeon RX 7600M XT
~ 209 fps
+ Vergleich
- Vergleich einklappen
...
...
max:
124.8 [X] GPD G1 Radeon RX 7600M XT (USB4 @PCIe x4 3.0) 1.3
AMD Ryzen 7 7840HS 3.8GHz
Radeon RX 7600M XT
126.5 [X] Aoostar GOD77 (GPD G1 Radeon RX 7600M XT @USB4) 1.3
AMD Ryzen 7 7735HS 3.2GHz
Radeon RX 7600M XT
129.2 [X] GPD G1 Radeon RX 7600M XT (OCuLink @PCIe x4 4.0) 1.3
AMD Ryzen 7 7840HS 3.8GHz
Radeon RX 7600M XT
131.7 [X] 1.3
AMD Ryzen 9 7950X 4.5GHz
Radeon RX 7600M XT
135.2 [X] GPD G1 Radeon RX 7600M XT (120 Watt, OCuLink @PCIe x4 4.0) 1.3
AMD Ryzen 7 7840HS 3.8GHz
Radeon RX 7600M XT
~ 129 fps
+ Vergleich
- Vergleich einklappen
...
max:
76 [X] Aoostar GOD77 (GPD G1 Radeon RX 7600M XT @USB4) 1.3
AMD Ryzen 7 7735HS 3.2GHz
Radeon RX 7600M XT
82.2 [X] GPD G1 Radeon RX 7600M XT (USB4 @PCIe x4 3.0) 1.3
AMD Ryzen 7 7840HS 3.8GHz
Radeon RX 7600M XT
92.4 [X] 1.3
AMD Ryzen 9 7950X 4.5GHz
Radeon RX 7600M XT
93.1 [X] GPD G1 Radeon RX 7600M XT (OCuLink @PCIe x4 4.0) 1.3
AMD Ryzen 7 7840HS 3.8GHz
Radeon RX 7600M XT
95.2 [X] GPD G1 Radeon RX 7600M XT (120 Watt, OCuLink @PCIe x4 4.0) 1.3
AMD Ryzen 7 7840HS 3.8GHz
Radeon RX 7600M XT
~ 88 fps
+ Vergleich
- Vergleich einklappen
...
...
max:
60.8 [X] Aoostar GOD77 (GPD G1 Radeon RX 7600M XT @USB4) 1.3
AMD Ryzen 7 7735HS 3.2GHz
Radeon RX 7600M XT
62.7 [X] GPD G1 Radeon RX 7600M XT (USB4 @PCIe x4 3.0) 1.3
AMD Ryzen 7 7840HS 3.8GHz
Radeon RX 7600M XT
67.1 [X] GPD G1 Radeon RX 7600M XT (OCuLink @PCIe x4 4.0) 1.3
AMD Ryzen 7 7840HS 3.8GHz
Radeon RX 7600M XT
67.7 [X] 1.3
AMD Ryzen 9 7950X 4.5GHz
Radeon RX 7600M XT
68.9 [X] GPD G1 Radeon RX 7600M XT (120 Watt, OCuLink @PCIe x4 4.0) 1.3
AMD Ryzen 7 7840HS 3.8GHz
Radeon RX 7600M XT
~ 65 fps
+ Vergleich
- Vergleich einklappen
...
...
max:
35.2 [X] GPD G1 Radeon RX 7600M XT (USB4 @PCIe x4 3.0) 1.3
AMD Ryzen 7 7840HS 3.8GHz
Radeon RX 7600M XT
35.6 [X] Aoostar GOD77 (GPD G1 Radeon RX 7600M XT @USB4) 1.3
AMD Ryzen 7 7735HS 3.2GHz
Radeon RX 7600M XT
35.8 [X] 1.3
AMD Ryzen 9 7950X 4.5GHz
Radeon RX 7600M XT
36 [X] GPD G1 Radeon RX 7600M XT (OCuLink @PCIe x4 4.0) 1.3
AMD Ryzen 7 7840HS 3.8GHz
Radeon RX 7600M XT
37.2 [X] GPD G1 Radeon RX 7600M XT (120 Watt, OCuLink @PCIe x4 4.0) 1.3
AMD Ryzen 7 7840HS 3.8GHz
Radeon RX 7600M XT
~ 36 fps
+ Vergleich
- Vergleich einklappen
...
...
max:
» In Detailstufe hoch mit allen getesteten Notebooks spielbar
...
max:
...
max:
...
max:
...
max:
max:
...
max:
» In Detailstufe max. mit allen getesteten Notebooks spielbar
...
max:
...
max:
...
...
max:
...
max:
...
max:
» In Detailstufe max. mit allen getesteten Notebooks spielbar
73.3 [X] Aoostar GOD77 (GPD G1 Radeon RX 7600M XT @USB4) AMD Ryzen 7 7735HS 3.2GHz
Radeon RX 7600M XT
min:
65.8 fps, max:
-1 fps
94.5 [X] GPD G1 Radeon RX 7600M XT (USB4 @PCIe x4 3.0) AMD Ryzen 7 7840HS 3.8GHz
Radeon RX 7600M XT
min:
85.3 fps, max:
-1 fps
175.6 [X] GPD G1 Radeon RX 7600M XT (OCuLink @PCIe x4 4.0) AMD Ryzen 7 7840HS 3.8GHz
Radeon RX 7600M XT
min:
152.6 fps, max:
-1 fps
177.3 [X] GPD G1 Radeon RX 7600M XT (120 Watt, OCuLink @PCIe x4 4.0) AMD Ryzen 7 7840HS 3.8GHz
Radeon RX 7600M XT
min:
154.4 fps, max:
-1 fps
228.3 [X] AMD Ryzen 9 7950X 4.5GHz
Radeon RX 7600M XT
min:
190.6 fps, max:
-1 fps
~ 150 fps
+ Vergleich
- Vergleich einklappen
...
...
max:
53.3 [X] Aoostar GOD77 (GPD G1 Radeon RX 7600M XT @USB4) AMD Ryzen 7 7735HS 3.2GHz
Radeon RX 7600M XT
min:
48.8 fps, max:
-1 fps
71.4 [X] GPD G1 Radeon RX 7600M XT (USB4 @PCIe x4 3.0) AMD Ryzen 7 7840HS 3.8GHz
Radeon RX 7600M XT
min:
65.5 fps, max:
-1 fps
152.8 [X] GPD G1 Radeon RX 7600M XT (OCuLink @PCIe x4 4.0) AMD Ryzen 7 7840HS 3.8GHz
Radeon RX 7600M XT
min:
131 fps, max:
-1 fps
161.6 [X] GPD G1 Radeon RX 7600M XT (120 Watt, OCuLink @PCIe x4 4.0) AMD Ryzen 7 7840HS 3.8GHz
Radeon RX 7600M XT
min:
141.9 fps, max:
-1 fps
164 [X] AMD Ryzen 9 7950X 4.5GHz
Radeon RX 7600M XT
min:
142 fps, max:
-1 fps
~ 121 fps
+ Vergleich
- Vergleich einklappen
...
...
max:
51.1 [X] Aoostar GOD77 (GPD G1 Radeon RX 7600M XT @USB4) AMD Ryzen 7 7735HS 3.2GHz
Radeon RX 7600M XT
min:
46.8 fps, max:
-1 fps
69.5 [X] GPD G1 Radeon RX 7600M XT (USB4 @PCIe x4 3.0) AMD Ryzen 7 7840HS 3.8GHz
Radeon RX 7600M XT
min:
63.1 fps, max:
-1 fps
137.8 [X] GPD G1 Radeon RX 7600M XT (120 Watt, OCuLink @PCIe x4 4.0) AMD Ryzen 7 7840HS 3.8GHz
Radeon RX 7600M XT
min:
117.5 fps, max:
-1 fps
141.7 [X] GPD G1 Radeon RX 7600M XT (OCuLink @PCIe x4 4.0) AMD Ryzen 7 7840HS 3.8GHz
Radeon RX 7600M XT
min:
124.3 fps, max:
-1 fps
170.9 [X] AMD Ryzen 9 7950X 4.5GHz
Radeon RX 7600M XT
min:
138.3 fps, max:
-1 fps
~ 114 fps
+ Vergleich
- Vergleich einklappen
...
...
max:
41.7 [X] Aoostar GOD77 (GPD G1 Radeon RX 7600M XT @USB4) AMD Ryzen 7 7735HS 3.2GHz
Radeon RX 7600M XT
min:
37.6 fps, max:
-1 fps
56.1 [X] GPD G1 Radeon RX 7600M XT (USB4 @PCIe x4 3.0) AMD Ryzen 7 7840HS 3.8GHz
Radeon RX 7600M XT
min:
50.1 fps, max:
-1 fps
119.5 [X] AMD Ryzen 9 7950X 4.5GHz
Radeon RX 7600M XT
min:
103.5 fps, max:
-1 fps
130.6 [X] GPD G1 Radeon RX 7600M XT (OCuLink @PCIe x4 4.0) AMD Ryzen 7 7840HS 3.8GHz
Radeon RX 7600M XT
min:
104.1 fps, max:
-1 fps
133.5 [X] GPD G1 Radeon RX 7600M XT (120 Watt, OCuLink @PCIe x4 4.0) AMD Ryzen 7 7840HS 3.8GHz
Radeon RX 7600M XT
min:
114.7 fps, max:
-1 fps
~ 96 fps
+ Vergleich
- Vergleich einklappen
...
...
max:
42.5 [X] Aoostar GOD77 (GPD G1 Radeon RX 7600M XT @USB4) AMD Ryzen 7 7735HS 3.2GHz
Radeon RX 7600M XT
min:
38.2 fps, max:
-1 fps
54.1 [X] GPD G1 Radeon RX 7600M XT (USB4 @PCIe x4 3.0) AMD Ryzen 7 7840HS 3.8GHz
Radeon RX 7600M XT
min:
47.6 fps, max:
-1 fps
91.4 [X] AMD Ryzen 9 7950X 4.5GHz
Radeon RX 7600M XT
min:
81.4 fps, max:
-1 fps
92.9 [X] GPD G1 Radeon RX 7600M XT (120 Watt, OCuLink @PCIe x4 4.0) AMD Ryzen 7 7840HS 3.8GHz
Radeon RX 7600M XT
min:
82.6 fps, max:
-1 fps
95.5 [X] GPD G1 Radeon RX 7600M XT (OCuLink @PCIe x4 4.0) AMD Ryzen 7 7840HS 3.8GHz
Radeon RX 7600M XT
min:
85.7 fps, max:
-1 fps
~ 75 fps
+ Vergleich
- Vergleich einklappen
...
...
max:
» In Detailstufe max. mit allen getesteten Notebooks spielbar
122.8 [X] Aoostar GOD77 (GPD G1 Radeon RX 7600M XT @USB4) AMD Ryzen 7 7735HS 3.2GHz
Radeon RX 7600M XT
min:
21 fps, P0.1:
28.6 fps, P1:
87.5 fps, max:
182.1 fps
170 [X] GPD G1 Radeon RX 7600M XT (USB4 @PCIe x4 3.0) AMD Ryzen 7 7840HS 3.8GHz
Radeon RX 7600M XT
min:
28 fps, P0.1:
39.7 fps, P1:
128.4 fps, max:
241 fps
390 [X] GPD G1 Radeon RX 7600M XT (120 Watt, OCuLink @PCIe x4 4.0) AMD Ryzen 7 7840HS 3.8GHz
Radeon RX 7600M XT
min:
8.09 fps, P0.1:
61.4 fps, P1:
282 fps, max:
565 fps
406 [X] GPD G1 Radeon RX 7600M XT (OCuLink @PCIe x4 4.0) AMD Ryzen 7 7840HS 3.8GHz
Radeon RX 7600M XT
min:
71.3 fps, P0.1:
203 fps, P1:
283 fps, max:
601 fps
487 [X] AMD Ryzen 9 7950X 4.5GHz
Radeon RX 7600M XT
min:
9.42 fps, P0.1:
73.2 fps, P1:
370 fps, max:
920 fps
~ 315 fps
+ Vergleich
- Vergleich einklappen
+ 📈 Graph
- 📈 Hide Graph
0 100 200 300 400 500 Tooltip : Ø130.1 (94.213-272.6)
: Ø173.6 (142.086-225)
: Ø393 (291.053-460.4)
: Ø409 (378.27-465.161)
: Ø491 (403.286-552.3)
...
...
max:
88.3 [X] Aoostar GOD77 (GPD G1 Radeon RX 7600M XT @USB4) AMD Ryzen 7 7735HS 3.2GHz
Radeon RX 7600M XT
min:
32.7 fps, P0.1:
59.1 fps, P1:
72.8 fps, max:
142 fps
121.4 [X] GPD G1 Radeon RX 7600M XT (USB4 @PCIe x4 3.0) AMD Ryzen 7 7840HS 3.8GHz
Radeon RX 7600M XT
min:
43.9 fps, P0.1:
84 fps, P1:
101.2 fps, max:
177.2 fps
300 [X] GPD G1 Radeon RX 7600M XT (120 Watt, OCuLink @PCIe x4 4.0) AMD Ryzen 7 7840HS 3.8GHz
Radeon RX 7600M XT
min:
28.5 fps, P0.1:
188 fps, P1:
245 fps, max:
406 fps
310 [X] GPD G1 Radeon RX 7600M XT (OCuLink @PCIe x4 4.0) AMD Ryzen 7 7840HS 3.8GHz
Radeon RX 7600M XT
min:
75.7 fps, P0.1:
180.6 fps, P1:
236 fps, max:
431 fps
329 [X] AMD Ryzen 9 7950X 4.5GHz
Radeon RX 7600M XT
min:
38.6 fps, P0.1:
172.3 fps, P1:
273 fps, max:
617 fps
~ 230 fps
+ Vergleich
- Vergleich einklappen
+ 📈 Graph
- 📈 Hide Graph
0 100 200 300 400 500 600 700 800 900 1000 1100 1200 1300 1400 1500 1600 1700 1800 1900 2000 2100 2200 2300 2400 2500 2600 2700 2800 2900 3000 3100 3200 3300 3400 3500 3600 3700 3800 3900 4000 4100 4200 4300 4400 4500 4600 4700 4800 4900 5000 5100 5200 5300 5400 5500 5600 5700 5800 5900 6000 6100 6200 6300 6400 6500 6600 6700 6800 6900 7000 7100 7200 7300 7400 7500 7600 7700 7800 7900 8000 8100 8200 8300 8400 8500 8600 8700 8800 8900 9000 9100 9200 9300 9400 Tooltip : Ø92.5 (75.266-149)
: Ø132.4 (110.6-498)
: Ø465 (275.361-9485)
: Ø313 (285.419-408.3)
: Ø339 (306.53-476.6)
...
...
max:
84.8 [X] Aoostar GOD77 (GPD G1 Radeon RX 7600M XT @USB4) AMD Ryzen 7 7735HS 3.2GHz
Radeon RX 7600M XT
min:
30 fps, P0.1:
49.1 fps, P1:
66 fps, max:
149.8 fps
121.9 [X] GPD G1 Radeon RX 7600M XT (USB4 @PCIe x4 3.0) AMD Ryzen 7 7840HS 3.8GHz
Radeon RX 7600M XT
min:
7.79 fps, P0.1:
63.9 fps, P1:
95.6 fps, max:
204 fps
171.7 [X] AMD Ryzen 9 7950X 4.5GHz
Radeon RX 7600M XT
min:
14.7 fps, P0.1:
112.7 fps, P1:
150.2 fps, max:
393 fps
181.8 [X] GPD G1 Radeon RX 7600M XT (OCuLink @PCIe x4 4.0) AMD Ryzen 7 7840HS 3.8GHz
Radeon RX 7600M XT
min:
12 fps, P0.1:
122.2 fps, P1:
151.7 fps, max:
311 fps
189.2 [X] GPD G1 Radeon RX 7600M XT (120 Watt, OCuLink @PCIe x4 4.0) AMD Ryzen 7 7840HS 3.8GHz
Radeon RX 7600M XT
min:
79.1 fps, P0.1:
115.5 fps, P1:
158.8 fps, max:
343 fps
~ 150 fps
+ Vergleich
- Vergleich einklappen
+ 📈 Graph
- 📈 Hide Graph
0 100 200 300 400 Tooltip : Ø87.1 (75.66-117.55)
: Ø124.6 (102.32-162.9)
: Ø178.3 (158.18-352.5)
: Ø185.2 (162.051-215.2)
: Ø196.8 (172.537-444)
...
...
max:
76.4 [X] Aoostar GOD77 (GPD G1 Radeon RX 7600M XT @USB4) AMD Ryzen 7 7735HS 3.2GHz
Radeon RX 7600M XT
min:
30.8 fps, P0.1:
54.9 fps, P1:
62.9 fps, max:
106.4 fps
84.2 [X] Tuxedo Sirius 16 Gen 1 AMD Ryzen 7 7840HS 3.8GHz
Radeon RX 7600M XT
min:
82 fps, P1:
82.6 fps, max:
86.2 fps
97.1 [X] GPD G1 Radeon RX 7600M XT (USB4 @PCIe x4 3.0) AMD Ryzen 7 7840HS 3.8GHz
Radeon RX 7600M XT
min:
40.8 fps, P0.1:
60.3 fps, P1:
79.7 fps, max:
135.8 fps
100.2 [X] AMD Ryzen 9 7950X 4.5GHz
Radeon RX 7600M XT
min:
50.6 fps, P0.1:
55.5 fps, P1:
85.6 fps, max:
277 fps
105 [X] GPD G1 Radeon RX 7600M XT (120 Watt, OCuLink @PCIe x4 4.0) AMD Ryzen 7 7840HS 3.8GHz
Radeon RX 7600M XT
min:
12.6 fps, P0.1:
59.7 fps, P1:
85.7 fps, max:
221 fps
107.2 [X] GPD G1 Radeon RX 7600M XT (OCuLink @PCIe x4 4.0) AMD Ryzen 7 7840HS 3.8GHz
Radeon RX 7600M XT
min:
56.8 fps, P0.1:
61.7 fps, P1:
91.8 fps, max:
214 fps
~ 95 fps
+ Vergleich
- Vergleich einklappen
+ 📈 Graph
- 📈 Hide Graph
0 100 200 300 400 Tooltip : Ø83.2 (67.599-181.4)
Sirius 16 Gen 1: Ø84.2 (82-86.2)
: Ø109 (86.37-425)
: Ø110.2 (90.53-349)
: Ø107.8 (89.915-135)
: Ø110 (97.177-132.5)
...
...
max:
68.5 [X] GPD G1 Radeon RX 7600M XT (USB4 @PCIe x4 3.0) AMD Ryzen 7 7840HS 3.8GHz
Radeon RX 7600M XT
min:
21.4 fps, P0.1:
38.4 fps, P1:
56.7 fps, max:
126.1 fps
69 [X] Aoostar GOD77 (GPD G1 Radeon RX 7600M XT @USB4) AMD Ryzen 7 7735HS 3.2GHz
Radeon RX 7600M XT
min:
19.6 fps, P0.1:
35.6 fps, P1:
55.4 fps, max:
101 fps
71.7 [X] AMD Ryzen 9 7950X 4.5GHz
Radeon RX 7600M XT
min:
35.2 fps, P0.1:
38.2 fps, P1:
60.8 fps, max:
264 fps
75.4 [X] GPD G1 Radeon RX 7600M XT (OCuLink @PCIe x4 4.0) AMD Ryzen 7 7840HS 3.8GHz
Radeon RX 7600M XT
min:
39.8 fps, P0.1:
41.2 fps, P1:
64.3 fps, max:
191.2 fps
75.6 [X] GPD G1 Radeon RX 7600M XT (120 Watt, OCuLink @PCIe x4 4.0) AMD Ryzen 7 7840HS 3.8GHz
Radeon RX 7600M XT
min:
37.4 fps, P0.1:
41 fps, P1:
63.5 fps, max:
214 fps
~ 72 fps
+ Vergleich
- Vergleich einklappen
+ 📈 Graph
- 📈 Hide Graph
0 100 Tooltip : Ø70.9 (61.048-89.5)
: Ø72.5 (60.289-138.5)
: Ø74.7 (65.05-107.6)
: Ø79 (69.363-121.9)
: Ø81 (69.123-194.2)
max:
40.2 [X] GPD G1 Radeon RX 7600M XT (120 Watt, OCuLink @PCIe x4 4.0) AMD Ryzen 7 7840HS 3.8GHz
Radeon RX 7600M XT
min:
20.3 fps, P0.1:
20.7 fps, P1:
33.7 fps, max:
188.6 fps
50.6 [X] GPD G1 Radeon RX 7600M XT (USB4 @PCIe x4 3.0) AMD Ryzen 7 7840HS 3.8GHz
Radeon RX 7600M XT
min:
32.3 fps, P0.1:
35.4 fps, P1:
40.5 fps, max:
95.8 fps
51.9 [X] Aoostar GOD77 (GPD G1 Radeon RX 7600M XT @USB4) AMD Ryzen 7 7735HS 3.2GHz
Radeon RX 7600M XT
min:
29 fps, P0.1:
37.3 fps, P1:
38.6 fps, max:
105 fps
52.2 [X] AMD Ryzen 9 7950X 4.5GHz
Radeon RX 7600M XT
min:
43.1 fps, P0.1:
44.6 fps, P1:
46.9 fps, max:
73.1 fps
52.5 [X] GPD G1 Radeon RX 7600M XT (OCuLink @PCIe x4 4.0) AMD Ryzen 7 7840HS 3.8GHz
Radeon RX 7600M XT
min:
40.9 fps, P0.1:
44.6 fps, P1:
46.3 fps, max:
67.4 fps
54.6 [X] GPD G1 Radeon RX 7600M XT (120 Watt, OCuLink @PCIe x4 4.0) AMD Ryzen 7 7840HS 3.8GHz
Radeon RX 7600M XT
min:
43.3 fps, P0.1:
44.6 fps, P1:
48.7 fps, max:
71.6 fps
~ 50 fps
+ Vergleich
- Vergleich einklappen
+ 📈 Graph
- 📈 Hide Graph
0 100 200 300 400 500 600 700 800 900 1000 1100 1200 1300 1400 1500 1600 1700 1800 1900 2000 2100 2200 2300 2400 2500 2600 2700 2800 2900 3000 3100 3200 3300 3400 3500 3600 3700 3800 3900 4000 4100 4200 4300 4400 Tooltip : Ø43.5 (38.273-76.8)
: Ø58 (51.198-96.9)
: Ø55.2 (47.065-106.1)
: Ø58.1 (48.141-220.6)
: Ø57.8 (48.068-137.4)
: Ø136.4 (49.107-4434)
...
...
max:
» In Detailstufe max. mit allen getesteten Notebooks spielbar
Additional Benchmarks
Ultra Graphics & Postprocessing (HBAO+) 3840x2160
38.9 [X] AMD Ryzen 9 7950X 4.5GHz
Radeon RX 7600M XT
min:
19.5 fps, P0.1:
19.9 fps, P1:
33.3 fps, max:
240 fps
39.4 [X] GPD G1 Radeon RX 7600M XT (OCuLink @PCIe x4 4.0) 1050579
AMD Ryzen 7 7840HS 3.8GHz
Radeon RX 7600M XT
min:
19.9 fps, P0.1:
20.4 fps, P1:
33.6 fps, max:
181.6 fps
37.8 [X] GPD G1 Radeon RX 7600M XT (USB4 @PCIe x4 3.0) 1050579
AMD Ryzen 7 7840HS 3.8GHz
Radeon RX 7600M XT
min:
13.3 fps, P0.1:
20.1 fps, P1:
31.7 fps, max:
120.4 fps
38.5 [X] Aoostar GOD77 (GPD G1 Radeon RX 7600M XT @USB4) AMD Ryzen 7 7735HS 3.2GHz
Radeon RX 7600M XT
min:
9.23 fps, P0.1:
21 fps, P1:
31.4 fps, max:
92.2 fps
Medium Graphics & Postprocessing 1920x1080
210 [X] AMD Ryzen 9 7950X 4.5GHz
Radeon RX 7600M XT
min:
23.3 fps, P0.1:
129.2 fps, P1:
182.7 fps, max:
503 fps
213 [X] GPD G1 Radeon RX 7600M XT (OCuLink @PCIe x4 4.0) 1050579
AMD Ryzen 7 7840HS 3.8GHz
Radeon RX 7600M XT
min:
80 fps, P0.1:
144.6 fps, P1:
178.9 fps, max:
352 fps
119.3 [X] GPD G1 Radeon RX 7600M XT (USB4 @PCIe x4 3.0) 1050579
AMD Ryzen 7 7840HS 3.8GHz
Radeon RX 7600M XT
min:
40.4 fps, P0.1:
85 fps, P1:
100.1 fps, max:
173.7 fps
227 [X] GPD G1 Radeon RX 7600M XT (120 Watt, OCuLink @PCIe x4 4.0) 1057599
AMD Ryzen 7 7840HS 3.8GHz
Radeon RX 7600M XT
min:
74.9 fps, P0.1:
137 fps, P1:
192.8 fps, max:
347 fps
87.6 [X] Aoostar GOD77 (GPD G1 Radeon RX 7600M XT @USB4) AMD Ryzen 7 7735HS 3.2GHz
Radeon RX 7600M XT
min:
10.4 fps, P0.1:
55.4 fps, P1:
72.5 fps, max:
133 fps
133.1 [X] GPD G1 Radeon RX 7600M XT (USB4 @PCIe x4 3.0) AMD Ryzen 7 7840HS 3.8GHz
Radeon RX 7600M XT
min:
4.67 fps, P1:
38.5 fps, max:
394 fps
152.7 [X] Aoostar GOD77 (GPD G1 Radeon RX 7600M XT @USB4) AMD Ryzen 7 7735HS 3.2GHz
Radeon RX 7600M XT
min:
6.05 fps, P1:
100 fps, max:
349 fps
181.3 [X] GPD G1 Radeon RX 7600M XT (OCuLink @PCIe x4 4.0) AMD Ryzen 7 7840HS 3.8GHz
Radeon RX 7600M XT
min:
3.09 fps, P1:
90.9 fps, max:
395 fps
183.1 [X] GPD G1 Radeon RX 7600M XT (120 Watt, OCuLink @PCIe x4 4.0) AMD Ryzen 7 7840HS 3.8GHz
Radeon RX 7600M XT
min:
2.68 fps, P1:
90.9 fps, max:
373 fps
188.4 [X] AMD Ryzen 9 7950X 4.5GHz
Radeon RX 7600M XT
min:
5.4 fps, P1:
200 fps, max:
733 fps
~ 168 fps
+ Vergleich
- Vergleich einklappen
...
...
max:
118.7 [X] GPD G1 Radeon RX 7600M XT (USB4 @PCIe x4 3.0) AMD Ryzen 7 7840HS 3.8GHz
Radeon RX 7600M XT
min:
4.16 fps, P1:
33.3 fps, max:
369 fps
144.5 [X] Aoostar GOD77 (GPD G1 Radeon RX 7600M XT @USB4) AMD Ryzen 7 7735HS 3.2GHz
Radeon RX 7600M XT
min:
6.37 fps, P1:
83.3 fps, max:
340 fps
178.3 [X] GPD G1 Radeon RX 7600M XT (120 Watt, OCuLink @PCIe x4 4.0) AMD Ryzen 7 7840HS 3.8GHz
Radeon RX 7600M XT
min:
3.01 fps, P1:
90.9 fps, max:
359 fps
178.7 [X] GPD G1 Radeon RX 7600M XT (OCuLink @PCIe x4 4.0) AMD Ryzen 7 7840HS 3.8GHz
Radeon RX 7600M XT
min:
4.04 fps, P1:
90.9 fps, max:
280 fps
188 [X] AMD Ryzen 9 7950X 4.5GHz
Radeon RX 7600M XT
min:
3.7 fps, P1:
200 fps, max:
696 fps
~ 162 fps
+ Vergleich
- Vergleich einklappen
...
...
max:
96.8 [X] GPD G1 Radeon RX 7600M XT (USB4 @PCIe x4 3.0) AMD Ryzen 7 7840HS 3.8GHz
Radeon RX 7600M XT
min:
7.8 fps, P1:
32.3 fps, max:
313 fps
113.5 [X] Aoostar GOD77 (GPD G1 Radeon RX 7600M XT @USB4) AMD Ryzen 7 7735HS 3.2GHz
Radeon RX 7600M XT
min:
5.39 fps, P1:
66.7 fps, max:
220 fps
169.2 [X] GPD G1 Radeon RX 7600M XT (OCuLink @PCIe x4 4.0) AMD Ryzen 7 7840HS 3.8GHz
Radeon RX 7600M XT
min:
5.35 fps, P1:
58.8 fps, max:
334 fps
169.7 [X] GPD G1 Radeon RX 7600M XT (120 Watt, OCuLink @PCIe x4 4.0) AMD Ryzen 7 7840HS 3.8GHz
Radeon RX 7600M XT
min:
6.82 fps, P1:
71.4 fps, max:
322 fps
183.7 [X] AMD Ryzen 9 7950X 4.5GHz
Radeon RX 7600M XT
min:
2.1 fps, P1:
125 fps, max:
580 fps
~ 147 fps
+ Vergleich
- Vergleich einklappen
...
...
max:
53.9 [X] GPD G1 Radeon RX 7600M XT (USB4 @PCIe x4 3.0) AMD Ryzen 7 7840HS 3.8GHz
Radeon RX 7600M XT
min:
4.92 fps, P1:
19.2 fps, max:
197 fps
72.1 [X] Aoostar GOD77 (GPD G1 Radeon RX 7600M XT @USB4) AMD Ryzen 7 7735HS 3.2GHz
Radeon RX 7600M XT
min:
8.25 fps, P1:
40 fps, max:
161.8 fps
93.7 [X] AMD Ryzen 9 7950X 4.5GHz
Radeon RX 7600M XT
min:
13.1 fps, P1:
66.7 fps, max:
208 fps
95.6 [X] GPD G1 Radeon RX 7600M XT (OCuLink @PCIe x4 4.0) AMD Ryzen 7 7840HS 3.8GHz
Radeon RX 7600M XT
min:
12 fps, P1:
41.7 fps, max:
179.7 fps
96.5 [X] GPD G1 Radeon RX 7600M XT (120 Watt, OCuLink @PCIe x4 4.0) AMD Ryzen 7 7840HS 3.8GHz
Radeon RX 7600M XT
min:
10.6 fps, P1:
41.7 fps, max:
189.9 fps
~ 82 fps
+ Vergleich
- Vergleich einklappen
...
...
max:
58.1 [X] Aoostar GOD77 (GPD G1 Radeon RX 7600M XT @USB4) AMD Ryzen 7 7735HS 3.2GHz
Radeon RX 7600M XT
min:
8.78 fps, P1:
32.3 fps, max:
125.3 fps
68.4 [X] AMD Ryzen 9 7950X 4.5GHz
Radeon RX 7600M XT
min:
15.6 fps, P1:
47.6 fps, max:
244 fps
69.1 [X] GPD G1 Radeon RX 7600M XT (OCuLink @PCIe x4 4.0) AMD Ryzen 7 7840HS 3.8GHz
Radeon RX 7600M XT
min:
10.7 fps, P1:
41.7 fps, max:
136.8 fps
69.5 [X] GPD G1 Radeon RX 7600M XT (120 Watt, OCuLink @PCIe x4 4.0) AMD Ryzen 7 7840HS 3.8GHz
Radeon RX 7600M XT
min:
35.6 fps, P1:
41.7 fps, max:
137.5 fps
~ 66 fps
+ Vergleich
- Vergleich einklappen
...
...
max:
48.3 [X] GPD G1 Radeon RX 7600M XT (USB4 @PCIe x4 3.0) AMD Ryzen 7 7840HS 3.8GHz
Radeon RX 7600M XT
min:
6.45 fps, P1:
17.5 fps, max:
197.2 fps
68.2 [X] Aoostar GOD77 (GPD G1 Radeon RX 7600M XT @USB4) AMD Ryzen 7 7735HS 3.2GHz
Radeon RX 7600M XT
min:
12 fps, P1:
45.5 fps, max:
252 fps
73.3 [X] AMD Ryzen 9 7950X 4.5GHz
Radeon RX 7600M XT
min:
10.6 fps, P1:
52.6 fps, max:
278 fps
73.9 [X] GPD G1 Radeon RX 7600M XT (OCuLink @PCIe x4 4.0) AMD Ryzen 7 7840HS 3.8GHz
Radeon RX 7600M XT
min:
9.97 fps, P1:
50 fps, max:
232 fps
75.2 [X] GPD G1 Radeon RX 7600M XT (120 Watt, OCuLink @PCIe x4 4.0) AMD Ryzen 7 7840HS 3.8GHz
Radeon RX 7600M XT
min:
14.7 fps, P1:
50 fps, max:
179.5 fps
~ 68 fps
+ Vergleich
- Vergleich einklappen
...
...
max:
» In Detailstufe max. mit allen getesteten Notebooks spielbar
Additional Benchmarks
Highest Settings possible 16xAF 4xMSAA + FXAA 3840x2160
31.5 [X] AMD Ryzen 9 7950X 4.5GHz
Radeon RX 7600M XT
min:
5.34 fps, P1:
23.3 fps, max:
185.7 fps
31.7 [X] GPD G1 Radeon RX 7600M XT (OCuLink @PCIe x4 4.0) 1050579
AMD Ryzen 7 7840HS 3.8GHz
Radeon RX 7600M XT
min:
10.4 fps, P1:
23.3 fps, max:
100.6 fps
21.1 [X] GPD G1 Radeon RX 7600M XT (USB4 @PCIe x4 3.0) 1050579
AMD Ryzen 7 7840HS 3.8GHz
Radeon RX 7600M XT
min:
5.16 fps, P1:
12.5 fps, max:
107.9 fps
31.9 [X] GPD G1 Radeon RX 7600M XT (120 Watt, OCuLink @PCIe x4 4.0) 1057599
AMD Ryzen 7 7840HS 3.8GHz
Radeon RX 7600M XT
min:
8.06 fps, P1:
23.3 fps, max:
107.6 fps
30 [X] Aoostar GOD77 (GPD G1 Radeon RX 7600M XT @USB4) AMD Ryzen 7 7735HS 3.2GHz
Radeon RX 7600M XT
min:
7.07 fps, P1:
21.3 fps, max:
82.6 fps
Normal/Off 4xAF 1920x1080
189.4 [X] AMD Ryzen 9 7950X 4.5GHz
Radeon RX 7600M XT
min:
4.69 fps, P1:
125 fps, max:
733 fps
177.7 [X] GPD G1 Radeon RX 7600M XT (OCuLink @PCIe x4 4.0) 1050579
AMD Ryzen 7 7840HS 3.8GHz
Radeon RX 7600M XT
min:
3.94 fps, P1:
90.9 fps, max:
376 fps
128.6 [X] GPD G1 Radeon RX 7600M XT (USB4 @PCIe x4 3.0) 1050579
AMD Ryzen 7 7840HS 3.8GHz
Radeon RX 7600M XT
min:
4.41 fps, P1:
38.5 fps, max:
396 fps
178.8 [X] GPD G1 Radeon RX 7600M XT (120 Watt, OCuLink @PCIe x4 4.0) 1057599
AMD Ryzen 7 7840HS 3.8GHz
Radeon RX 7600M XT
min:
3.88 fps, P1:
90.9 fps, max:
399 fps
145.2 [X] Aoostar GOD77 (GPD G1 Radeon RX 7600M XT @USB4) AMD Ryzen 7 7735HS 3.2GHz
Radeon RX 7600M XT
min:
4.78 fps, P1:
90.9 fps, max:
329 fps
Lowest Settings possible 1920x1080
188.5 [X] AMD Ryzen 9 7950X 4.5GHz
Radeon RX 7600M XT
min:
3 fps, P1:
200 fps, max:
794 fps
182.2 [X] GPD G1 Radeon RX 7600M XT (OCuLink @PCIe x4 4.0) 1050579
AMD Ryzen 7 7840HS 3.8GHz
Radeon RX 7600M XT
min:
2.68 fps, P1:
90.9 fps, max:
346 fps
139.5 [X] GPD G1 Radeon RX 7600M XT (USB4 @PCIe x4 3.0) 1050579
AMD Ryzen 7 7840HS 3.8GHz
Radeon RX 7600M XT
min:
4.56 fps, P1:
38.5 fps, max:
423 fps
183.6 [X] GPD G1 Radeon RX 7600M XT (120 Watt, OCuLink @PCIe x4 4.0) 1057599
AMD Ryzen 7 7840HS 3.8GHz
Radeon RX 7600M XT
min:
2.01 fps, P1:
90.9 fps, max:
388 fps
152.5 [X] Aoostar GOD77 (GPD G1 Radeon RX 7600M XT @USB4) AMD Ryzen 7 7735HS 3.2GHz
Radeon RX 7600M XT
min:
4.11 fps, P1:
100 fps, max:
381 fps
 Deutsch
 English
 Español
 Français
 Italiano
 Nederlands
 Polski
 Português
 Русский
 Türkçe
 Svenska
 Chinese
 Magyar